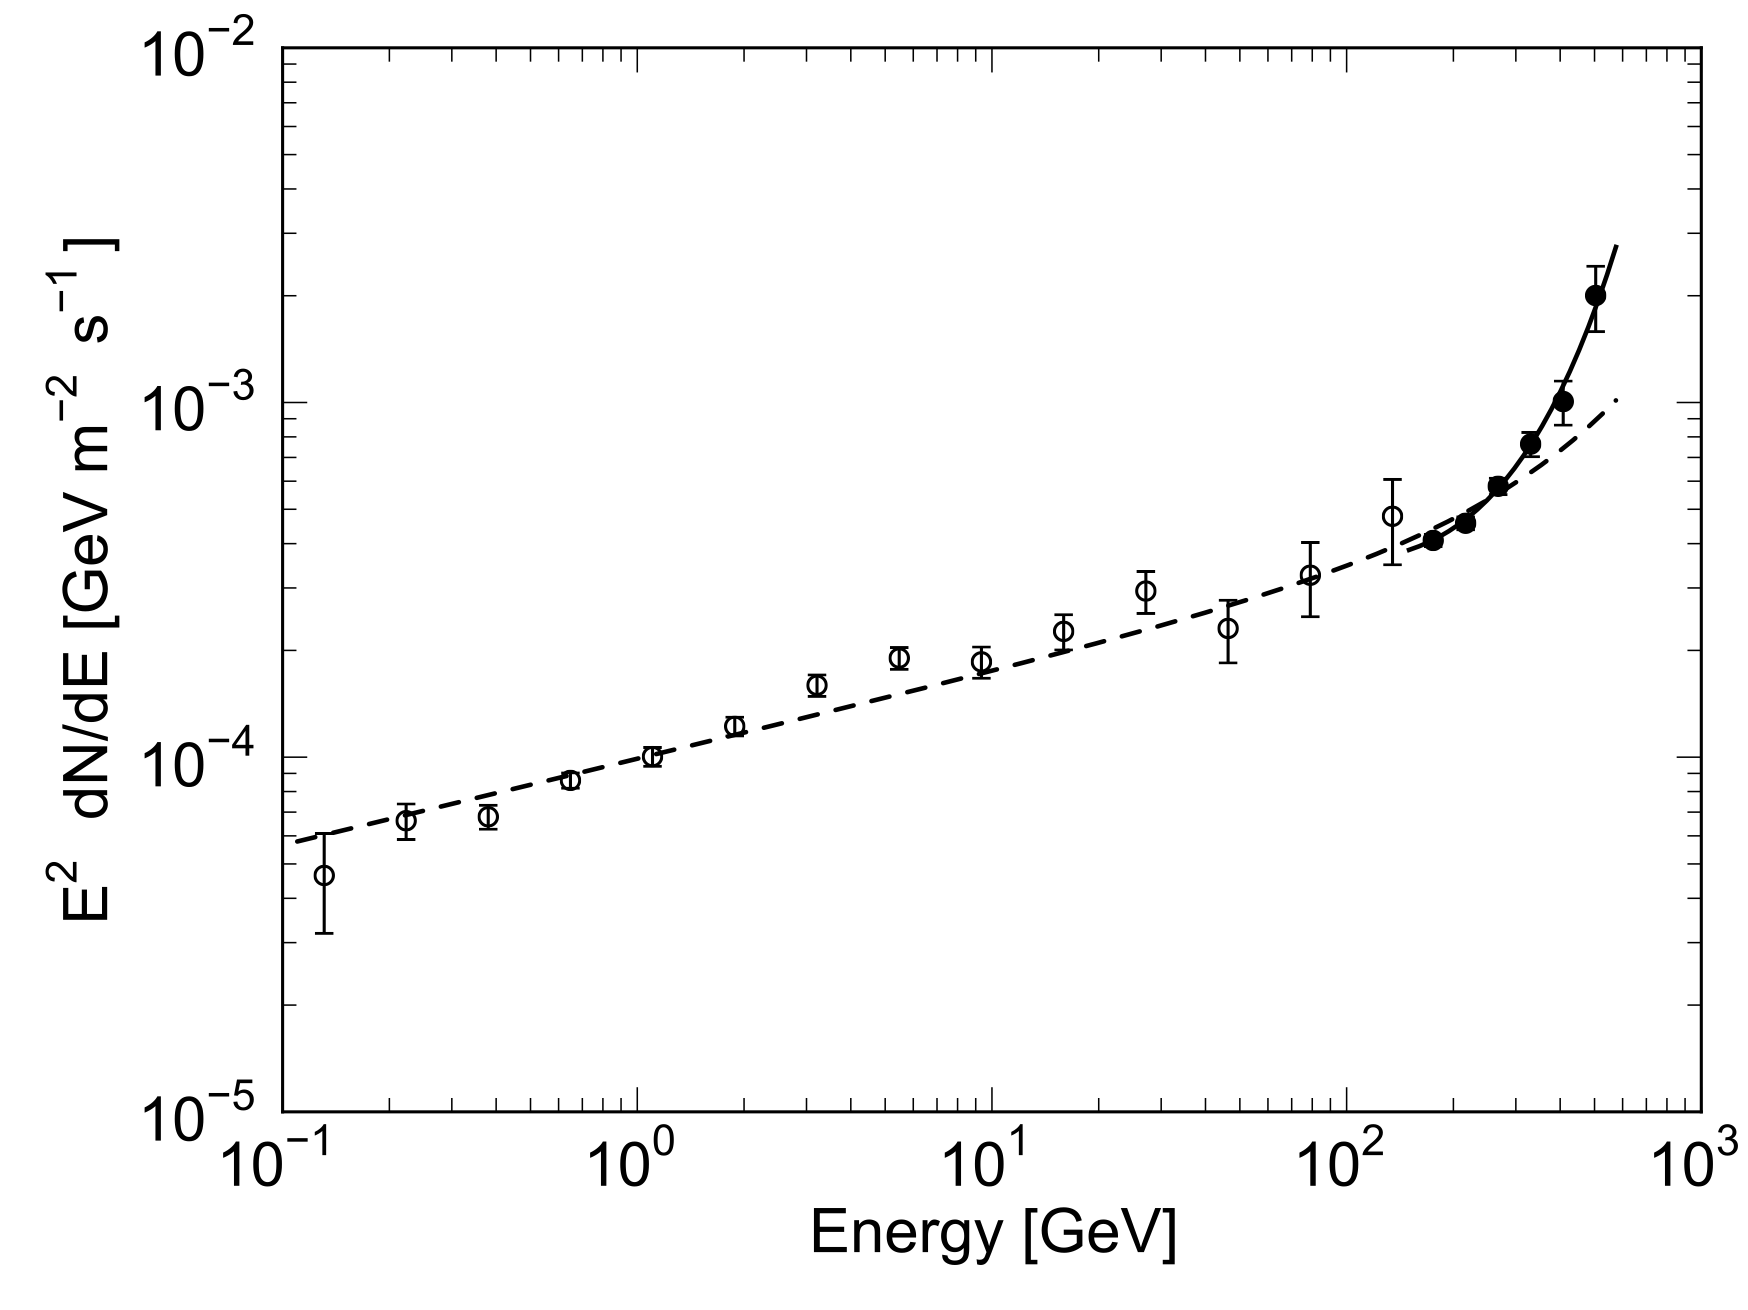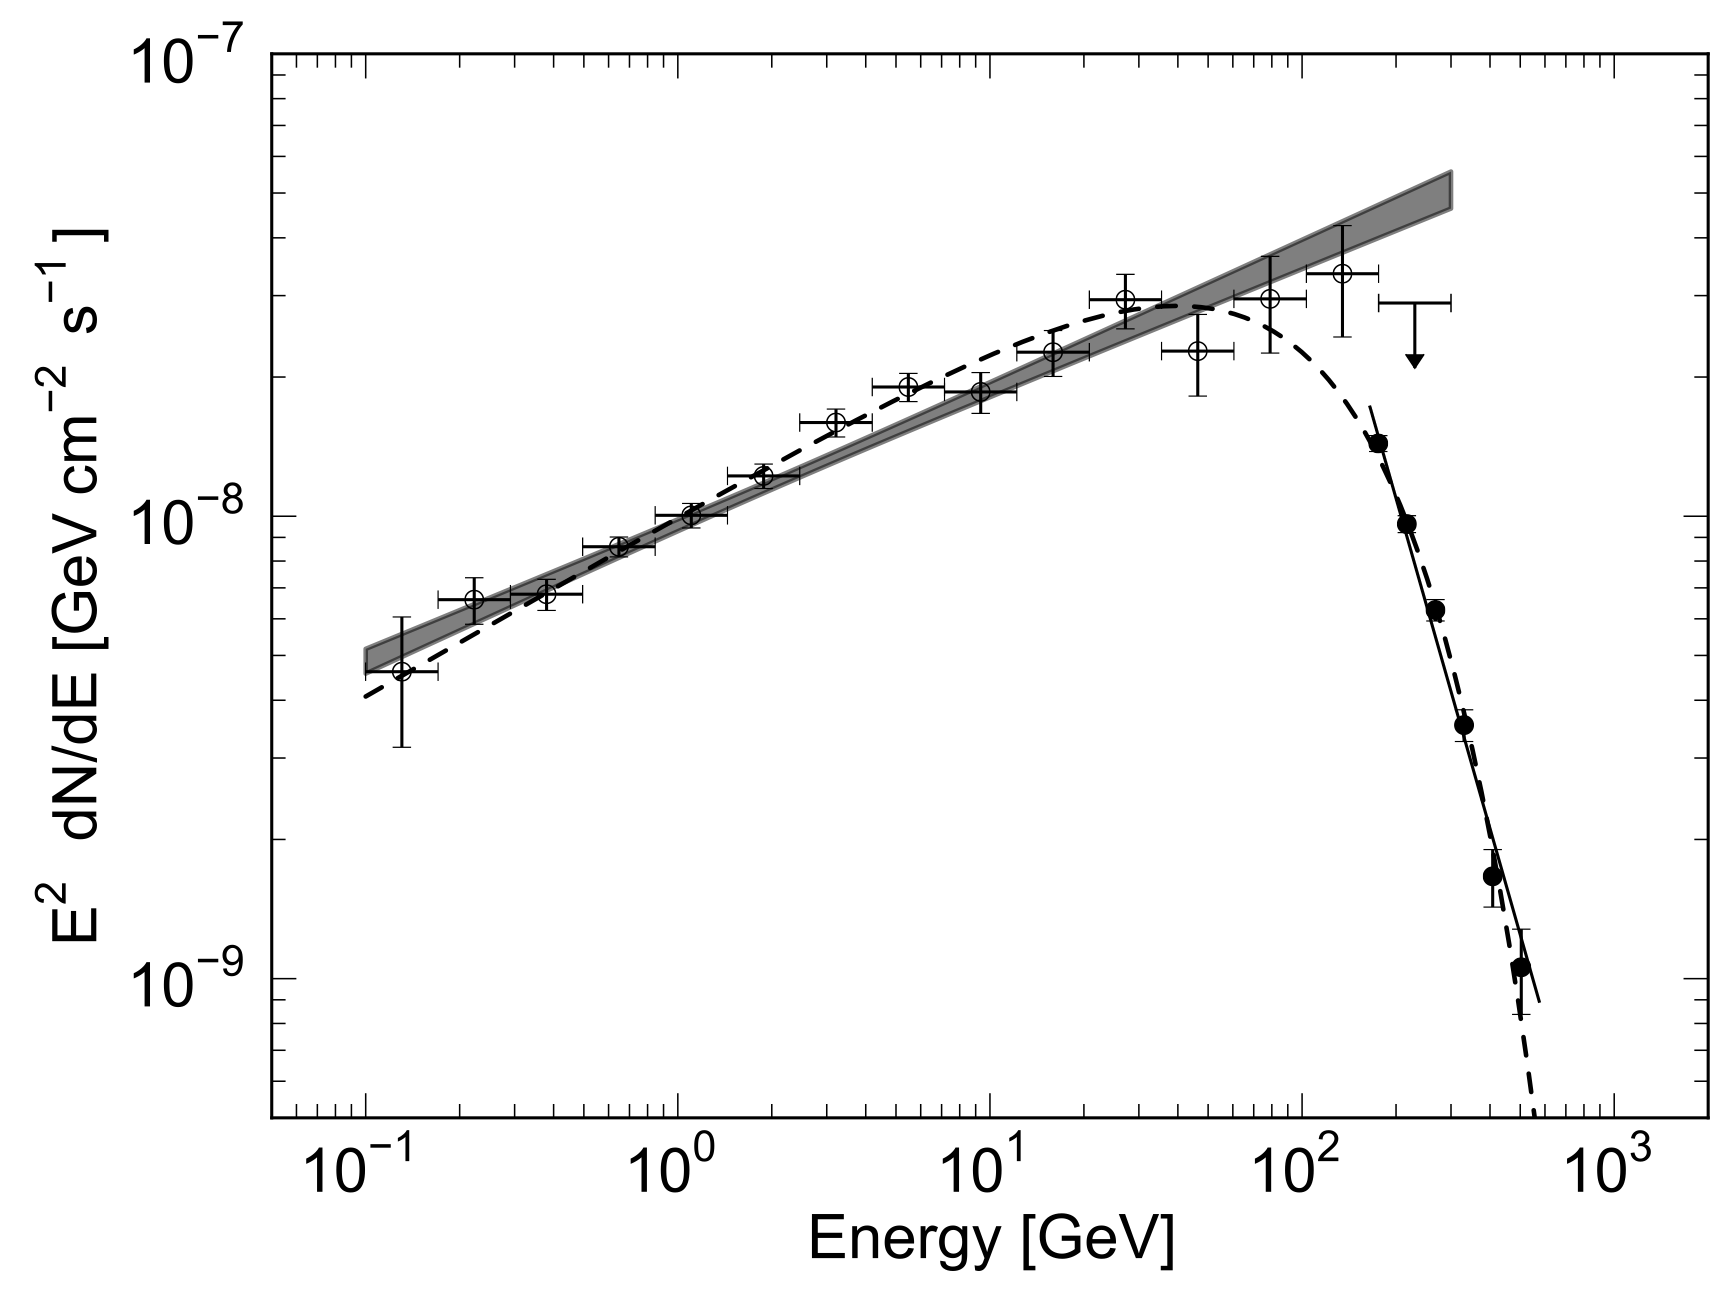
Fermi-LAT spectrum of PG 1553+113 (grey shaded area and open data points) plotted along with the VERITAS spectrum (solid black data points and line). For details, see Figure 1 below.

Reference: E. Aliu et al. (The VERITAS Collaboration), Astrophysical Journal 799: 7, 2015

Full text version

ArXiv: ArXiV:1411.1439

Contacts: Frank Krennrich

The gamma-ray spectra of distant blazars such as PG 1553+113 provide a unique probe of the cosmological radiative energy that was released during the formation of stars and galaxies and possibly other exotic processes. This everlasting light is collectively called the extragalactic background light (EBL). Galaxy surveys at ultraviolet, optical and infrared wavelengths provide estimates of a minimal level of EBL photons present in intergalactic space. Such a lower limit to the EBL can be used to estimate the opacity of the universe for gamma rays traversing this fog on cosmological distance scales.

In this paper we present the energy spectrum of PG 1553+113 over an energy range of 0.2 GeV - 0.8 TeV measured with unprecedented statistical precision using data from the Fermi-LAT  and VERITAS.  The spectrum reveals a sharp spectral cutoff at 102 GeV (± 2.5 GeV), allowing one to test the origin of this spectral feature.  

Given the minimum EBL calculated from galaxy counts and distance estimates of PG 1553+113, it appears that the cutoff is largely caused by the gamma-ray opacity.  However, distance estimates of PG 1553+113 lack an unambiguous redshift measurement based on spectral lines, and currently rely on indirect constraints.  While lower limits to the redshift (z > 0.395) based on optical/UV observations of PG 1553+113 can be considered firm, to date upper limits are highly uncertain.

Upper limits to the redshift can be derived from tests using a range of gamma-ray opacities.  The opacity is calculated based on the minimal EBL present as derived from galaxy counts and allowing the redshift to vary. The opacity is then used to correct the observed gamma ray spectrum yielding the intrinsic energy spectrum of PG 1553+113.  Using a redshift that is larger than the actual redshift of PG 1553+113 results in an overestimate of the gamma-ray opacity, which will result in a source spectrum appearing too hard with an exponential rise towards higher energies. Exponential rises with energy are considered unphysical for the non-thermal spectra of blazars and can be ruled out.  This line of argument provides a strong constraint on the actual redshift of PG 1553+113.

By using a well measured energy spectrum, combined with a minimal EBL based on galaxy counts, and the consideration of the effects of  evolution of the EBL, we derive a firm upper limit to the redshift of PG 1553+113 of z < 0.62, thereby giving a well-constrained redshift range of 0.395  < z < 0.62.


FITS files: N/A


Figures from paper (click to get full size image):


Figure 1:  Fermi-LAT spectrum of PG 1553+113 (grey shaded area and open data points) plotted along with the VERITAS spectrum (solid black data points and line). The highest energy bin in the Fermi-LAT spectrum represents the 95% confi dence level upper limit of the flux in this bin. The dashed lines shows the best fit to the combined spectrum using a power law with an exponential cuto ff.
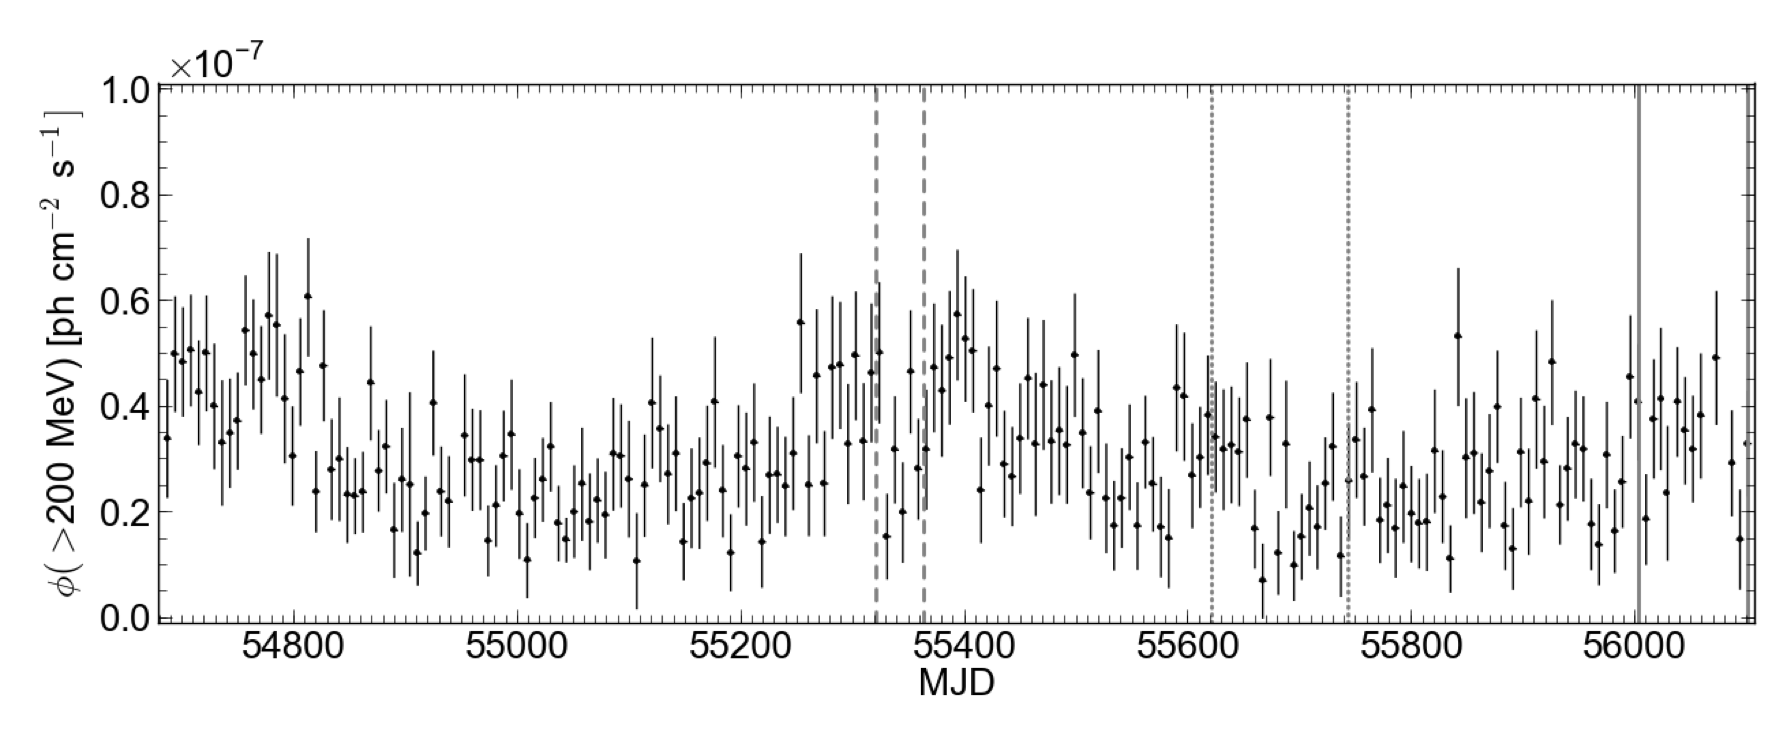
Figure 2: Fermi-LAT PG 1553+113 weekly integral flux lightcurve above 200 MeV. The grey dashed, dotted, and solid lines indicate the time periods of VERITAS observations during 2010 (May 4 - June 17), 2011 (February 28 - July 4), and 2012 (March 15 - June 24), respectively. The detailed VERITAS light curves and the corresponding observing dates can be seen from Figures 3, 4 and 5.

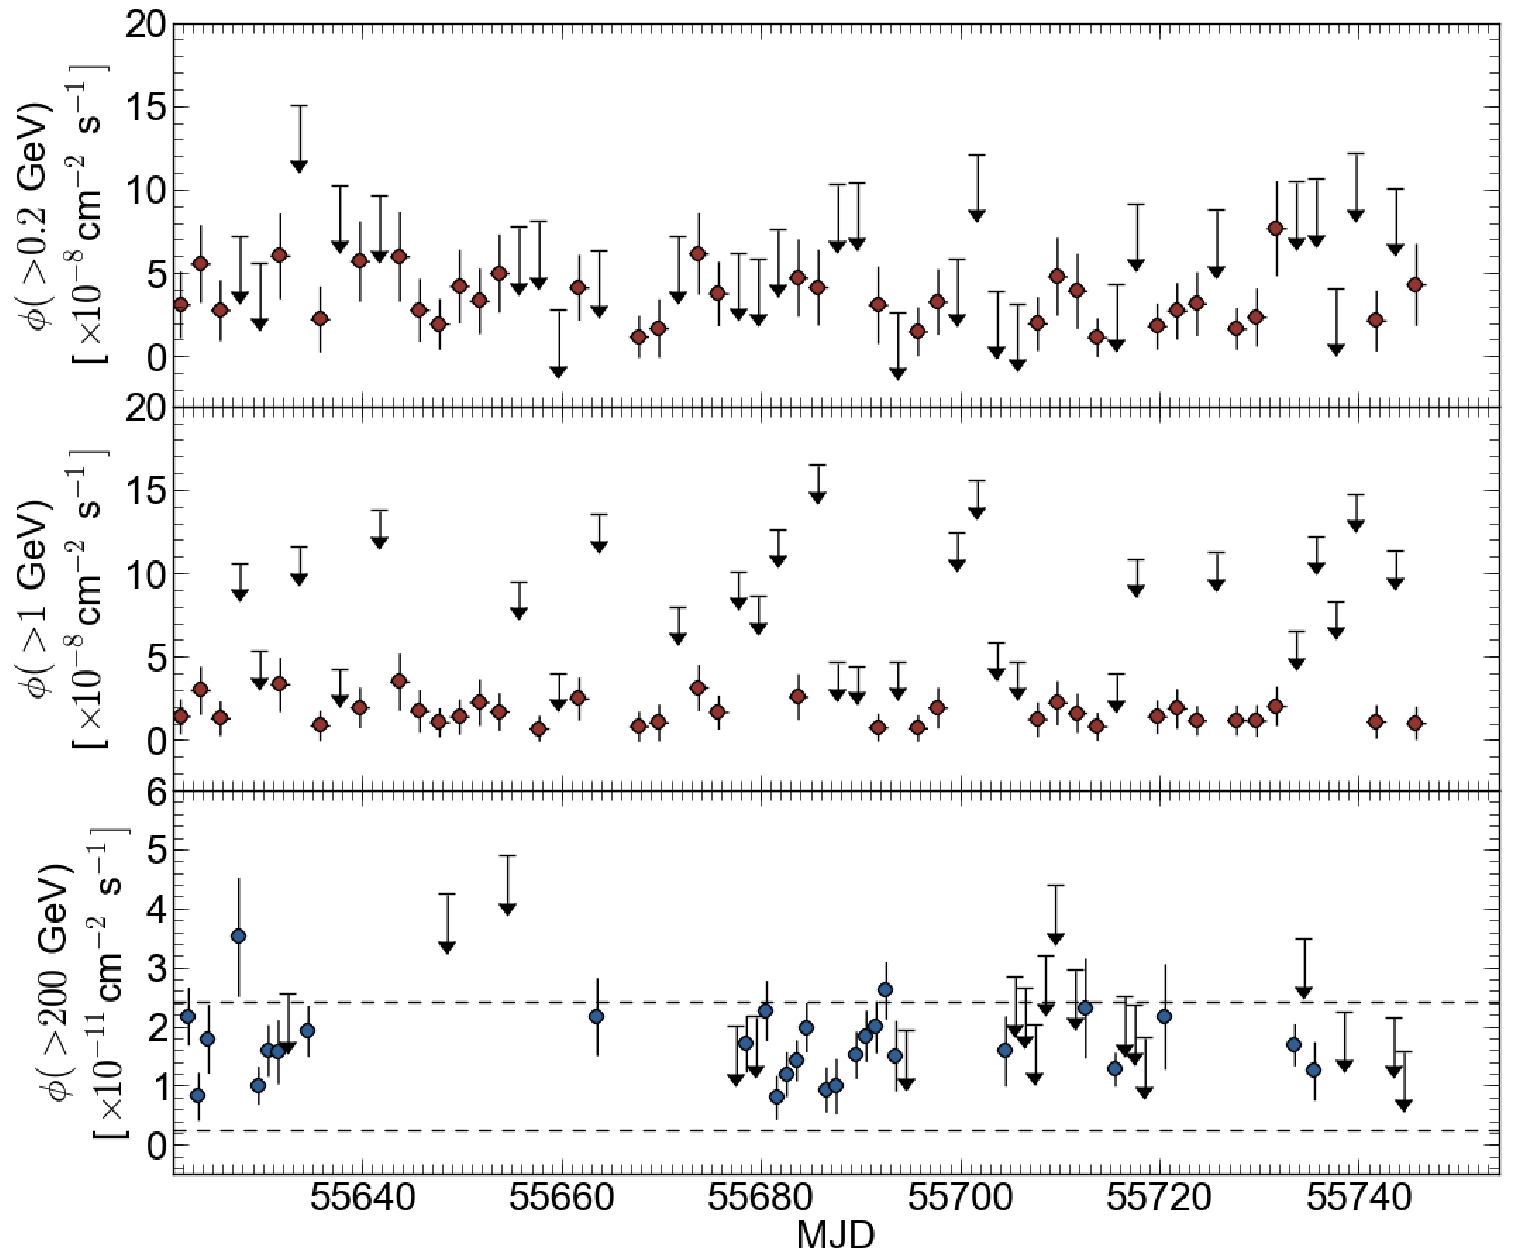
Figure 3: Fermi-LAT PG 1553+113 bi-daily flux light curve (2010) above 200MeV (upper plot) and above 1 GeV (middle plot), in units of cm-2s-1, for the time periods contemporaneous with VERITAS observations and VERITAS daily integral flux light curve above 200 GeV (lower plot), in units of cm-2s-1 (note, for space reasons we do not use notation of ph cm-2s-1). The upper and lower dashed lines indicate the integral fluxes above 200 GeV corresponding to 10% and 1% of the Crab Nebula flux, respectively. The black arrows in all light curves represent 2σ upper limits.

Figure 4: Fermi-LAT PG 1553+113 bi-daily flux light curve (2011) above 200MeV (upper plot) and 1 GeV (middle plot), in units of cm-2s-1, for the time periods contemporaneous with VERITAS observations, and VERITAS daily integral flux light curve above 200 GeV (lower plot), in units of cm-2s-1. The upper and lower dashed lines indicate the integral fluxes above 200 GeV corresponding to 10% and 1% of the Crab Nebula flux, respectively. The black arrows represent 2σ upper limits.

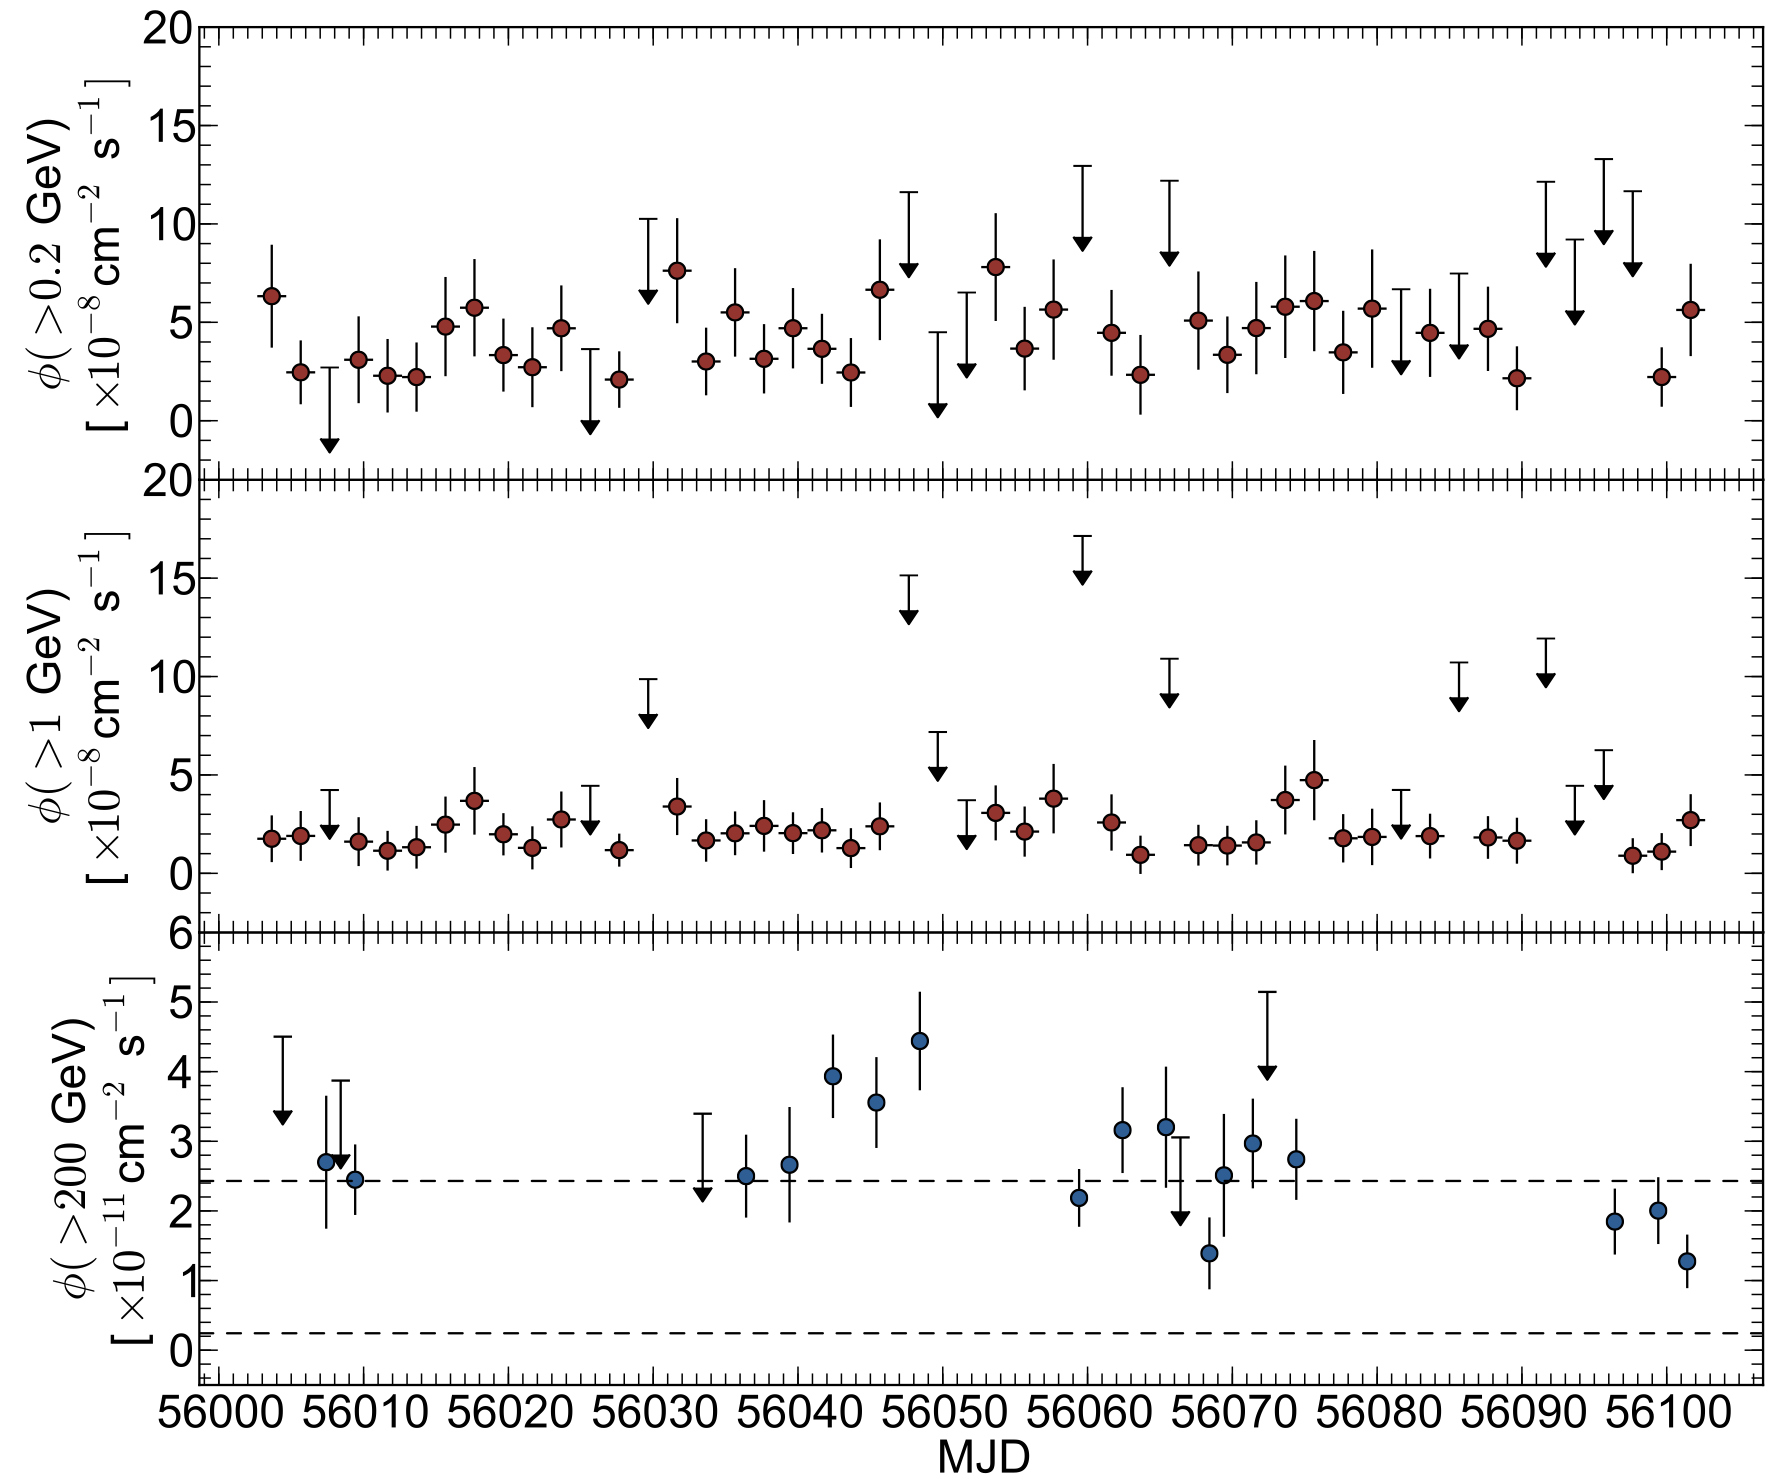
Figure 5: Fermi-LAT PG 1553+113 bi-daily flux light curve (2012) above 200MeV (upper plot) and 1 GeV (middle plot), in units of cm-2s-1, for the time periods contemporaneous with VERITAS observations, and VERITAS daily integral flux light curve above 200 GeV (lower plot), in units of cm-2s-1. The upper and lower dashed lines indicate the integral fluxes above 200 GeV corresponding to 10% and 1% of the Crab Nebula flux, respectively. The black arrows represent 2σ upper limits.

Figure 6: High-energy (open circle data points) and VHE (fi lled circle data points) intrinsic spectrum for PG 1553+113 assuming the EBL model of Kneiske & Dole (2010) and a redshift of z = 0.53. The solid curve represents the best fi t to the intrinsic VHE spectrum using a power law with an exponential rise and was the fi t used to set the upper limit on the source redshift. The dashed curve shows the best fi t to the intrinsic spectrum covering the full energy range of Fermi-LAT and VERITAS.