It is commonly believed that elliptical galaxies form during mergers of smaller spiral galaxies. Elliptical galaxies are generally more massive than spirals, and host a supermassive black hole in their centers that powers jets of relativistic particles that often emit very energetic gamma-ray emission. One of the recent surprises in high-energy astrophysics has been the discovery of gamma-ray emission from a handful of Seyfert 1-class spiral galaxies, which were not thought to be powerful enough to produce stable relativistic jets. In this paper, several telescopes report observations of one gamma-ray emitting Seyfert 1 galaxy: PMN J0948+0022. For the first time, one of these objects was observed during a gamma-ray flare by VERITAS, resulting in the first upper limit on the emission of a gamma-ray emitting Seyfert 1 galaxy at energies higher than 100 giga-electronvolts. The non-detection by VERITAS sets a limit to the maximum energy of the particles that are accelerated in the jet of PMN J0948+00022, adding a crucial piece of information to our still limited knowledge of the emission mechanisms behind these surprisingly powerful class of gamma-ray sources.
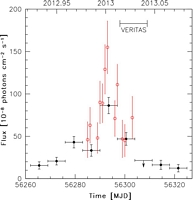
Figure 1: Integrated flux light curve of PMN J0948+0022 obtained by Fermi-LAT in the 0.1–100 GeV energy range during 2012 December 1–2013 January 31 with 7-day time bins. Arrow refers to 2σ upper limits on the source flux. Upper limits are computed when TS < 10. Open circles represent daily fluxes reported for the periods of high activity. No upper limits are shown for daily data. The horizontal line indicates the period of the VERITAS observation.
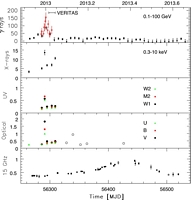
Figure 2: Multifrequency light curve for PMN J0948+0022. The period covered is 2012 December 1 – 2013 August 31 (MJD 56262–56535). The data were collected (from top to bottom) by Fermi-LAT (γ rays; in units of 10−8 ph cm−2s−1), Swift-XRT (0.3–10 keV; in units of 10−12 erg cm−2s−1), Swift-UVOT (w1, m2, and w2 filters; in units of mJy), CRTS (open circles; in units of mJy) and Swift-UVOT (v, b, and u filters; in units of mJy), MOJAVE (open circles) and OVRO (15 GHz; in units of Jy). The horizontal line in the top panel indicates the period of the VERITAS observation.
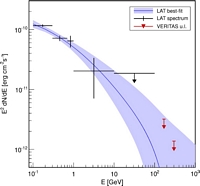
Figure 3: SED of PMN J0948+0022 in the MeV-to-TeV energy range. The Fermi-LAT spectrum was extrapolated to the TeV energies and corrected for EBL absorption using the model of Finke et al. (2010). Fermi-LAT and VERITAS data points and upper limits are shown. VERITAS upper limits are calculated at the energy threshold of the analysis and where the correlation between flux level and spectral shape is minimal.
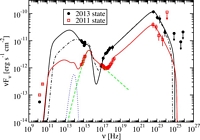
Figure 4: SEDs and models for the 2013 and 2011 activity states from PMN J0948+0022. The filled circles are the data from the 2013 flaring state, and the open squares are the data from the 2011 intermediate state taken from D’Ammando et al. (2014). The dashed curve indicates the disc and coronal emission, and the dotted line indicates the thermal dust emission. Solid lines represent models consistent with scattering dust torus radiation, while the dashed-dotted curve represents a model consistent with the scattering of BLR Hα (6563 ˚A) radiation. Arrows refer to 2σ upper limits on the source flux. The VERITAS upper limits are corrected for EBL absorption using the model of Finke et al. (2010).
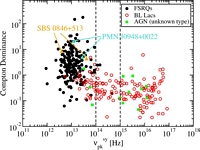
Figure 5: The Compton dominance versus peak synchrotron frequency for sources from the 2LAC (Ackermann et al. 2011), along with two states of SBS 0846+513 (D’Ammando et al. 2013a) and PMN J0948+0022 (this work). Filled circles represent FSRQs, empty circles represent BL Lac objects, and filled squares represent AGN of unknown type. Adapted from Finke (2013a). PMN J0948+0022 and SBS 0846+513 are plotted as triangles.


