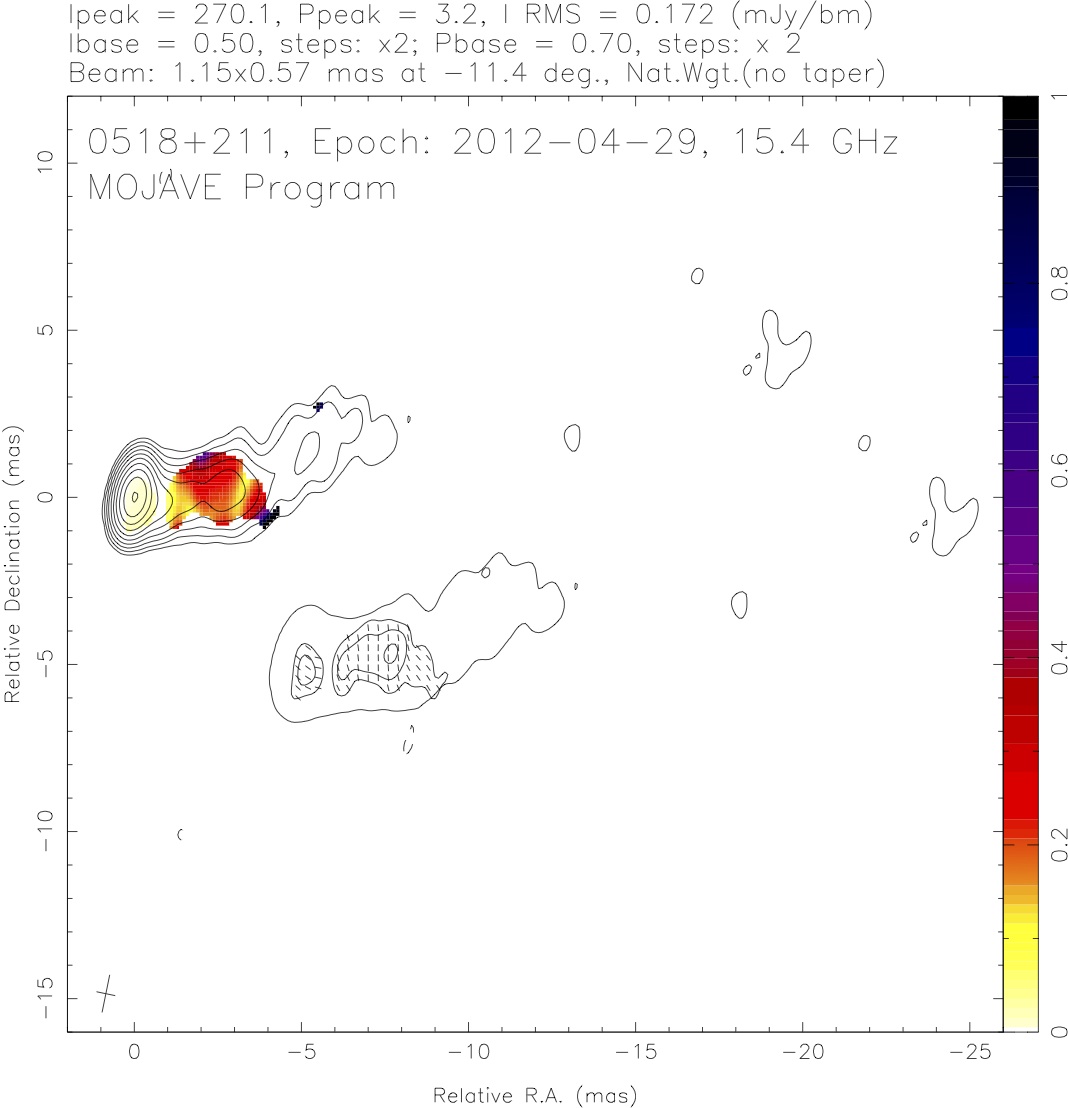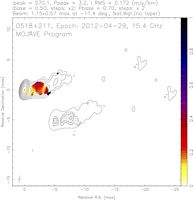
15 GHz MOJAVE VLBA composite image of RGB J0521.8+2112. See Figure 7 below for details.
Reference: S. Archambault et al. (The VERITAS Collaboration), Astrophysical Journal 776: 69, 2013
The VERITAS observatory detected a new source of TeV gamma rays in Fall of 2009: VER J0521+211. Most observations by ground-based gamma-ray observatories like VERITAS target known objects (typically active galactic nuclei, supernova remnants, X-ray binaries or pulsars) whose X-ray properties make them good candidates for TeV emission. But in the case of VER J0521+211, VERITAS observations were triggered by the discovery of a cluster of high-energy photons in the data from the Fermi gamma-ray satellite. While the Fermi-LAT data indicated the presence of a potential TeV emitter, the origin of the gamma-ray emission was initially unknown.
VERITAS detected a clear gamma-ray signal above 200 GeV in less than four hours of observation in October 2009, and continued observing during that Fall and Winter to fully characterize the source, accumulating a signal with significance of 16 standard deviations in 15 hours. The newly-discovered gamma-ray source was cataloged with the name VER J0521+211. VER J0521+211 lies only 3 degrees away from the Crab Nebula, the first-detected TeV emitter (by the Whipple 10m telescope in 1989[1]) and the brightest and best-studied gamma-ray source in the sky. The Whipple 10m telescope, and later the VERITAS array, had been observing the Crab Nebula and the region around it for more than two decades, just missing VER J0521+211 outside the edge of their field of view.
Triggered by the VERITAS detection; radio, optical, and X-ray observatories looked at VER J0521+211 to better characterize the source and establish the origin of the gamma-ray emission. These observations, together with a detailed study of its gamma-ray emission, will soon appear in an article in The Astrophysical Journal[2], where VER J0521+211 is classified as a blazar, i.e. an active galactic nucleus whose relativistic jet is aligned to our line of sight within a small angle. Blazars produce a continuum of partially polarized synchrotron emission from radio to X-ray frequencies, which was confirmed by optical observations at the MDM and Steward Observatories in Arizona. VER J0521+211 appeared as a point-like source in the X-ray observations by the Swift satellite, as well as in the VERITAS data. That is as expected for blazars, that are very compact and distant objects. However, radio interferometry observations at the Very Long Baseline Array, having a resolution about hundred thousand times better than gamma-ray observatories, resolved the jet of VER J0521+211, finally confirming its blazar nature.
The measured gamma-ray flux was significantly variable over the three months of observations, with an average of about one tenth the brightness of the Crab Nebula in gamma rays. This is a remarkably high level of gamma-ray emission for a newly-discovered source, making VER J0521+211 the brightest blazar discovered since 2002. At an estimated distance of 500 megaparsecs[3], the jet power of VER J0521+211 is 3 x 10^37 watts, 100 billion times more powerful than the Sun. This discovery gives us a chance to study in detail how relativistic jets dissipate energy and interact with their environment in one of the most powerful systems known to date.
- T. C. Weekes et al., "Observation of TeV gamma rays from the Crab nebula using the atmospheric Cerenkov imaging technique", The Astrophysical Journal 342 (1989) 379.
- S. Archambault et al. "Discovery of a new TeV gamma-ray source: VER J 0521+211", The Astrophysical Journal, to appear in Vol 776 (2013).
- M. S. Shaw et al., "Spectroscopy of the Largest Ever Gamma-Ray-selected BL Lac Sample", The Astrophysical Journal 764 (2013) 135.
FITS files: not yet available.
Figures from paper (click to get full size image):
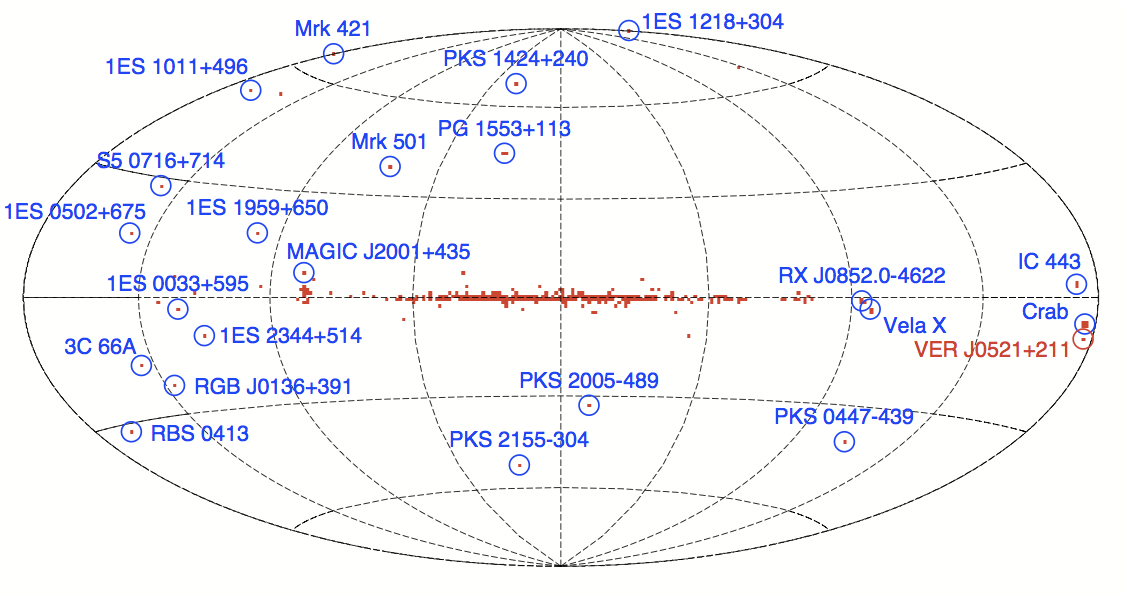
Figure 1: A map, in Galactic coordinates, showing the arrival directions of all diffuse-class photon events with zenith angle < 105o recorded by Fermi -LAT between 2008 Aug 4 and 2009 Aug 25 with reconstructed energies greater than 30 GeV. The events are binned in 1o bins, and bins containing at least 5 events are shaded red. Known TeV sources coincident with shaded bins are indicated in regions
where source confusion or diffuse background is not an issue.
Figure 2: Time-averaged differential photon spectrum of VER J0521+211, obtained during VERITAS observations between MJD 55126 (2009 Oct 22) and MJD 55212 (2010 Jan 16). Upper limits at 95% confidence level are shown for the two highest energy points, where the significance is < 2 σ.
Figure 3: VERITAS (E > 0.2 TeV), Fermi-LAT (0.1−300 GeV), and Swift-XRT (0.3-10 keV) light curves of VER J0521+211. Photon fluxes are calculated in 1-day bins for VERITAS and Swift- XRT, and 29.5 days for Fermi-LAT. The VERITAS light curve shows significant flux points (black dots) when the signal exceeds 2 σ, and 95% confidence level upper limits (black arrows) together with flux points (gray dots) for marginal detections. The error bars on the Swift-XRT rates are at the ˜ 2−7% level, and are not visible in the plot.
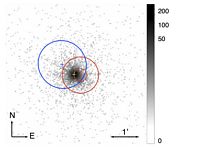
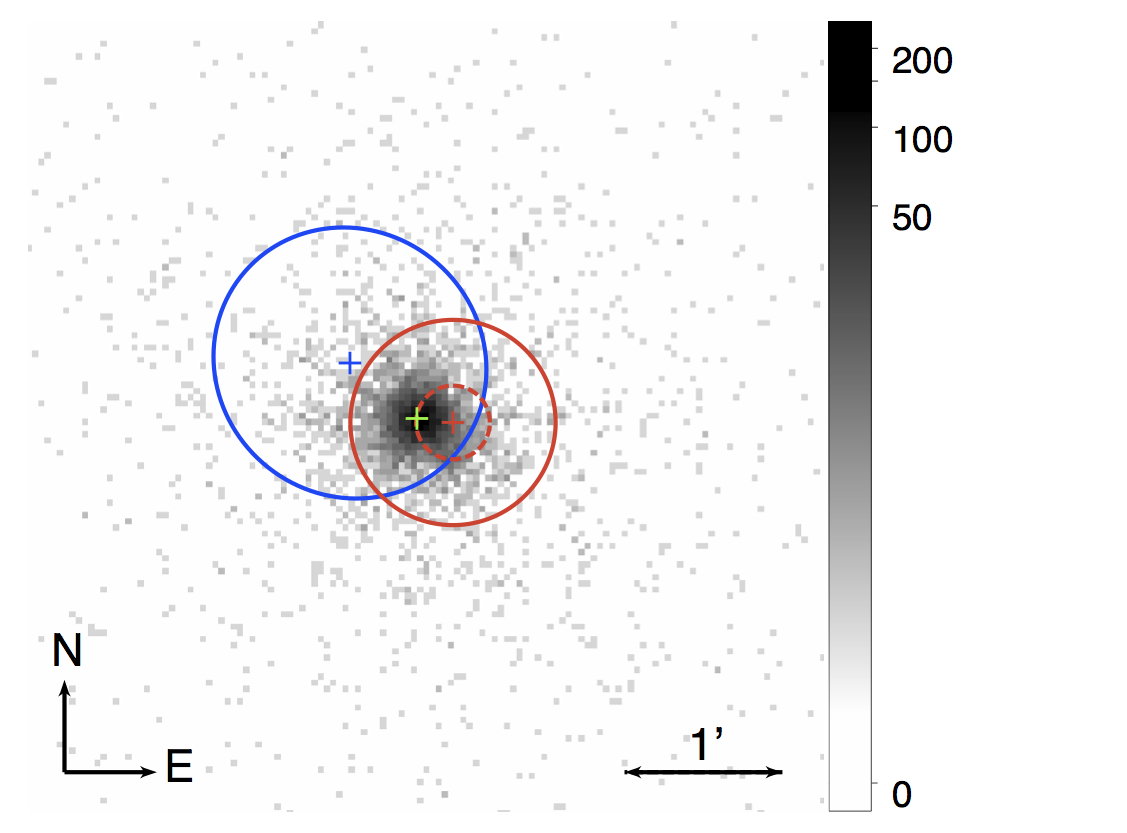
Figure 4: Swift-XRT cumulative counts map in the 0.3-10 keV band, zoomed-in at the location of VER J0521+211. The field is 5' ~ 5', with gray code indicating counts on a logarithmic scale. The green cross indicates the best-fit centroid to the Swift-XRT data. The red cross shows the position of VER J0521+211 with red dashed circle indicating the VERITAS 68% statistical location error and red-solid line showing statistical and systematic error. The blue ellipse displays 68% error contour of 2FGL J0521.7+2113 as measured by Fermi-LAT (Nolan et al. 2012).
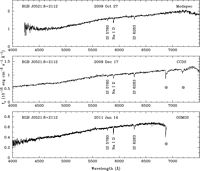
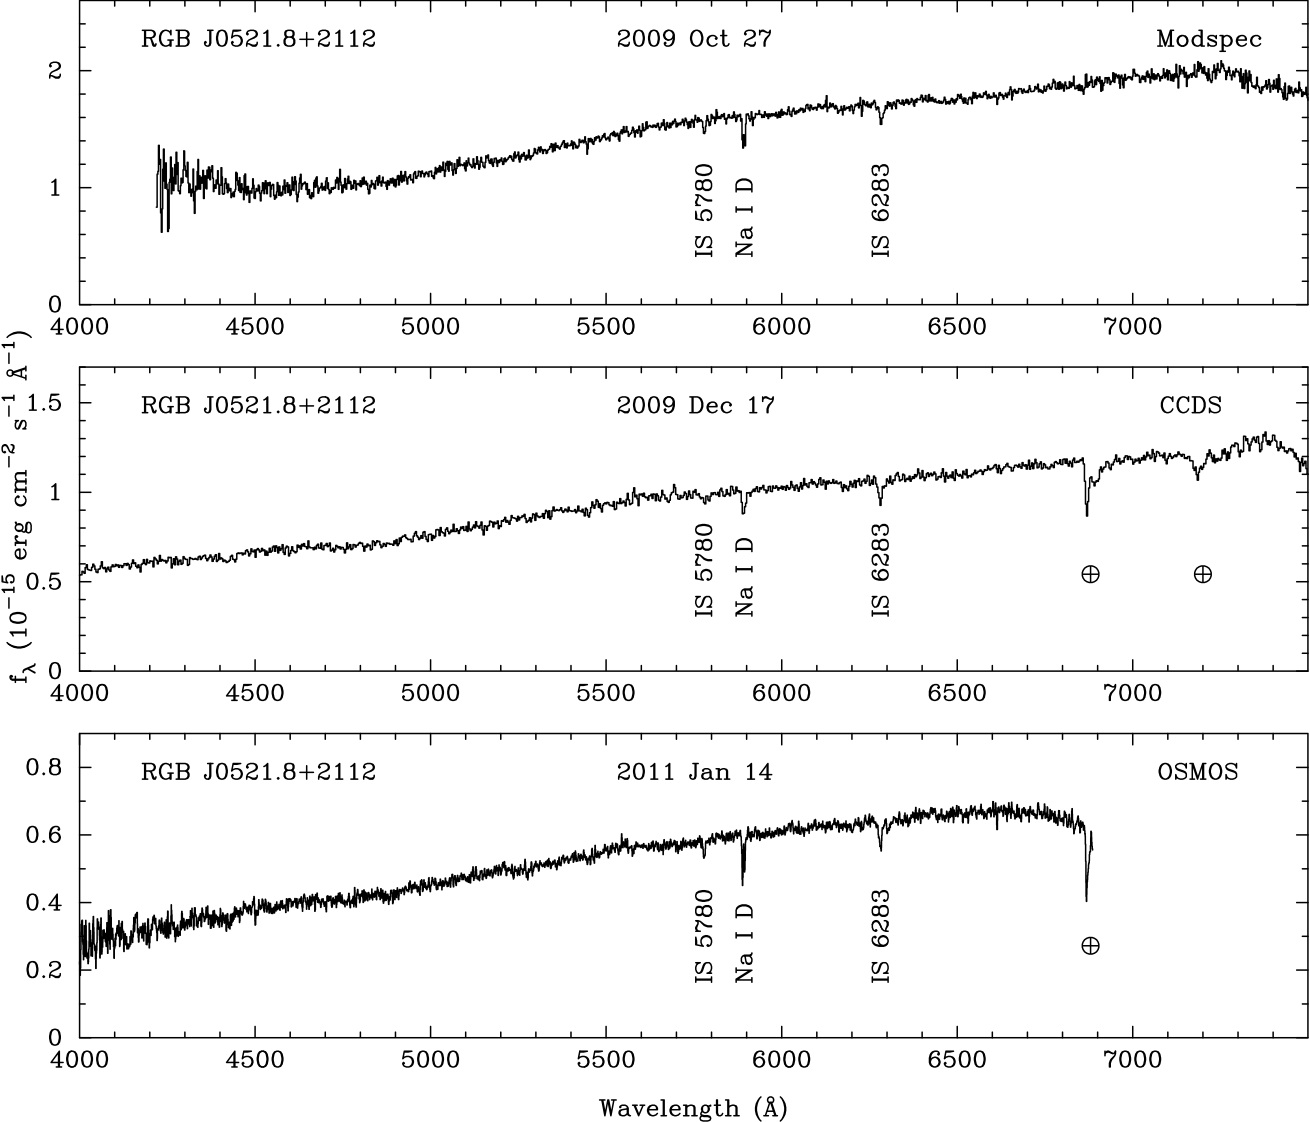
Figure 5: Optical spectra of RGB J0521.8+2112 obtained on the 2.4m Hiltner telescope of the MDM Observatory. The Modspec spectrum was obtained with an exposure of 2 × 600 s and a resolution of 4 °A. The exposures for the CCDS and OSMOS spectra were 3 × 1800 s with resolution of 8 °A and 3 °A, respectively. Galactic interstellar absorption lines are labeled with their wavelength, including the Na I D doublet and diffuse interstellar bands at 5780 °A and 6283 °A. These are relatively prominent because of the low Galactic latitude of −8.7o and the corresponding visual extinction AV = 1.9 (Schlafly & Finkbeiner 2011) to the source. Telluric absorption by O2 and H2O are indicated in the CCDS and OSMOS spectra; in the case of Modspec they were corrected using the spectrum of a featureless B star.
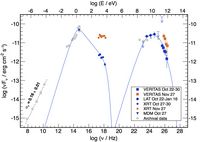
Figure 6: Spectral energy distribution of VER J0521+211 during the VERITAS detection. Optical, X-ray, GeV and TeV data are shown for the low emission state (blue markers) and for the X-ray and TeV flare on 2009 November 27 (orange markers). Archival data points are shown in gray: radio (Cohen et al. 2007; Gregory et al. 1996; White & Becker 1992; Jackson et al. 2007; Condon et al. 1998), infrared (Wright et al. 2010; Cutri et al. 2003), optical (Monet et al. 2003; Drake et al. 2009), and gamma rays (Nolan et al. 2012). Archival radio data at 15 GHz is from the OVRO program and was obtained following Richards et al. (2011). Optical and infrared data are corrected for Galactic extinction using Schlafly & Finkbeiner (2011). A dashed black line shows the fit of the radio data to a power law with F ν ˜ν-α . The solid blue curve represents a one-zone SSC emission model with parameters adjusted to describe the low-state data, assuming z = 0.1. Radio data points are not reproduced by the model, as they are expected to sample outer regions of the blazar jet, where the emission becomes optically thin to radio waves.
Figure 7: 15 GHz MOJAVE VLBA composite image of RGB J0521.8+2112 on 2012 April 29. The top left image shows contours of total intensity, with fractional linear polarization overlaid in color scale. The bottom right image shows contours of linear polarization, plus a single outermost contour of total intensity. Electric polarization vector directions are plotted as equal-length
ticks. The contour levels for total intensity are 0.5 mJy/beam in steps of 2, while those for polarized intensity are for 0.7 mJy/beam in steps of 2. The restoring beam is indicated in the bottom left
corner, and has Gaussian FWHM dimensions 1.15 by 0.57 mas, with major axis at -11.4 degrees from north.
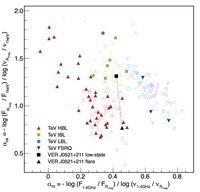
Figure 8: Spectral slopes of the synchrotron component for gamma-ray blazars. The effective spectral indices ro and ox are defined in the usual way between 1.4 GHz, 6590 °A and 1 keV. SED classifications for the 47 known TeV blazars (filled markers) are taken from TeVCat (Wakely & Horan 2008). Multiband fluxes are obtained from Massaro et al. (2009) with the exceptions of RX J0648.7+1516, HESS J1943+213 and MAGIC J2001+435 (Condon et al. 1998; Monet et al. 2003; Voges et al. 1999; Bassani et al. 2009). Empty markers show GeVdetected blazars from Nolan et al. (2012) present in Massaro et al. (2009). VER J0521+211 is pictured in a “low-state” (2009 Oct 22 − 30) showing a spectral shape characteristic of IBLs, and in “flare” (2009 Nov 27), when it shows HBL-like properties.