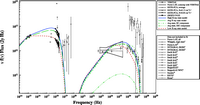
Leptonic SSC+EC models for the three SEDs. For details, see Figure 7 below.
Reference: E. Aliu et al. (The VERITAS Collaboration), Astrophysical Journal 775: 3, 2013
1ES 1959+650 is a high-frequency peaked BL Lac (HBL) object with redshift z=0.047. It has previously exhibited dramatic very high energy (VHE; E > 100 GeV) flaring episodes, most notably on 2002 June 4, when a gamma-ray flare without an increase in X-ray emission was detected from the source, providing the first unambiguous example of an "orphan" gamma-ray flare.
VERITAS observed 1ES 1959+650 as part of a routine blazar program monitoring for enhanced emission in the period 2007 - 2011. During this time, the source never met the threshold criteria to be deemed to be in a flaring state. VERITAS observed 1ES 1959+650 for a total of 7.6 hours in this period, and detected the source at 16.4 standard deviation (σ) significance. Due to a mean recorded VHE gamma-ray flux of 23% of the Crab Nebula flux, the source is considered to be in a low flux state throughout these observations.
A multiwavelength spectral energy distribution (SED) is constructed from contemporaneous data from VERITAS, Fermi-LAT, RXTE PCA, and Swift UVOT. Swift XRT data is not included in the SED due to a lack of simultaneous observations with VERITAS. In contrast to the orphan gamma-ray flare exhibited by this source in 2002, the X-ray flux is found to vary by an order of magnitude, while other energy regimes exhibit less variable emission. A quasi-equilibrium synchrotron self-Compton model with an additional external radiation field is used to describe three SEDs corresponding to the lowest, highest, and average X-ray states.
FITS files: N/A
Figures from paper (click to get full size image):
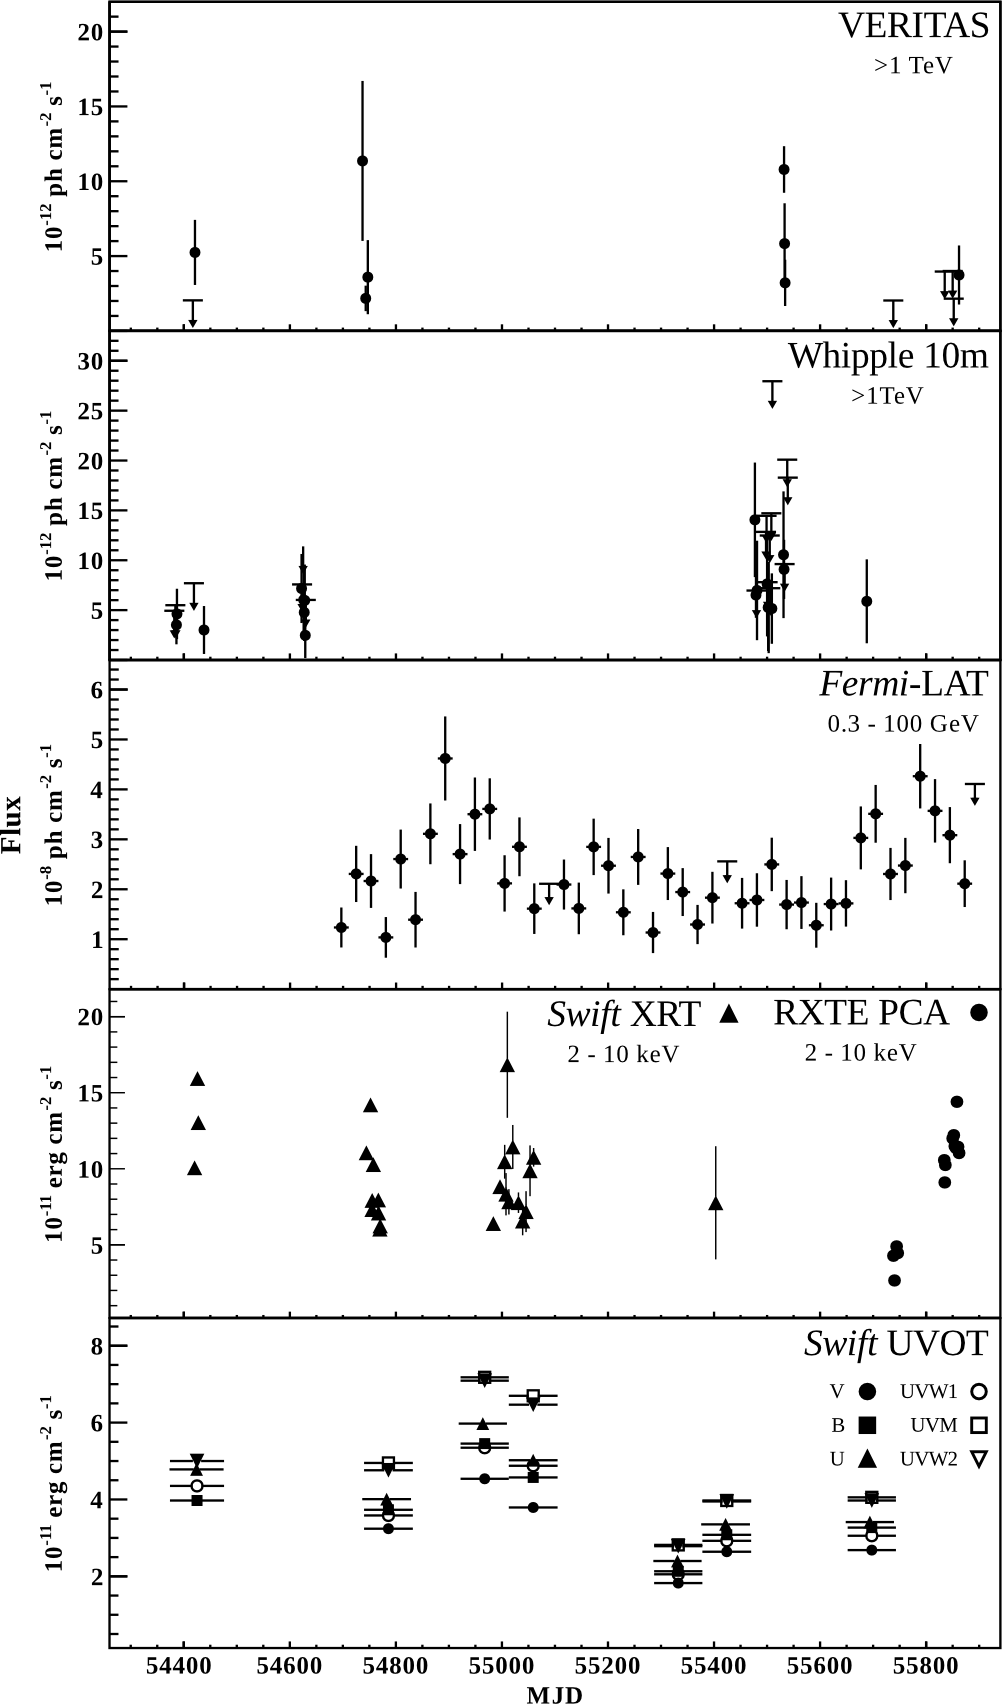
Figure 1: Light curves of 1ES 1959+650 in all energy bands analyzed for this paper. VERITAS and Whipple light curves are displayed in nightly bins; the Fermi-LAT light curve is shown in 4-week bins; RXTE PCA and Swift-XRT are binned by observation, the duration of which can vary; the Swift UVOT light curve is in 90-day bins. Strong variability is seen in the X-ray regime on the order of 48 hours from the RXTE observations (panel 4), however, this timescale is dominated by the time between observations. Other wavebands exhibit more stable emission, with gamma rays (panels 1 – 3) showing variability on the order of ∼ 2 days. For VERITAS and Whipple data sets, upper limits are calculated for points with a significance < 1 σ. For Fermi-LAT, upper limits are calculated for bins with TS < 3.
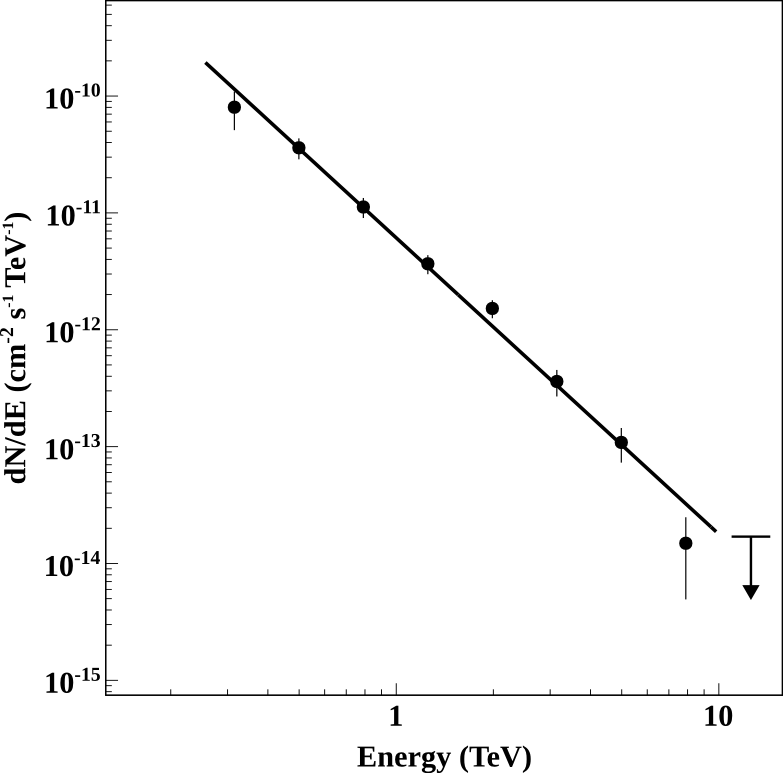
Figure 2: VERITAS time-averaged differential spectrum of 1ES 1959+650 fit with a power law of form dN/dE= N(E/E0)-Γ; N= 6.12 ± 0.53stat ± 2.45sys ×10-12 cm-2 s-1 TeV-1, Γ=2.54 ± 0.08stat±0.3sys, and
E0=1 TeV.
Figure 3: Flux-index correlation of Fermi-LAT data. The Pearson product-moment correlation coefficient is found to be 0.37 ± 0.15 implying a medium level of linear correlation.
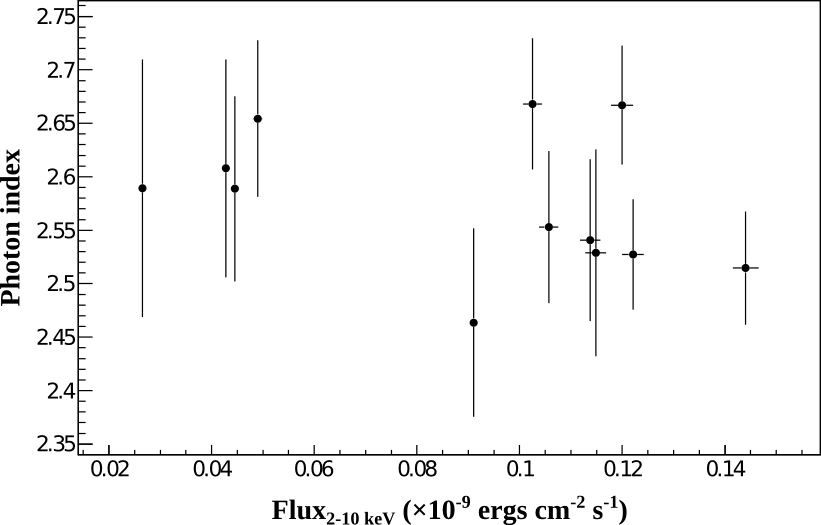
Figure 4: Flux-index plot of RXTE PCA data showing no significant variation of photon index with flux level.
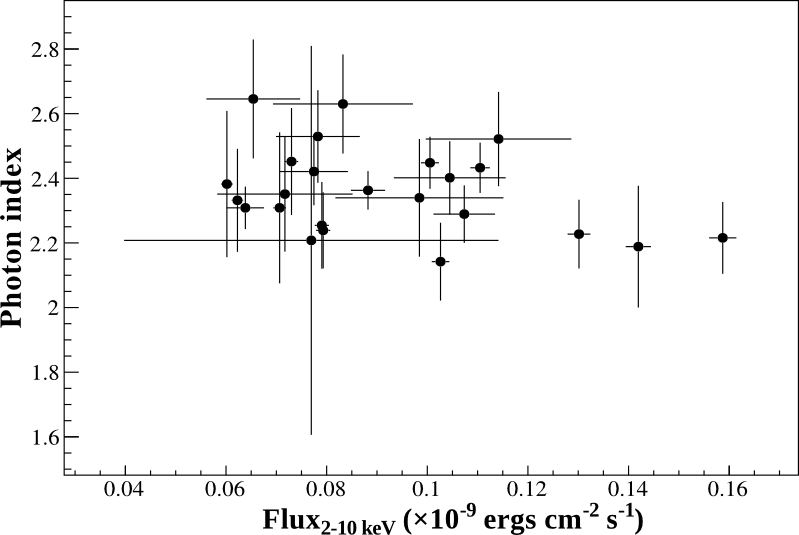
Figure 5: Flux-index plot of Swift XRT data showing no significant variation of photon index with flux levels.
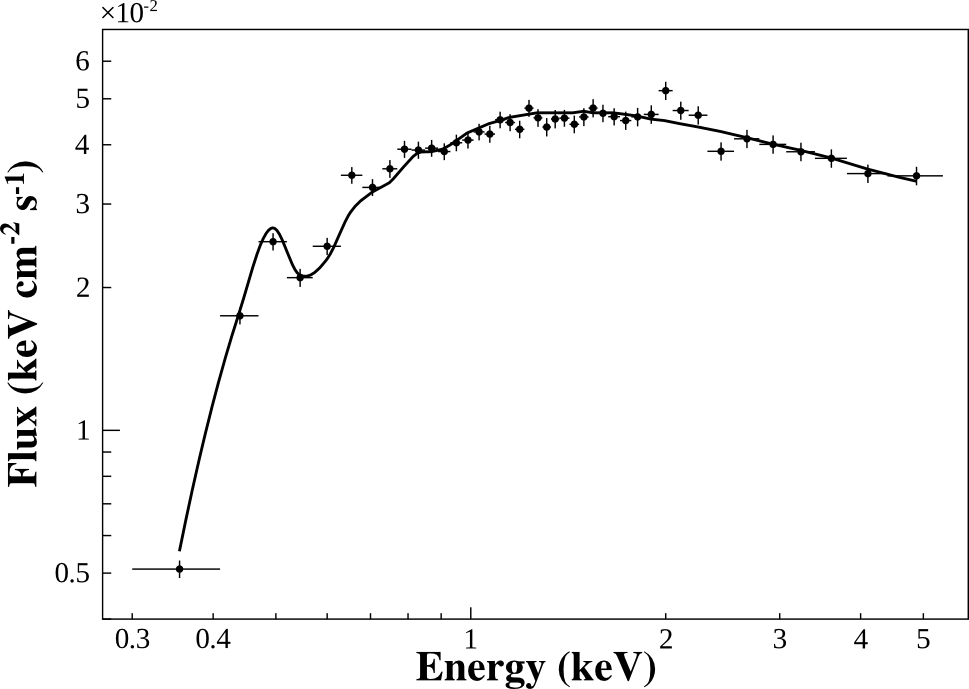
Figure 6: Time-average differential spectrum measured with Swift XRT in the range 0.3 - 10 keV, fit with a photo-absorbed power law of form dN/dE=exp[-nHσ(E)] N(E/E0)-Γ; nH=1.57 ± 0.05 ×10²¹, N=6.36 ± 0.12 ×10⁻² cm-2 s-1 keV-1, and Γ=2.4 ± 0.02.
Figure 7: Leptonic SSC+EC models for the three SEDs. The Fermi-LAT spectrum produced in this work is represented by butterfly plots (gray for the time-averaged spectrum, black for the contemporaneous spectrum), while data points are used for all other instruments. The solid (blue) line corresponds to the model for the highest X-ray normalization, the dotted (red) line shows the model for the lowest X-ray normalization, and the dashed (green) line represents the model for the time-averaged X-ray spectrum. Archival data are shown in gray for comparison. Please see full text for list of references for archival data.