Reference: E. Aliu et al. (The VERITAS Collaboration), Astrophysical Journal 770: 93, 2013
Full text version
ArXiv: ArXiV:1305.6508
Contacts: Amanda Weinstein
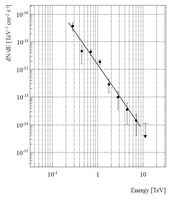
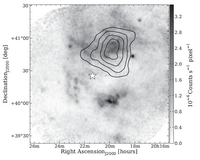
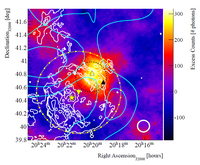
Motivated by preliminary indications of gamma-ray emission seen in its two-year (2007-2009) blind survey of the Cygnus region, VERITAS observed the radio and X-ray shell-like supernova remnant SNR~G78.2+2.1 for 21.4 hours in 2009. Extended gamma-ray emission above 320 GeV overlapping the northwest part of the radio shell was detected at a post-trials significance of 7.5 standard deviations. This gamma-ray source, named VER J2019+407, has an intrinsic extent of 0.23o ± 0.03ostat + 0.04osys - 0.02osys; the spectrum is well-described by a differential power law(dN/dE = No × (E/TeV)-Γ) with a photon index of Γ=2.37 ± 0.14stat ± 0.20sys and a flux normalization of No = 1.5 ± 0.02stat ± 0.4sys 10-12 photon TeV-1cm-2s-1. The integral flux corresponds to 3.7% of the Crab Nebula flux above 320 GeV.
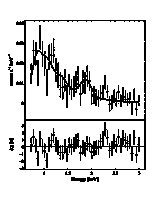
The nature of the emission from VER J2019+407 and its relationship to SNR G78.2+21 remains unclear. It is possible that VER J2019+407 is a pulsar wind nebula (PWN), associated either with the gamma-ray pulsar PSR J2021+4026 or another undetected pulsar in the line of the sight. However, the most plausible explanation at the present time ascribes VER J2019+407 to the acceleration of particles by shocks at the interaction of the supernova ejecta and the surrounding medium. TeV gamma-ray emission would be produced through inverse-Compton scattering of accelerated electrons or through hadronic interactions of accelerated nuclei with interstellar material, possibly in the form of a dense HI shell that surrounds the remnant. The lack of non-thermal X-ray emission near the source slightly favors the hadronic scenario, since electrons energetic enough to produce very high energy photons through inverse-Compton scattering would also be expected to produce X-ray synchrotron radiation. Moreover, estimates of the density of material required to produce the integral flux of VER J2019+407 above 320 GeV are consistent with estimates of the density in the vicinity of VER J2019+407 obtained from optical observations.
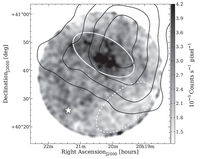
VER J2019+407 also poses an intriguing puzzle when placed in the context of the diffuse gamma-ray emission seen by Fermi below 100 GeV. First, given that the Fermi gamma-ray satellite sees emission between 10 and 100 GeV from the entire remnant (Lande et al. 2012), it is not yet clear why the gamma-ray emission above 320 GeV from SNR G78.2+2.1 would be localized to the remnant's northwestern rim. Assuming that the GeV and TeV gamma-ray emission both originate from the remnant, there remains the question of whether or not cosmic rays accelerated by SNR G78.2+2.1 are being fed to a nearby cocoon of freshly-accelerated cosmic rays, visible to Fermi as a 4 square degree region of gamma-ray emission between 1-100 GeV. Further observations will be required to address these questions.
FITS files: Excess map (Figure 1); spectrum (Figure 2).
Figures from paper (click to get full size image):
of N0 = 1.5 ± 0.2stat ± 0.4sys × 10-12 ph TeV-1 cm-2 s-1.
using a 5 × 5 pixel boxcar filter. The lower energy bound was selected to reject the background flux from the Galactic Plane. The location of the gamma-ray pulsar PSR J2021+4026 is marked with a white star.

