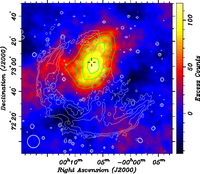
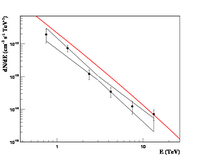
CTA 1 is a composite supernova remnant (SNR), with an outer shell visible at radio frequencies and an extended X-ray pulsar wind nebula (PWN) surrounding the gamma-ray pulsar PSR J0007+7303. Motivated by previous multiwavelength modeling of the system, VERITAS observed CTA 1 for approximately 41 hours between September 2010 and December 2011. Analysis revealed a significant excess of event with an extended morphology and a centroid offset by 5' from the the pulsar, resembling the PWN. The spectrum is well described by a power-law dN/dE = N0 (E/3 TeV)-Γ , with a differential spectral index of Γ = 2.2 ± 0.2 stat ± 0.3 sys, and normalization N0 = (9.1 ± 1.3 stat ± 1.7 sys ) 10^(-14) cm-2 s-1 TeV-1. The integral corresponds to 0.2% of the pulsar's spin-down power, assuming a distance to the system of 1.4 kpc.
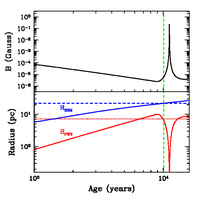
Measurements of the spectrum and extension match well with the population of known TeV pulsar wind nebulae, strengthening the association of the TeV source with the central X-ray PWN. These measurements, combined with the known properties of the central pulsar, thus allow for insight into the PWN environment. Estimates of the magnetic field based upon the size of the TeV emission region, along with more complete dynamic modeling, favor a low magnetic field strength of ~6 microGauss. These analyses also suggest that the PWN is currently interacting with the reverse shock of the surrounding SNR.
Figure 1: VERITAS excess map of the region around SNR CTA1 using a hard-spectrum analysis. The color scale indicates excess gamma-ray events within an integration radius of 0◦.23. The circle at the lower left corner shows the size of the point-spread function (68% containment). The radio contours at 1420 MHz (Pineault et al. 1997) are overlaid in white, showing the SNR shell. The VERITAS significance contours at 3, 4, 5, and 6 are shown in green. The cross marks the position of the pulsar (Abdo et al. 2008), located 5′ ± 2′ from the centroid of TeV emission. North is
up and east is to the left.
Figure 2: VERITAS differential gamma-ray spectrum of CTA 1. The black butterfly shows the uncertainties of the best-fit power-law model. The red line marks the flux predicted by Zhang, Jiang & Lin (2009, Figure 4). The errors are statistical only.
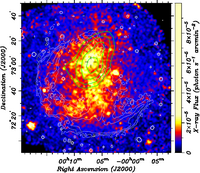
Figure 3: ROSAT X-ray image (0.5–2.0 keV) of the SNR CTA 1 shown in equatorial coordinates. The cross marks the location of the X-ray point source RX J0007.0+7303 and the Fermi PSR J0007+7303. The SNR shell is shown by the 1420 MHz radio contours (Pineault et al. 1997), overlaid in white. The VERITAS significance contours at 3, 4, 5, and 6 are shown in green.
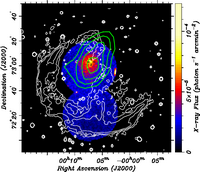
Figure 4: ASCA GIS image (4–10 keV) of the SNR CTA 1, using the same field of view as Figures 1 and 3. The position of PSR J0007+7303 is marked by the cross. The 1420 MHz radio contours are shown in white. The VERITAS significance contours at 3, 4, 5, and 6 are shown in green.
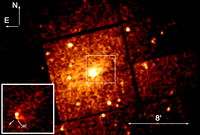
Figure 5: XMM-Newton 93 ks EPIC/MOS1+2 image (0.5–10 keV; pixel size 4′′; smoothed with the r = 12′′ Gaussian kernel) of PSR J0007+7303 and its vicinity showing the X-ray PWN. The inset is the higher resolution 50 ks Chandra ACIS image (0.5–8 keV; pixel size 2′′, smoothed with the r = 4′′ Gaussian kernel). The arrow in the inset image shows the likely direction of the pulsar proper motion (based on the shape of the compact PWN).
Figure 6: Upper: Time evolution of the PWN magnetic field, using the model of Gelfand, Slane & Zhang (2009), with parameters given in Table 2. Lower: Time evolution of the modeled SNR (blue) and PWN (red) radii. Horizontal dashed lines indicate the current values for CTA 1. The vertical green line indicates the age at which the measured SNR radius is reached. (See text for model description.)
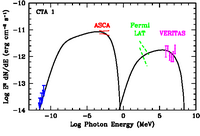
Figure 7: Broadband emission from CTA 1, along with the synchrotron and inverse Compton emission from the PWN predicted by the model of Gelfand, Slane & Zhang (2009) with parameters given in Table 2. See the text for the derivation of the 1.4 GHz radio upper limits shown in blue. The red lines mark the errors on the X-ray spectrum measured by ASCA (Slane et al. 2004). The green, dashed lines mark the errors on the unpulsed Fermi-LAT spectrum (Abdo et al. 2012).
Figure 8. Pulsar spin-down luminosity vs age, from Kargaltsev & Pavlov (2010), with CTA 1 point indicated. Filled circles: X-ray (red) and TeV (blue) luminosities of PWNe or PWN candidates. Larger circle sizes correspond to higher luminosities in the corresponding waveband. Small black dots denote ATNF catalog pulsars (Manchester et al. 2005).
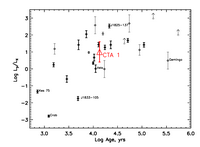
Figure 9: Figure 9. Plot of the ratio of TeV to X-ray luminosity vs pulsar spin-down age, from Kargaltsev & Pavlov (2010), with CTA 1 shown by the red triangle. Thick and thin error bars correspond to firm and tentative (or questionable) PWN associations, with selected objects labeled (see Kargaltsev & Pavlov for further details).
