Reference: E. Aliu et al. (The VERITAS Collaboration), Astrophysical Journal Letters 781: L11, 2014
Full text version
ArXiv: ArXiV:1309.5949
Contacts: Greg Richards, Anna O'Faolainn de Bhroithe
Despite being possibly the best-studied cosmic particle accelerator, the Crab Nebula continues to pose challenging questions for experimentalists and theorists alike. The electromagnetic radiation that has so far been observed from the Crab Nebula has been shown to be consistent with two well-known mechanisms in physics: synchrotron emission, in which corpuscles of light (photons) are radiated by charged particles that follow helical paths in a magnetic field; and inverse-Compton scattering, in which a photon is made much more energetic by interaction with an electron traveling close to the speed of light [1]. The energy source that powers the nebula is thought to be the Crab pulsar at its center, and long-standing models of the Crab have met with success in this framework [2,3]. However, the relatively recent reports by the AGILE and Fermi teams in 2011 of high-energy (HE; E > 100 million electron volts; eV) gamma-ray flaring activity in the Crab Nebula [4,5] came as a huge surprise to the astronomical community and highlighted the need for more accurate theoretical models. In this work, we present high- and very-high-energy (VHE; E > 100 billion eV) gamma-ray observations of the Crab Nebula during a flaring episode with the Fermi Large Area Telescope (Fermi-LAT) and VERITAS in an effort to help unravel the secrets of this cosmic puzzle.
Since the detection of the first Crab Nebula flare in 2007, these flares have been seen to occur with a frequency of roughly one to two times per year. The brightest flare that has so far been observed with the Fermi-LAT occurred in April 2011, in which the peak gamma-ray output reached a level of about 30 times the quiescent value [6]. The location of origin and size of the emitting region of the flares in the nebula remains unsolved, although theorists suggest that this region is relatively compact (~ 1/1000 of a light year) and located close to the pulsar. Multiwavelength campaigns employing a number of astronomical teams have been undertaken after each public notification of a new flare, though correlated flaring activity outside of the HE gamma-ray band has never been detected [7,8]. However, coverage in VHE gamma rays that allow probing the inverse-Compton component has been rather sparse, emphasizing the need for VHE observations to obtain the most complete picture across the entire electromagnetic spectrum.
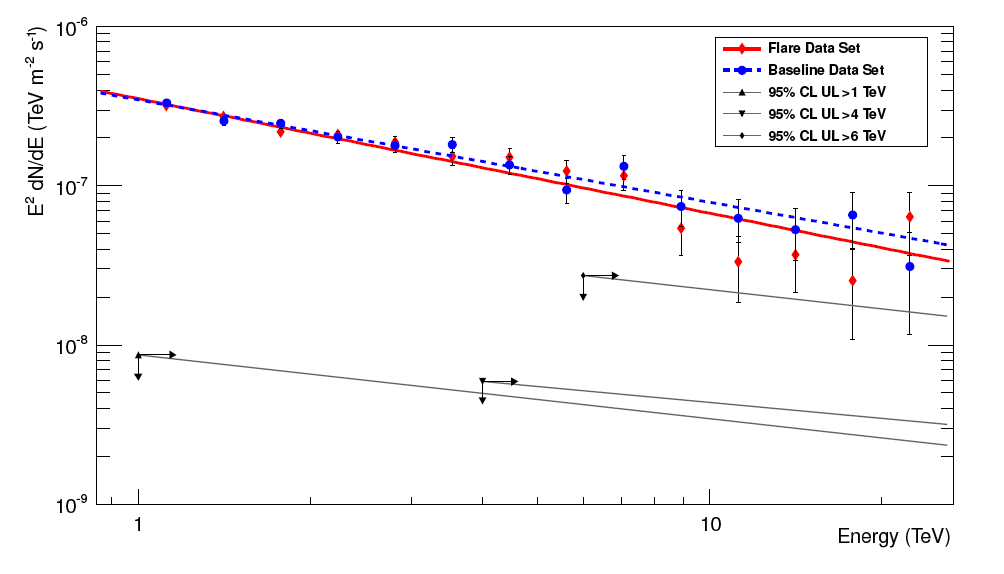
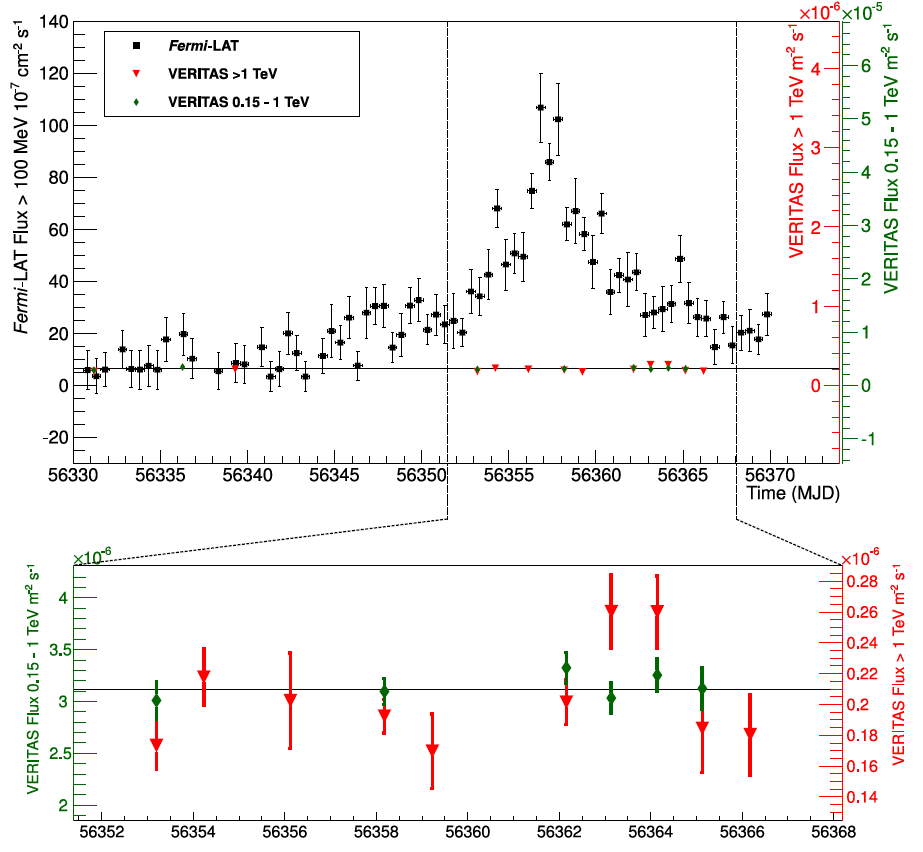
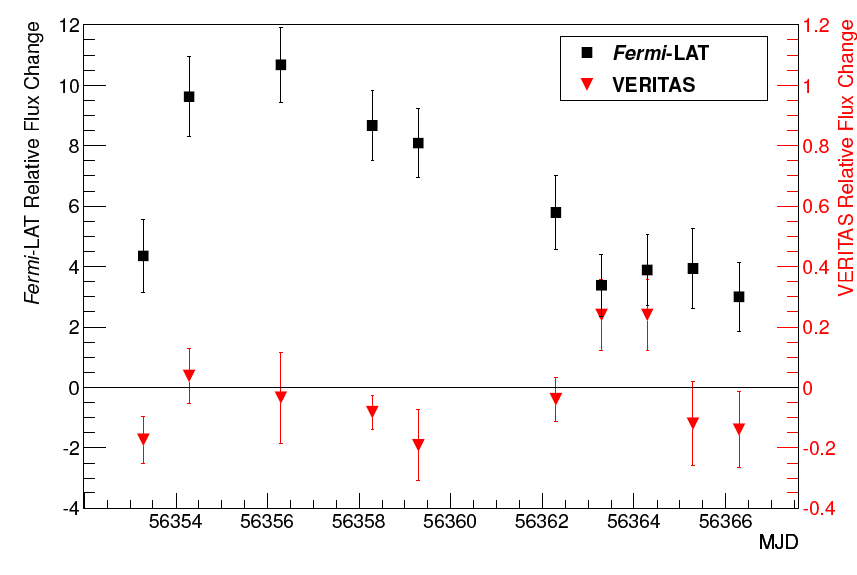
An automated Fermi-LAT analysis pipeline at Columbia University-Barnard College used by VERITAS collaborators for monitoring the Crab revealed an elevated HE flux from the Crab Nebula in early March 2013. VERITAS observations began March 2 and span ten days during the flare, which lasted approximately two weeks. During the ten days of VERITAS observations, the HE gamma-ray flux was on average elevated by a factor of about 6, though the VERITAS data > 1 TeV do not indicate any significant enhancement of the VHE flux during this same period (see the included figure). We thus place an upper limit on a relative elevated signal above 1 TeV from the Crab Nebula of 5.3% with 95% confidence by invoking the assumption that the average VHE flux was at least elevated by some nonzero factor. Further, adopting the assumption that the HE and VHE fluxes are linearly related, we constrain a linear correlation factor to be at most 8.6e-3 with 95% confidence [9].
[1] Hester, J. J. 2008, ARA&A, 46, 127
[2] Rees, M. J., & Gunn, J. E. 1974, MNRAS, 167, 1
[3] Kennel, C. F., & Coroniti, F. V. 1984, ApJ, 283, 710
[4] Tavani, M., Bulgarelli, A., Vittorini, V., et al. 2011, Science, 331, 736
[5] Abdo, A. A., Ackermann, M., Ajello, M., et al. 2011, Science, 331, 739
[6] Buehler, R., Scargle, J. D., Blandford, R. D., et al. 2012, ApJ, 749, 26
[7] Horns, D., Tennant, A., Ferrigno, C., et al. 2010, The Astronomer's Telegram, 3058, 1
[8] Weisskopf, M. C. 2012, arXiv:1211.7109
[9] Aliu, E. et al. 2013, arXiv:1309.5949
FITS files:
Figures from paper (click to get full size image):