SETI, the search for extraterrestrial intelligence, can be defined as the "theory and practice of searching for extraterrestrial technology or technosignatures". Technosignatures are extraterrestrial signals whose only explanation is that they were produced artificially. In this paper we discuss the partnership between Breakthrough Listen and VERITAS to develop methods which utilized the VERITAS telescopes to search for one such technosignature, pulsed optical laser-based communications, as well as discuss the results of using those developed techniques on both archival data and on data taken as part of a dedicated observational campaign during the 2019-2020 observation season. We also discuss utilizing the techniques developed to identify and study pulses coming from the atmospheric science satellite CALIPSO as a test of the ability of VERITAS to detect this technosignature. Finally, we discuss the sensitivity of VERITAS to this technosignature and the potential of searching the entire VERITAS archive.
Figure 1: An elevated view of the VERITAS array located at the base of Mount Hopkins near Tuscon, AZ. Pictured are the four individual telescopes, which are roughly 100 m apart, the Fred Lawrence Whipple Observatory visitor center, and the VERITAS control building (with the white roof). Image from Abeysekara et al. (2016).
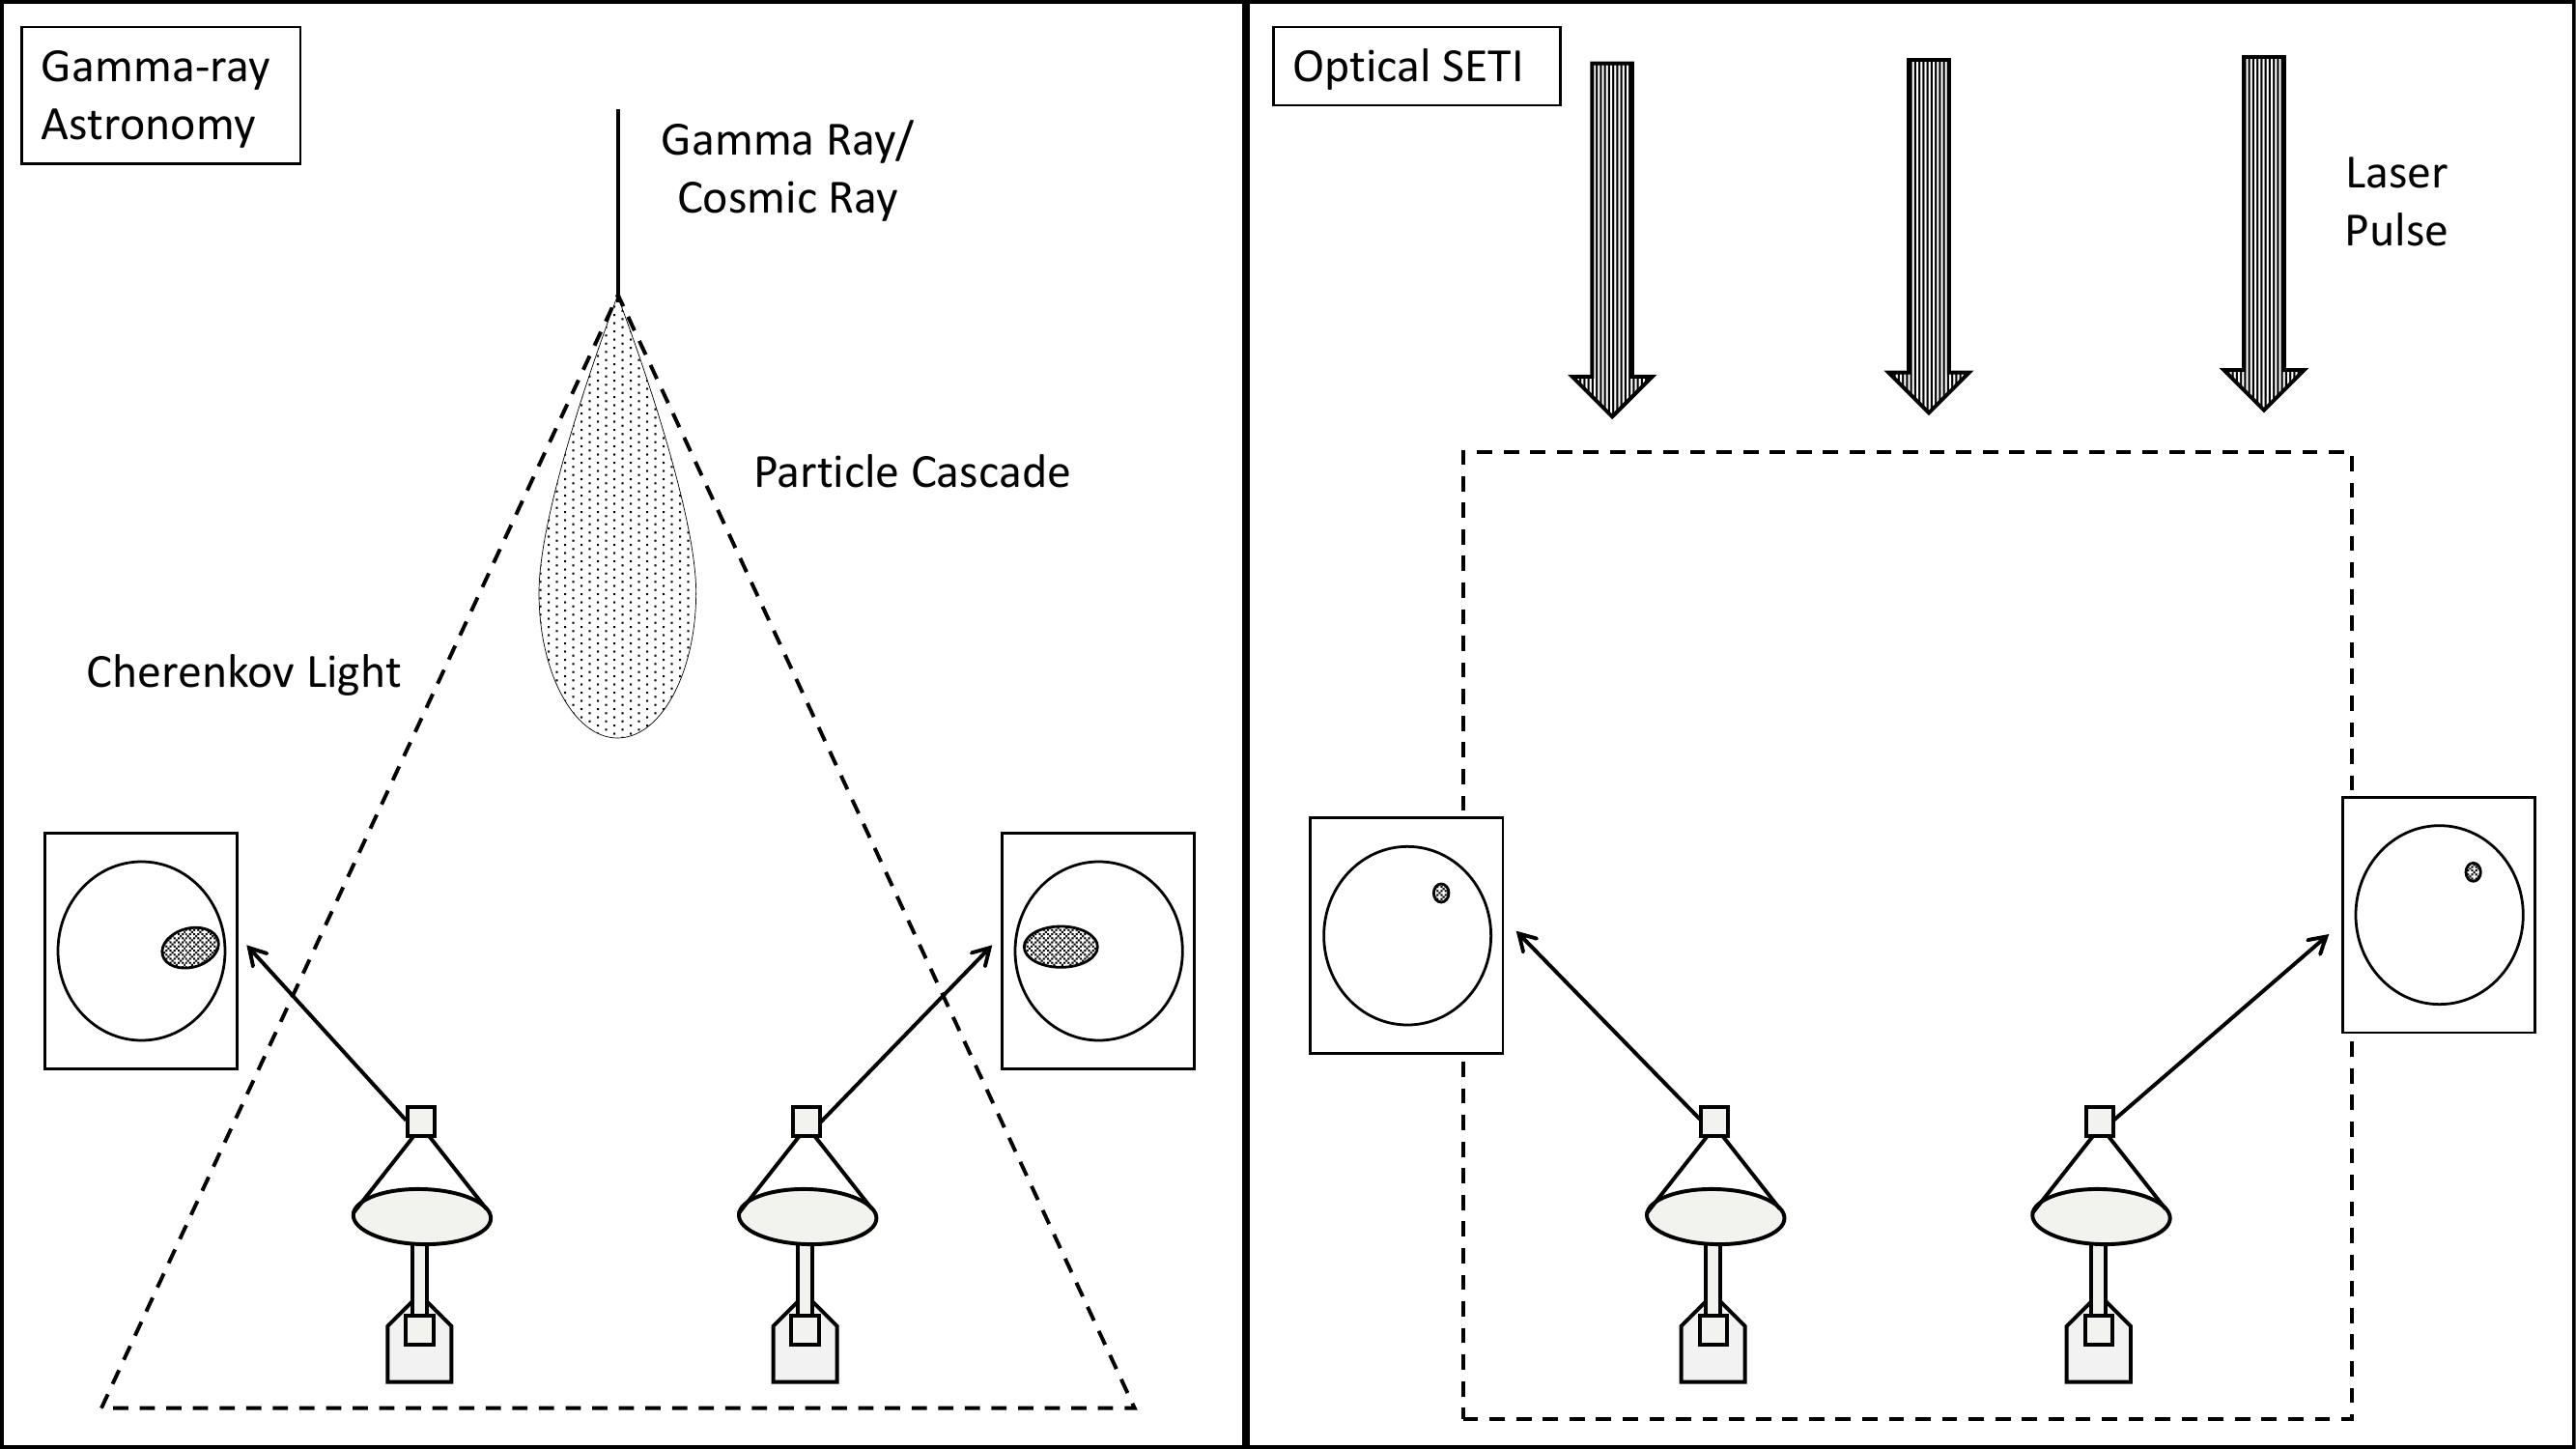
Figure 2: A schematic illustration of the optical SETI (OSETI) technique with IACT arrays such as VERITAS. Particle air showers, initiated by cosmic-ray particles or gamma-ray photons, produce extended images with parallax shifts when viewed from separated telescopes (left). A distant laser pulse produces identical point-like images, located at the same position in the field of view in each telescope (right).
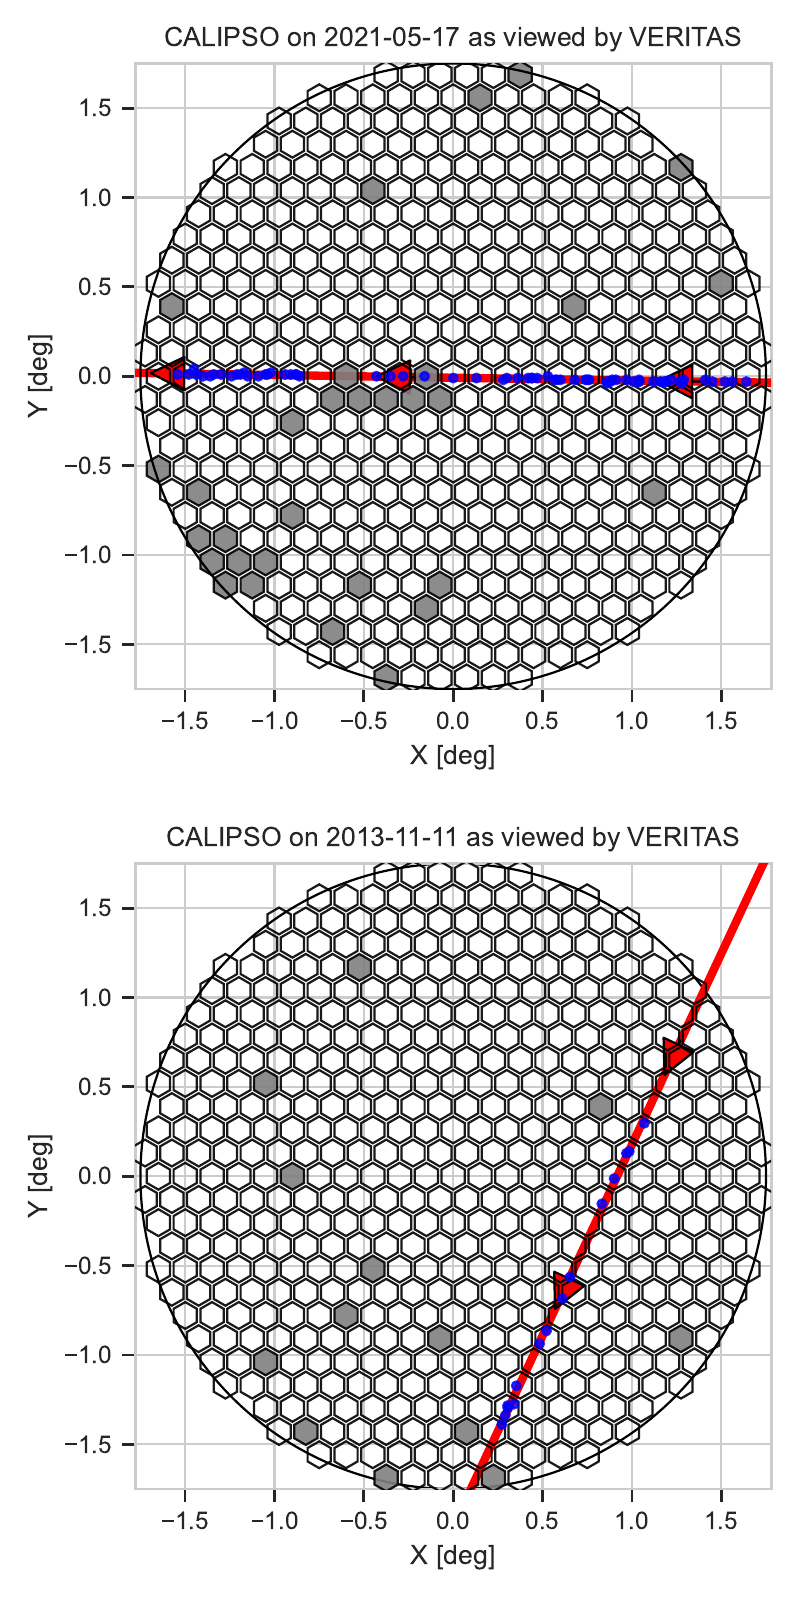
Figure 3: The tracks of the CALIPSO transits (in camera coordinates) on May 17, 2021 (top) and November 11, 2013 (bottom) with the location of the average of the image centers in an event shown as blue points. The hexagons correspond to VERITAS pixels. Grayed out pixels were non-functional during the transit for VERITAS telescope 1.
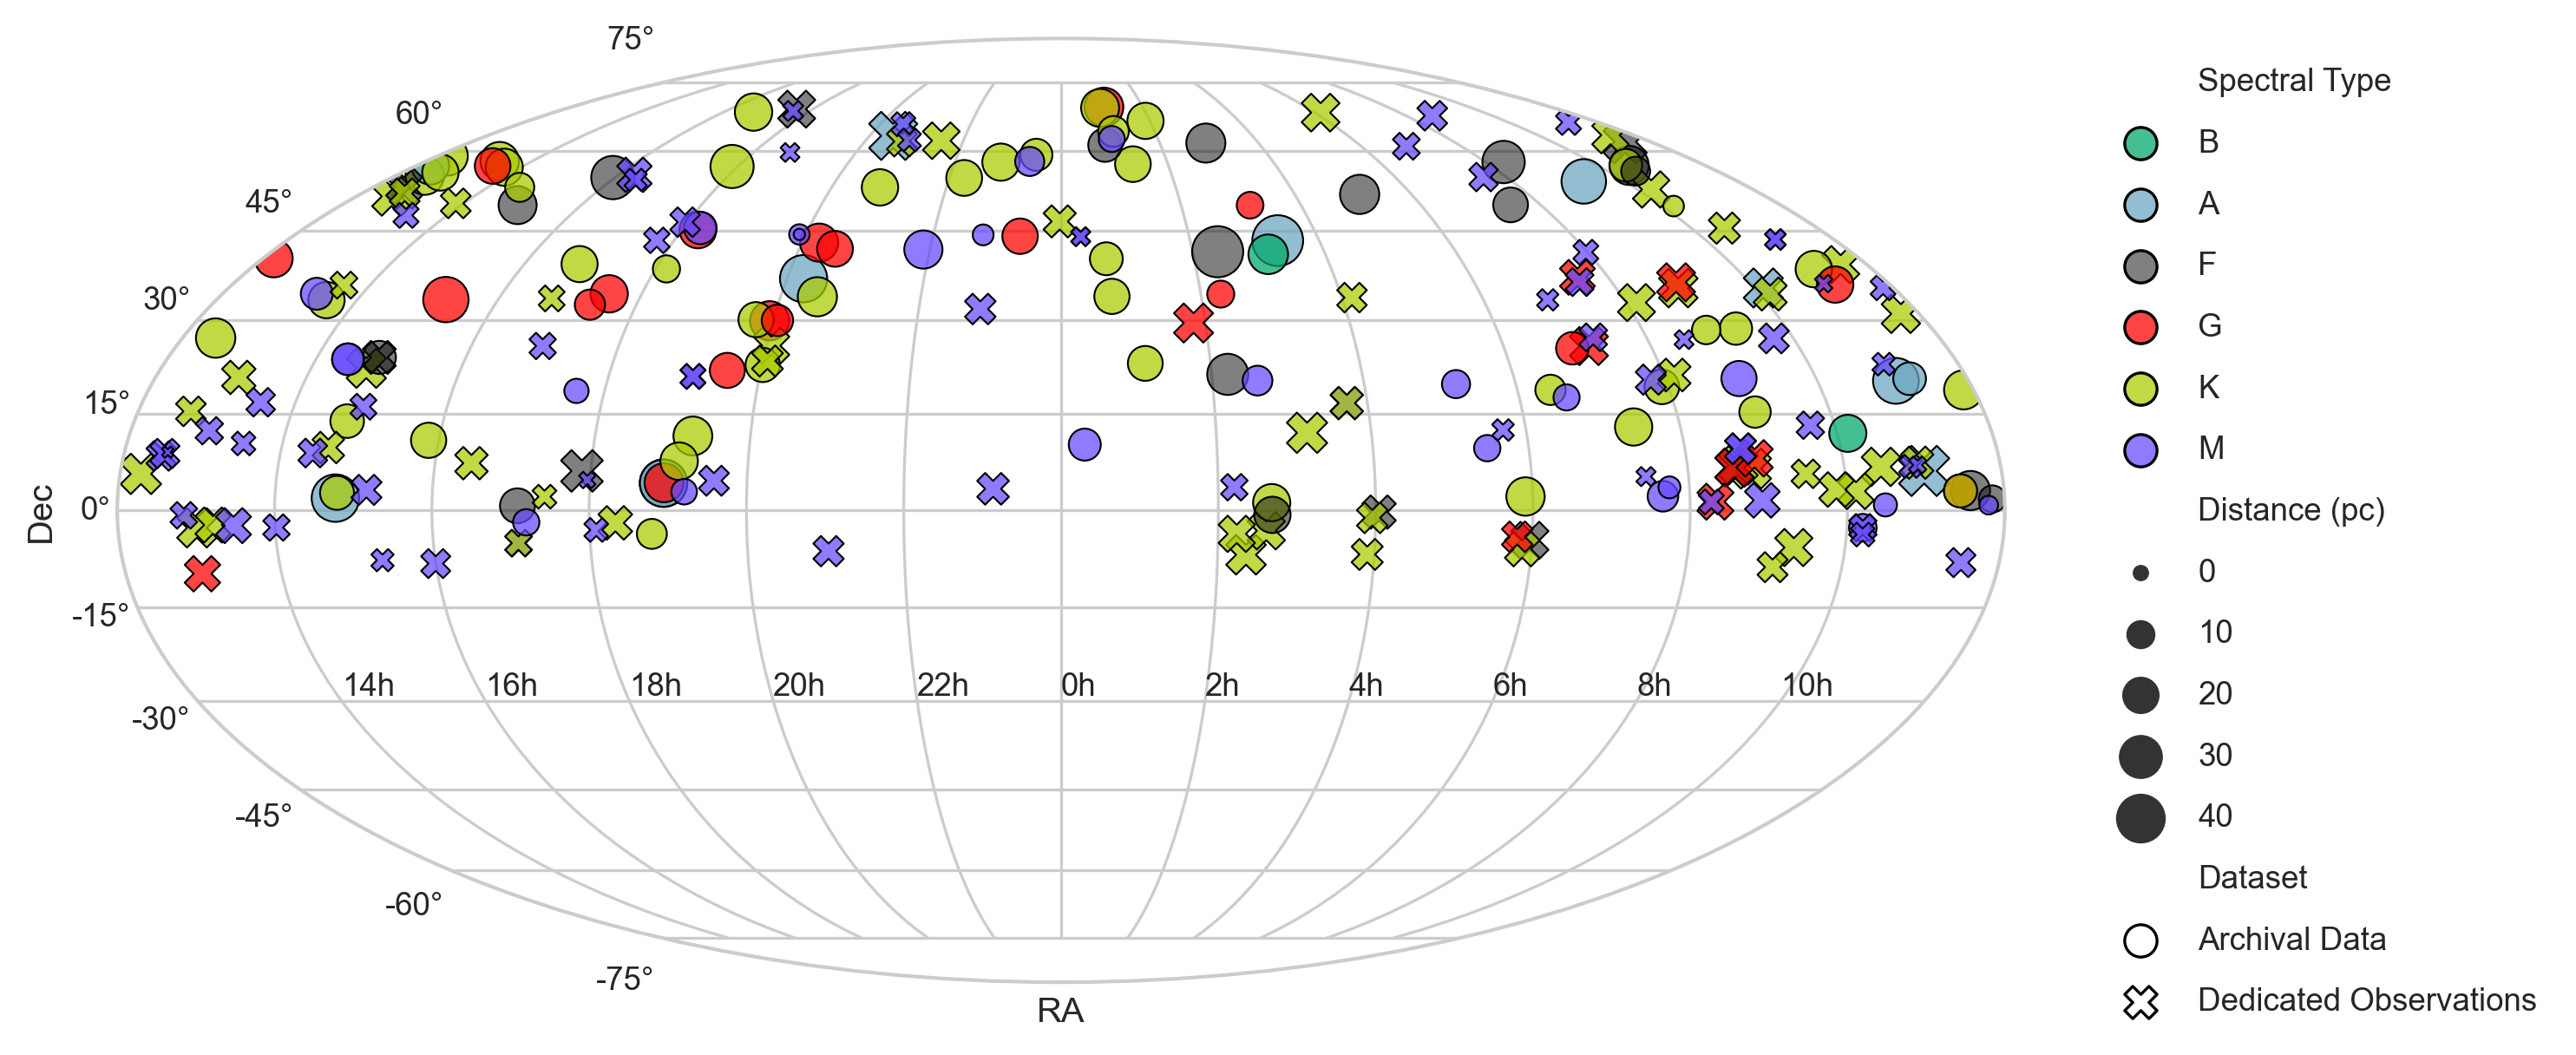
Figure 4: The stellar target locations, in equatorial coordinates, for both the dedicated and archival VERITAS observations. Distance and spectral type are also indicated, as described in the figure legend.
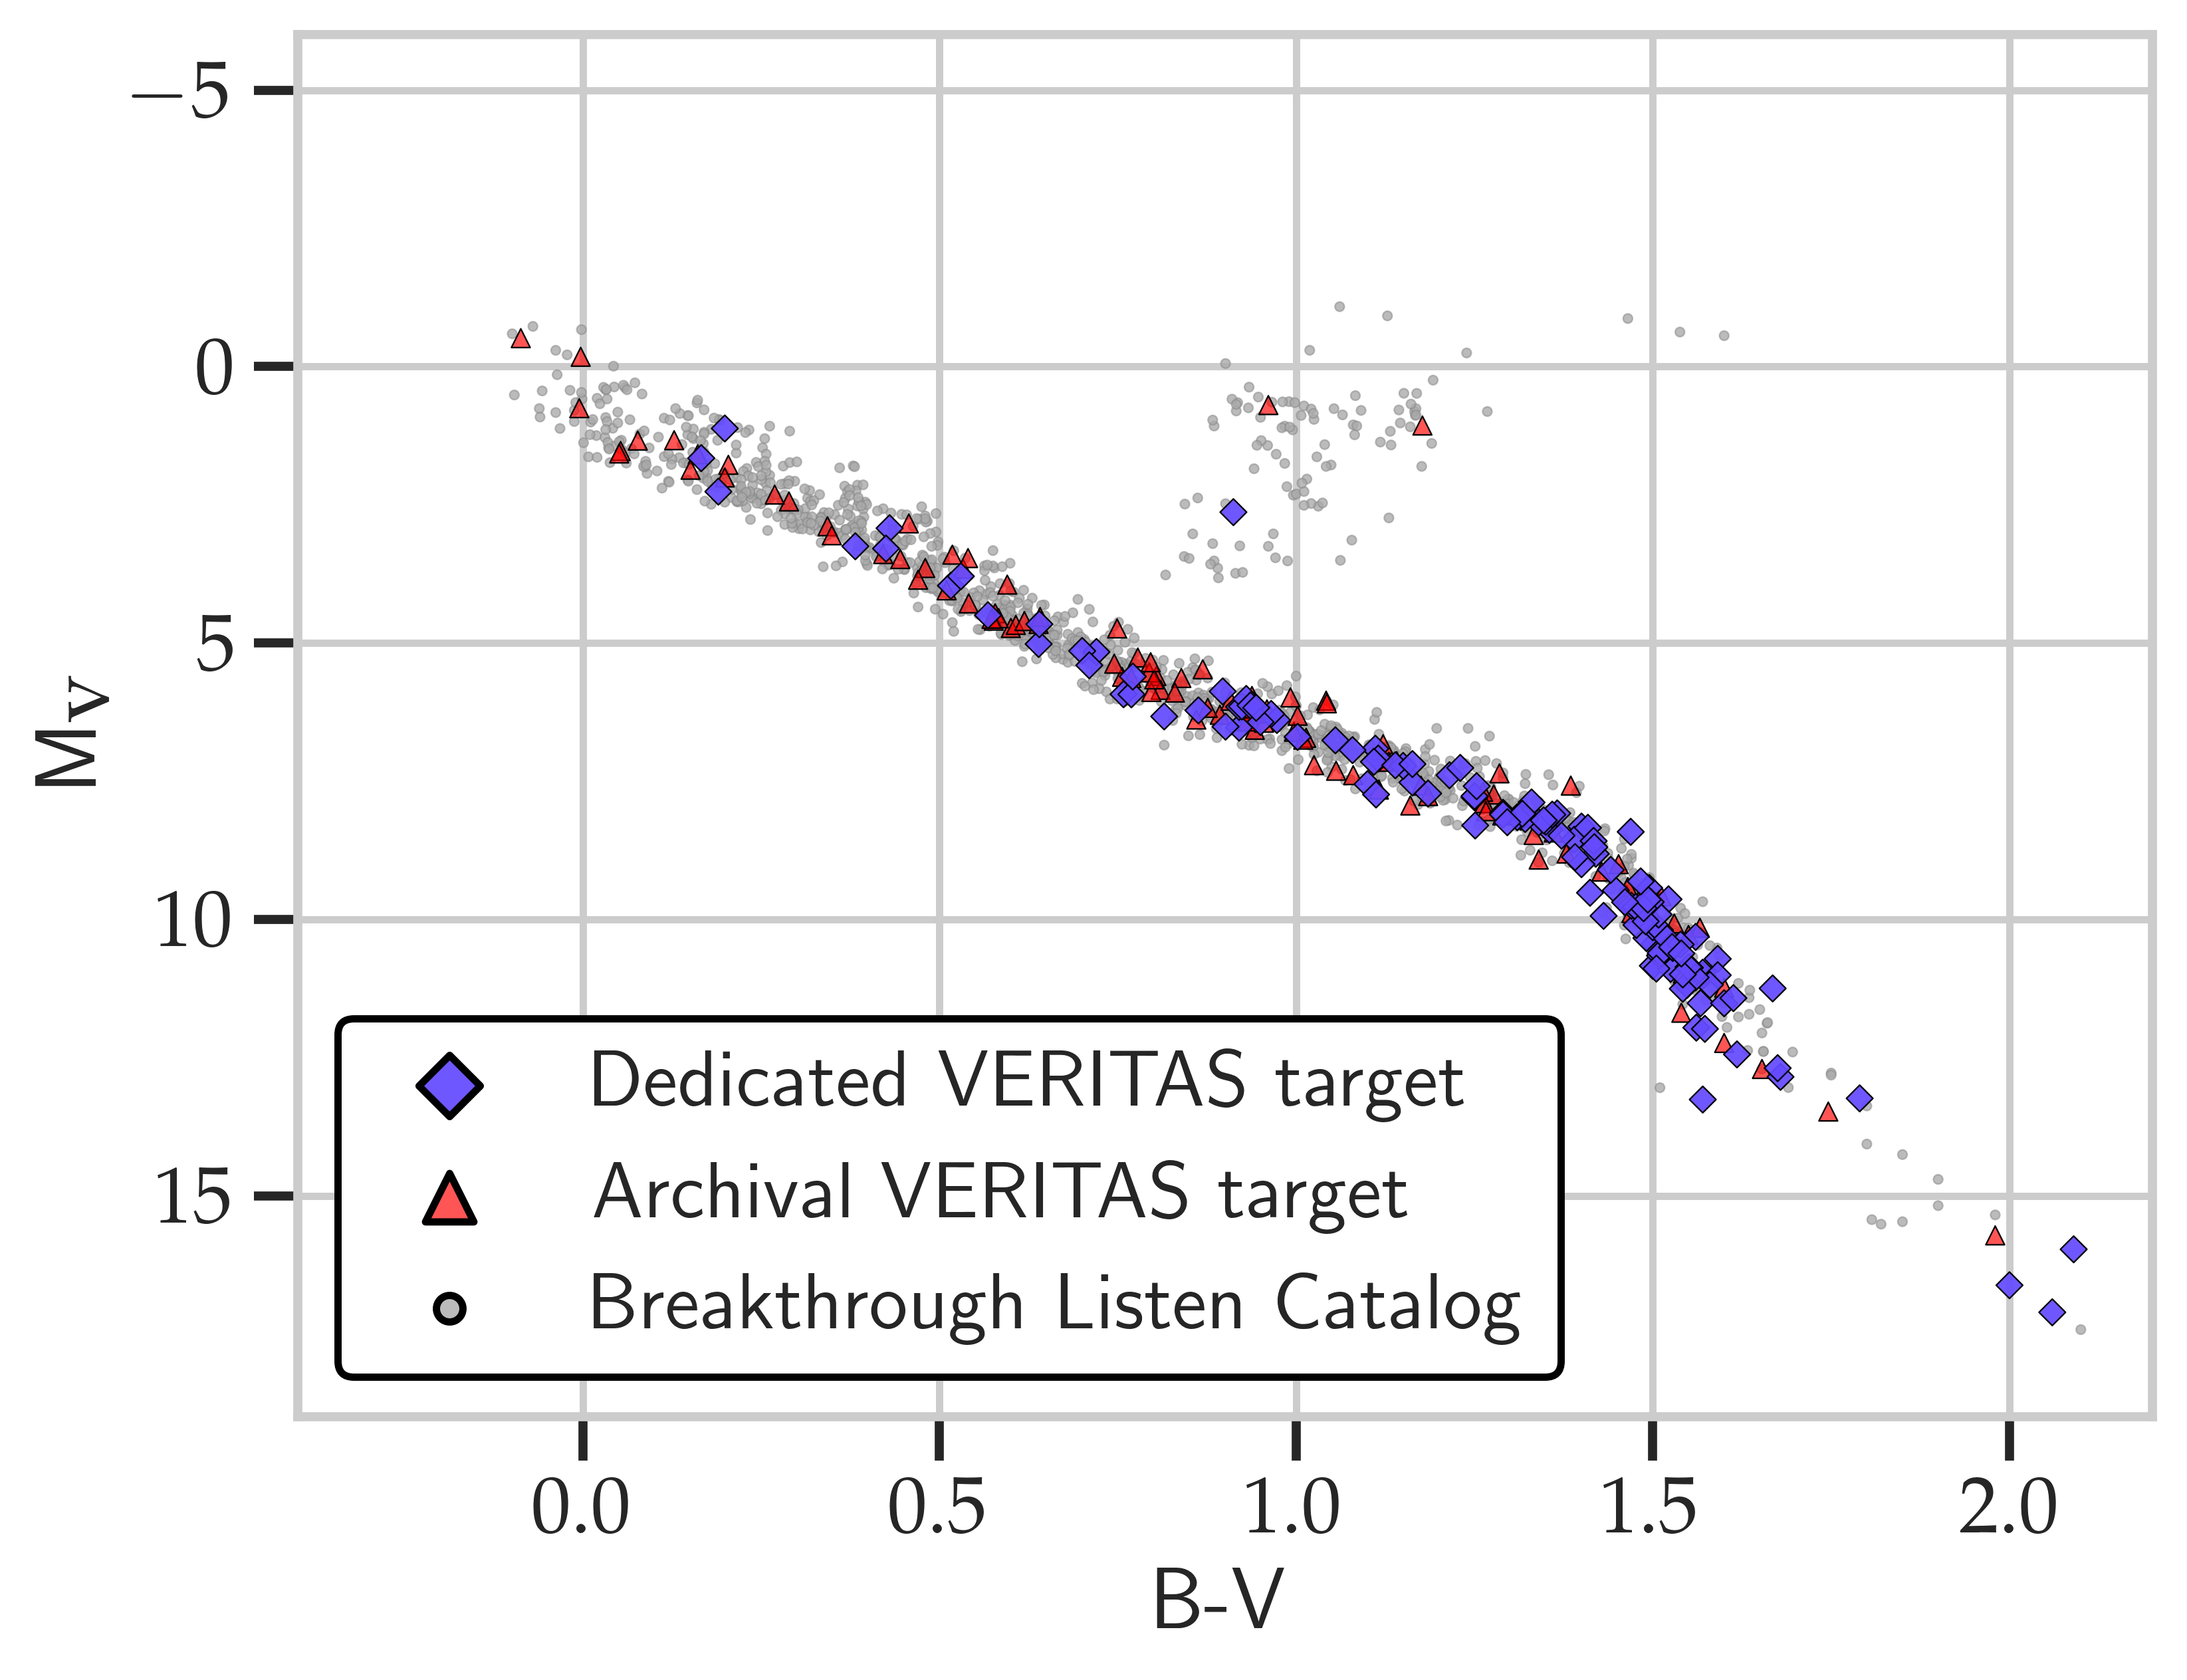
Figure 5: The coverage across an H-R Diagram for the stellar targets used in both dedicated observations and archival analysis. It is similar to the coverage found in the original Isaacson et al. (2017b) Catalog.
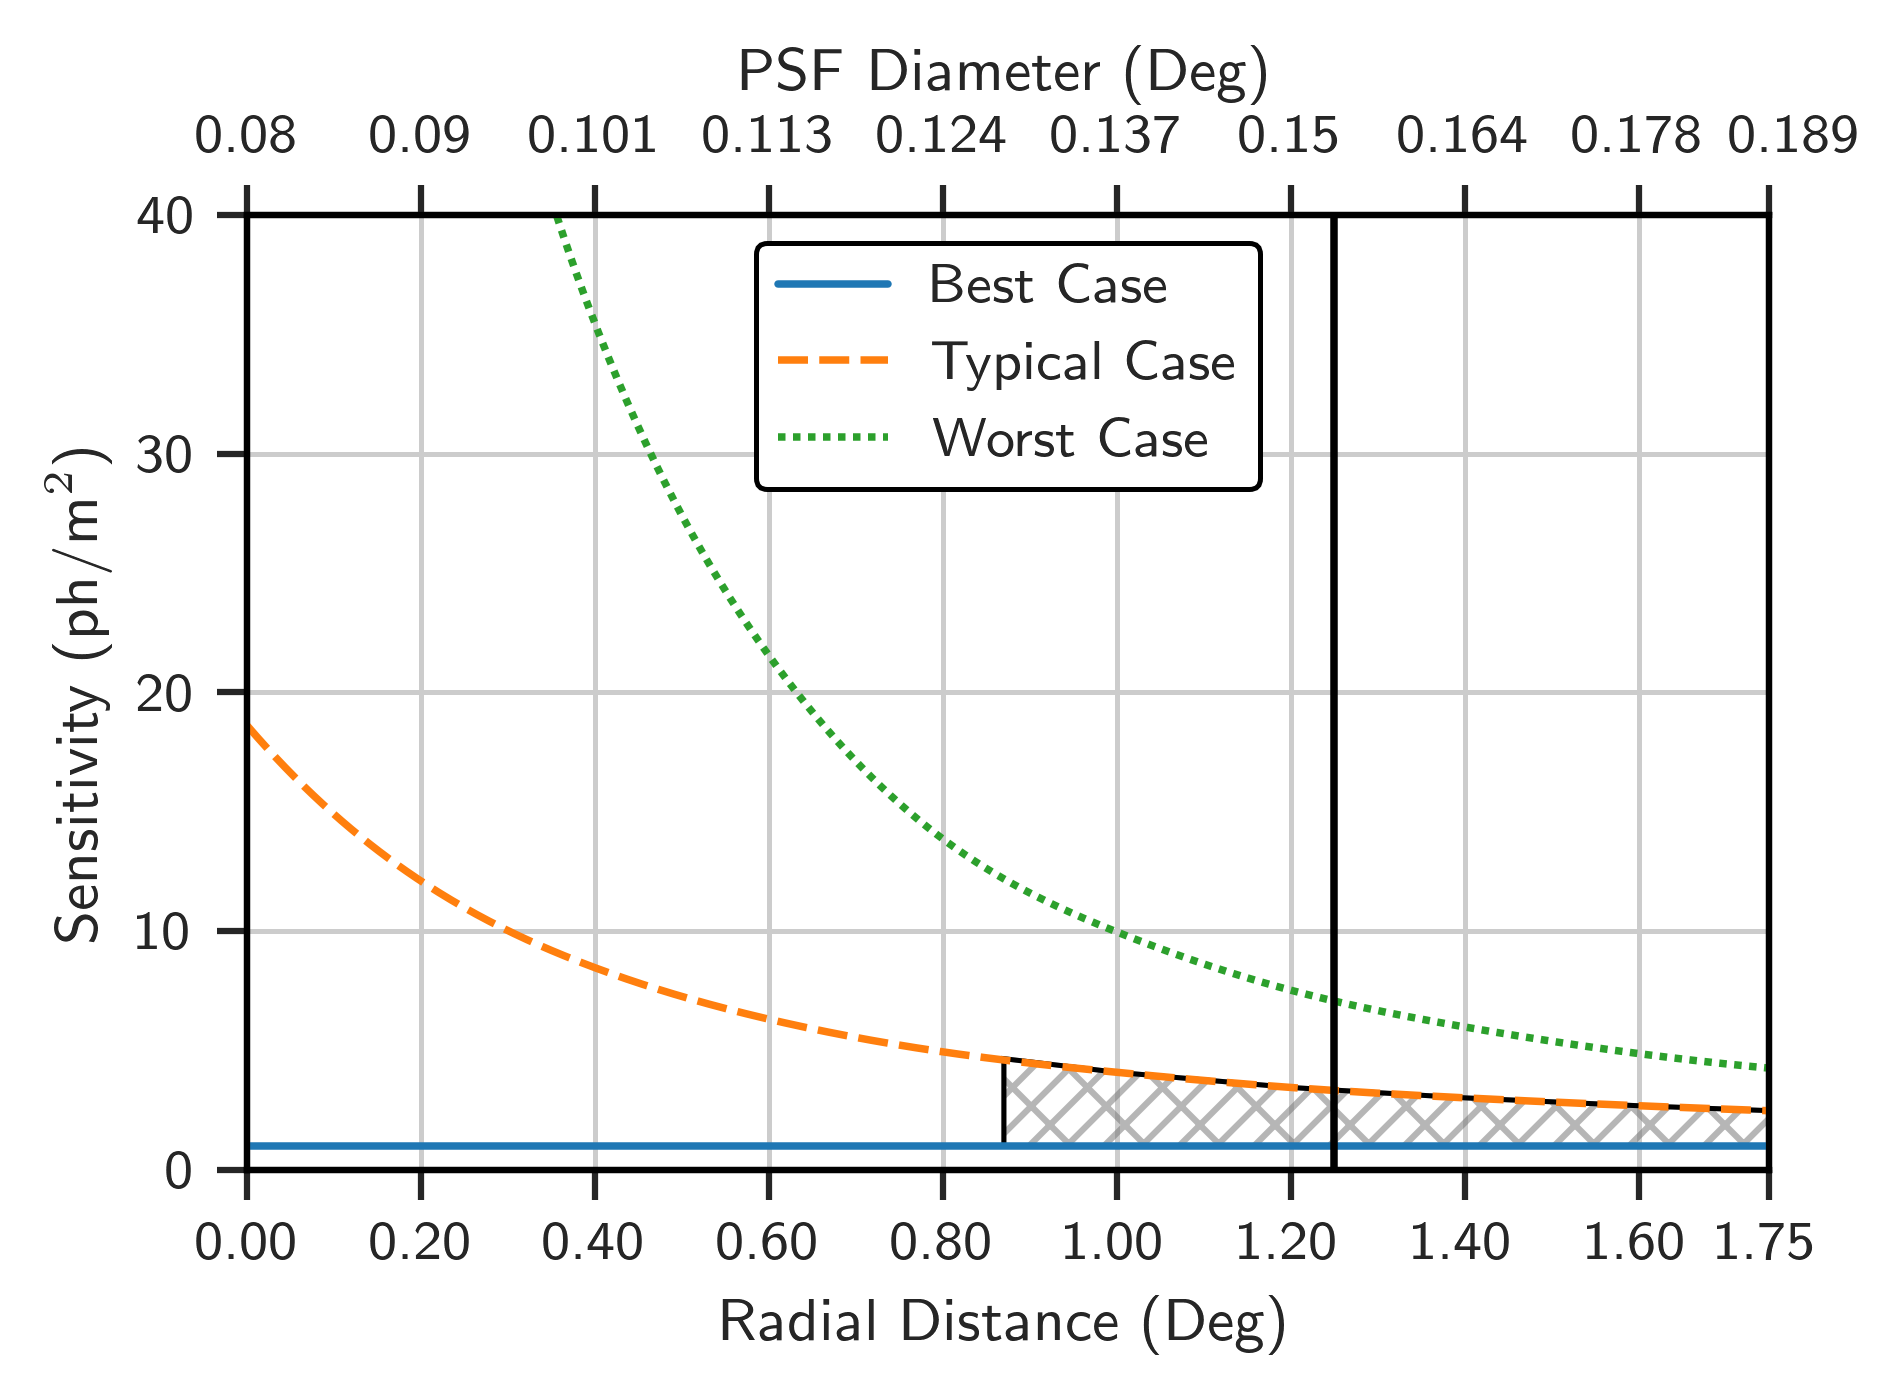
Figure 6: The sensitivity (minimum detectable pulse intensity) as a function of radial distance from the center of the VERITAS telescope field of view. The three curves correspond to a pulse located at the center of a PMT (worst case), equidistant between 3 PMTs (best case) and at the most common location (typical case). The cross-hatched region indicates the outer 75% of the camera area, and the sensitivity of 75% of the possible pulse locations within this area. See text for more details.
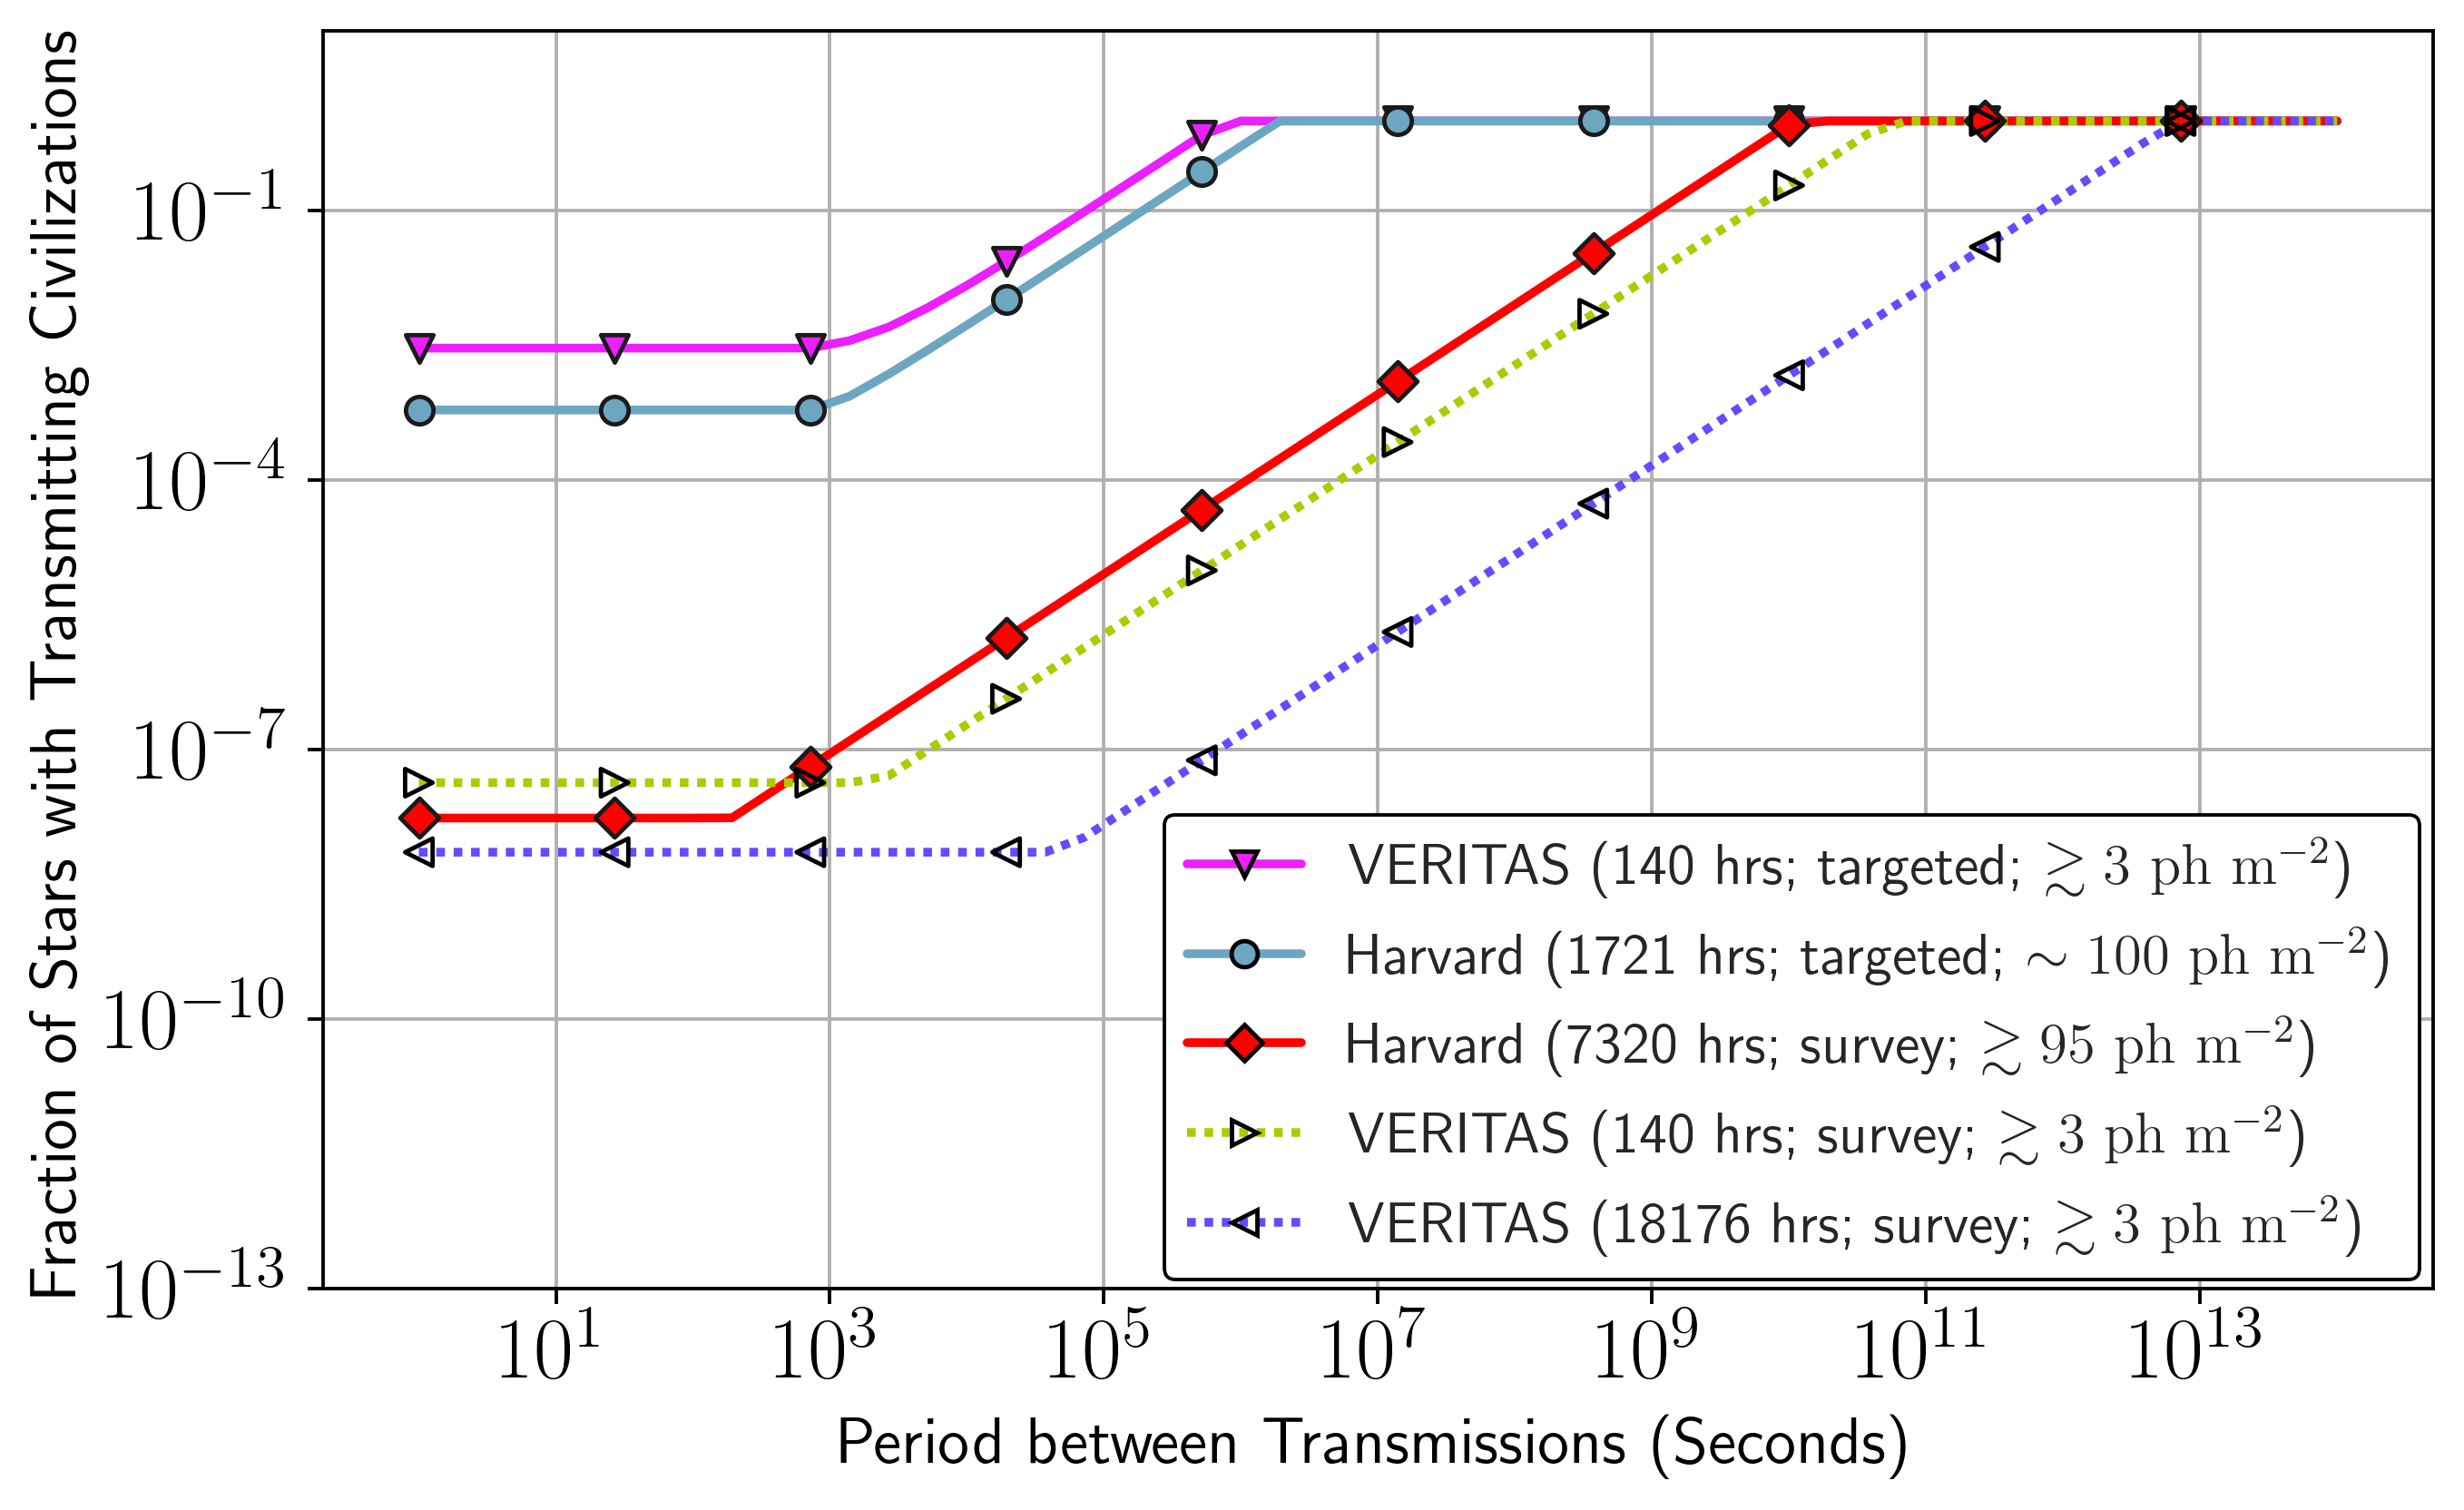
Figure 7: Upper limits on the fraction of stars with transmitting civilizations as a function of the average period between pulses, using the model from Howard et al. (2007) (building on Howard et al. (2004)) which assumes no candidate pulses are found. From top to bottom the five lines correspond to: all data from this paper (247 targets; upside-down triangles), the Harvard targeted search (Howard et al. 2004)(4730 targets; circles), the Harvard All-Sky untargeted survey (Howard 2006; Mead 2013) (7320 hours; diamonds), a hypothetical non-targeted VERITAS survey using all of the data from this paper (140 hours; right-pointing triangles), and a hypothetical non-targeted survey using all data from the entire VERITAS archive (18,176 hours; left-pointing triangles). The minimum detectable pulse is ∼ 30 times larger for Harvard than for VERITAS.
