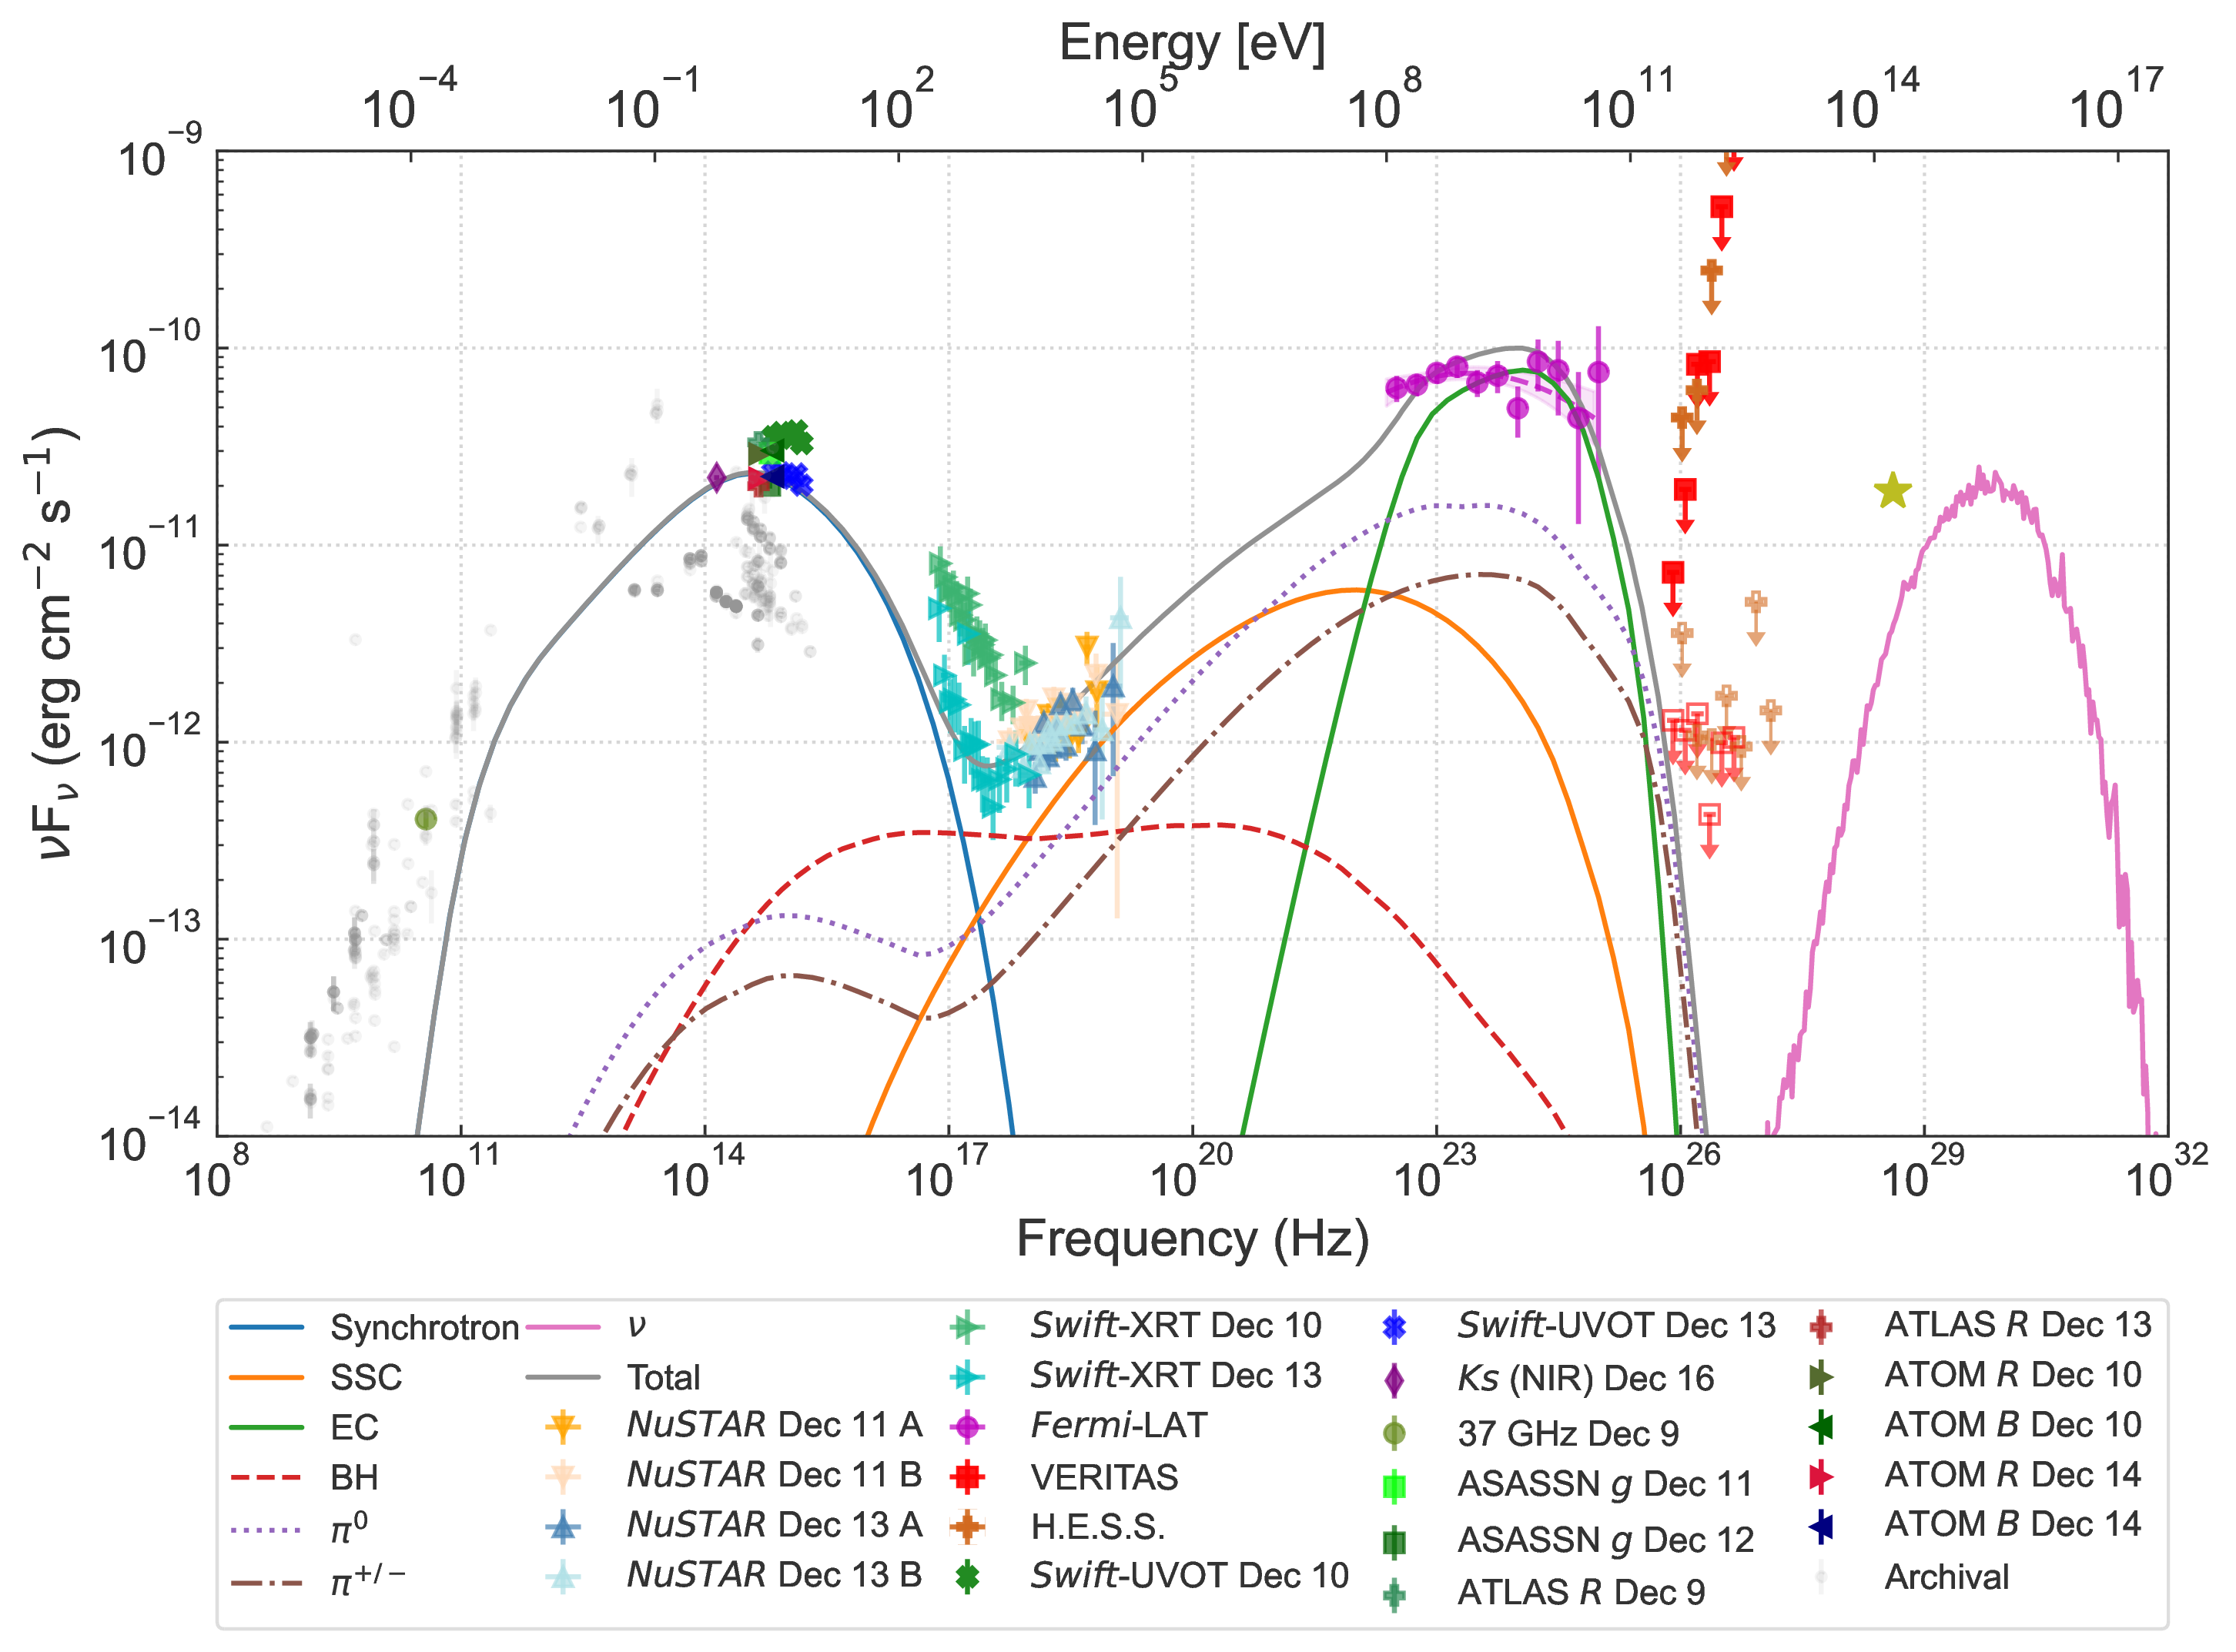
Broadband SED with the lepto-hadronic model with an external photon field, as described in the text. See Figure 3 below for more details.
Reference: a. Acharyya et al. (The VERITAS Collaboration), ApJ 954, 70 (2023)
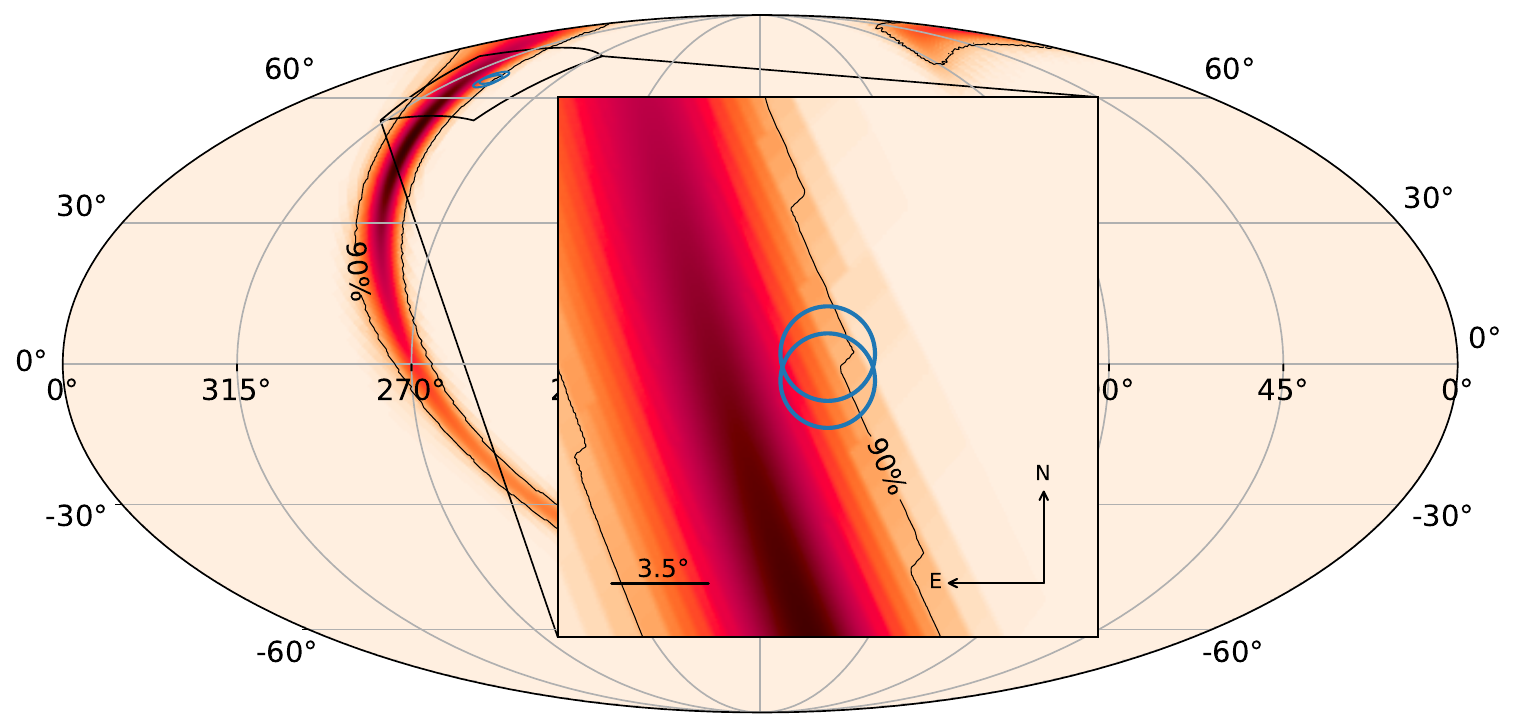
We report on multiwavelength target-of-opportunity observations of the blazar PKS 0735+178, located 2.2∘ away from the best-fit position of the IceCube neutrino event IceCube-211208A detected on December 8, 2021. The source was in a high-flux state in the optical, ultraviolet, X-ray, and GeV gamma-ray bands around the time of the neutrino event, exhibiting daily variability in the soft X-ray flux. Both X-ray and gamma-ray measurements provide strong constraints on the leptonic and hadronic models. The X-ray data from Swift-XRT and NuSTAR capture the transition between the low-energy and high-energy components of the broadband spectral energy distribution (SED), setting limits on potential hadronic emission components. The gamma-ray data from Fermi-LAT, VERITAS, and H.E.S.S. require a spectral cut-off near 100 GeV, posing challenges to single-zone synchrotron self-Compton models. We analytically explore a synchrotron self-Compton model, an external Compton model, and a lepto-hadronic model. Models that are entirely based on internal photon fields face serious difficulties in matching the observed SED. The existence of an external photon field in the source would instead explain the observed gamma-ray spectral cut-off in both leptonic and lepto-hadronic models and allow a proton jet power that marginally agrees with the Eddington limit in the lepto-hadronic model. We show a numerical lepto-hadronic model with external target photons that reproduces the observed SED and is reasonably consistent with the neutrino event despite requiring a high jet power.
FITS files: N/A
Figures from paper (click to get full size image):
Figure 1a: The long-term variability of PKS 0735+178. The flux above 100 MeV measured by Fermi-LAT starting in 2008 (top) is binned by month, the count rate between 0.3 and 10 keV measured by SwiftXRT (middle) and the optical B, g, V , and R band magnitudes from ASAS-SN, ATLAS, and ATOM (bottom) are binned by observations. The dashed lines show the time of the neutrino event IceCube-211208A.
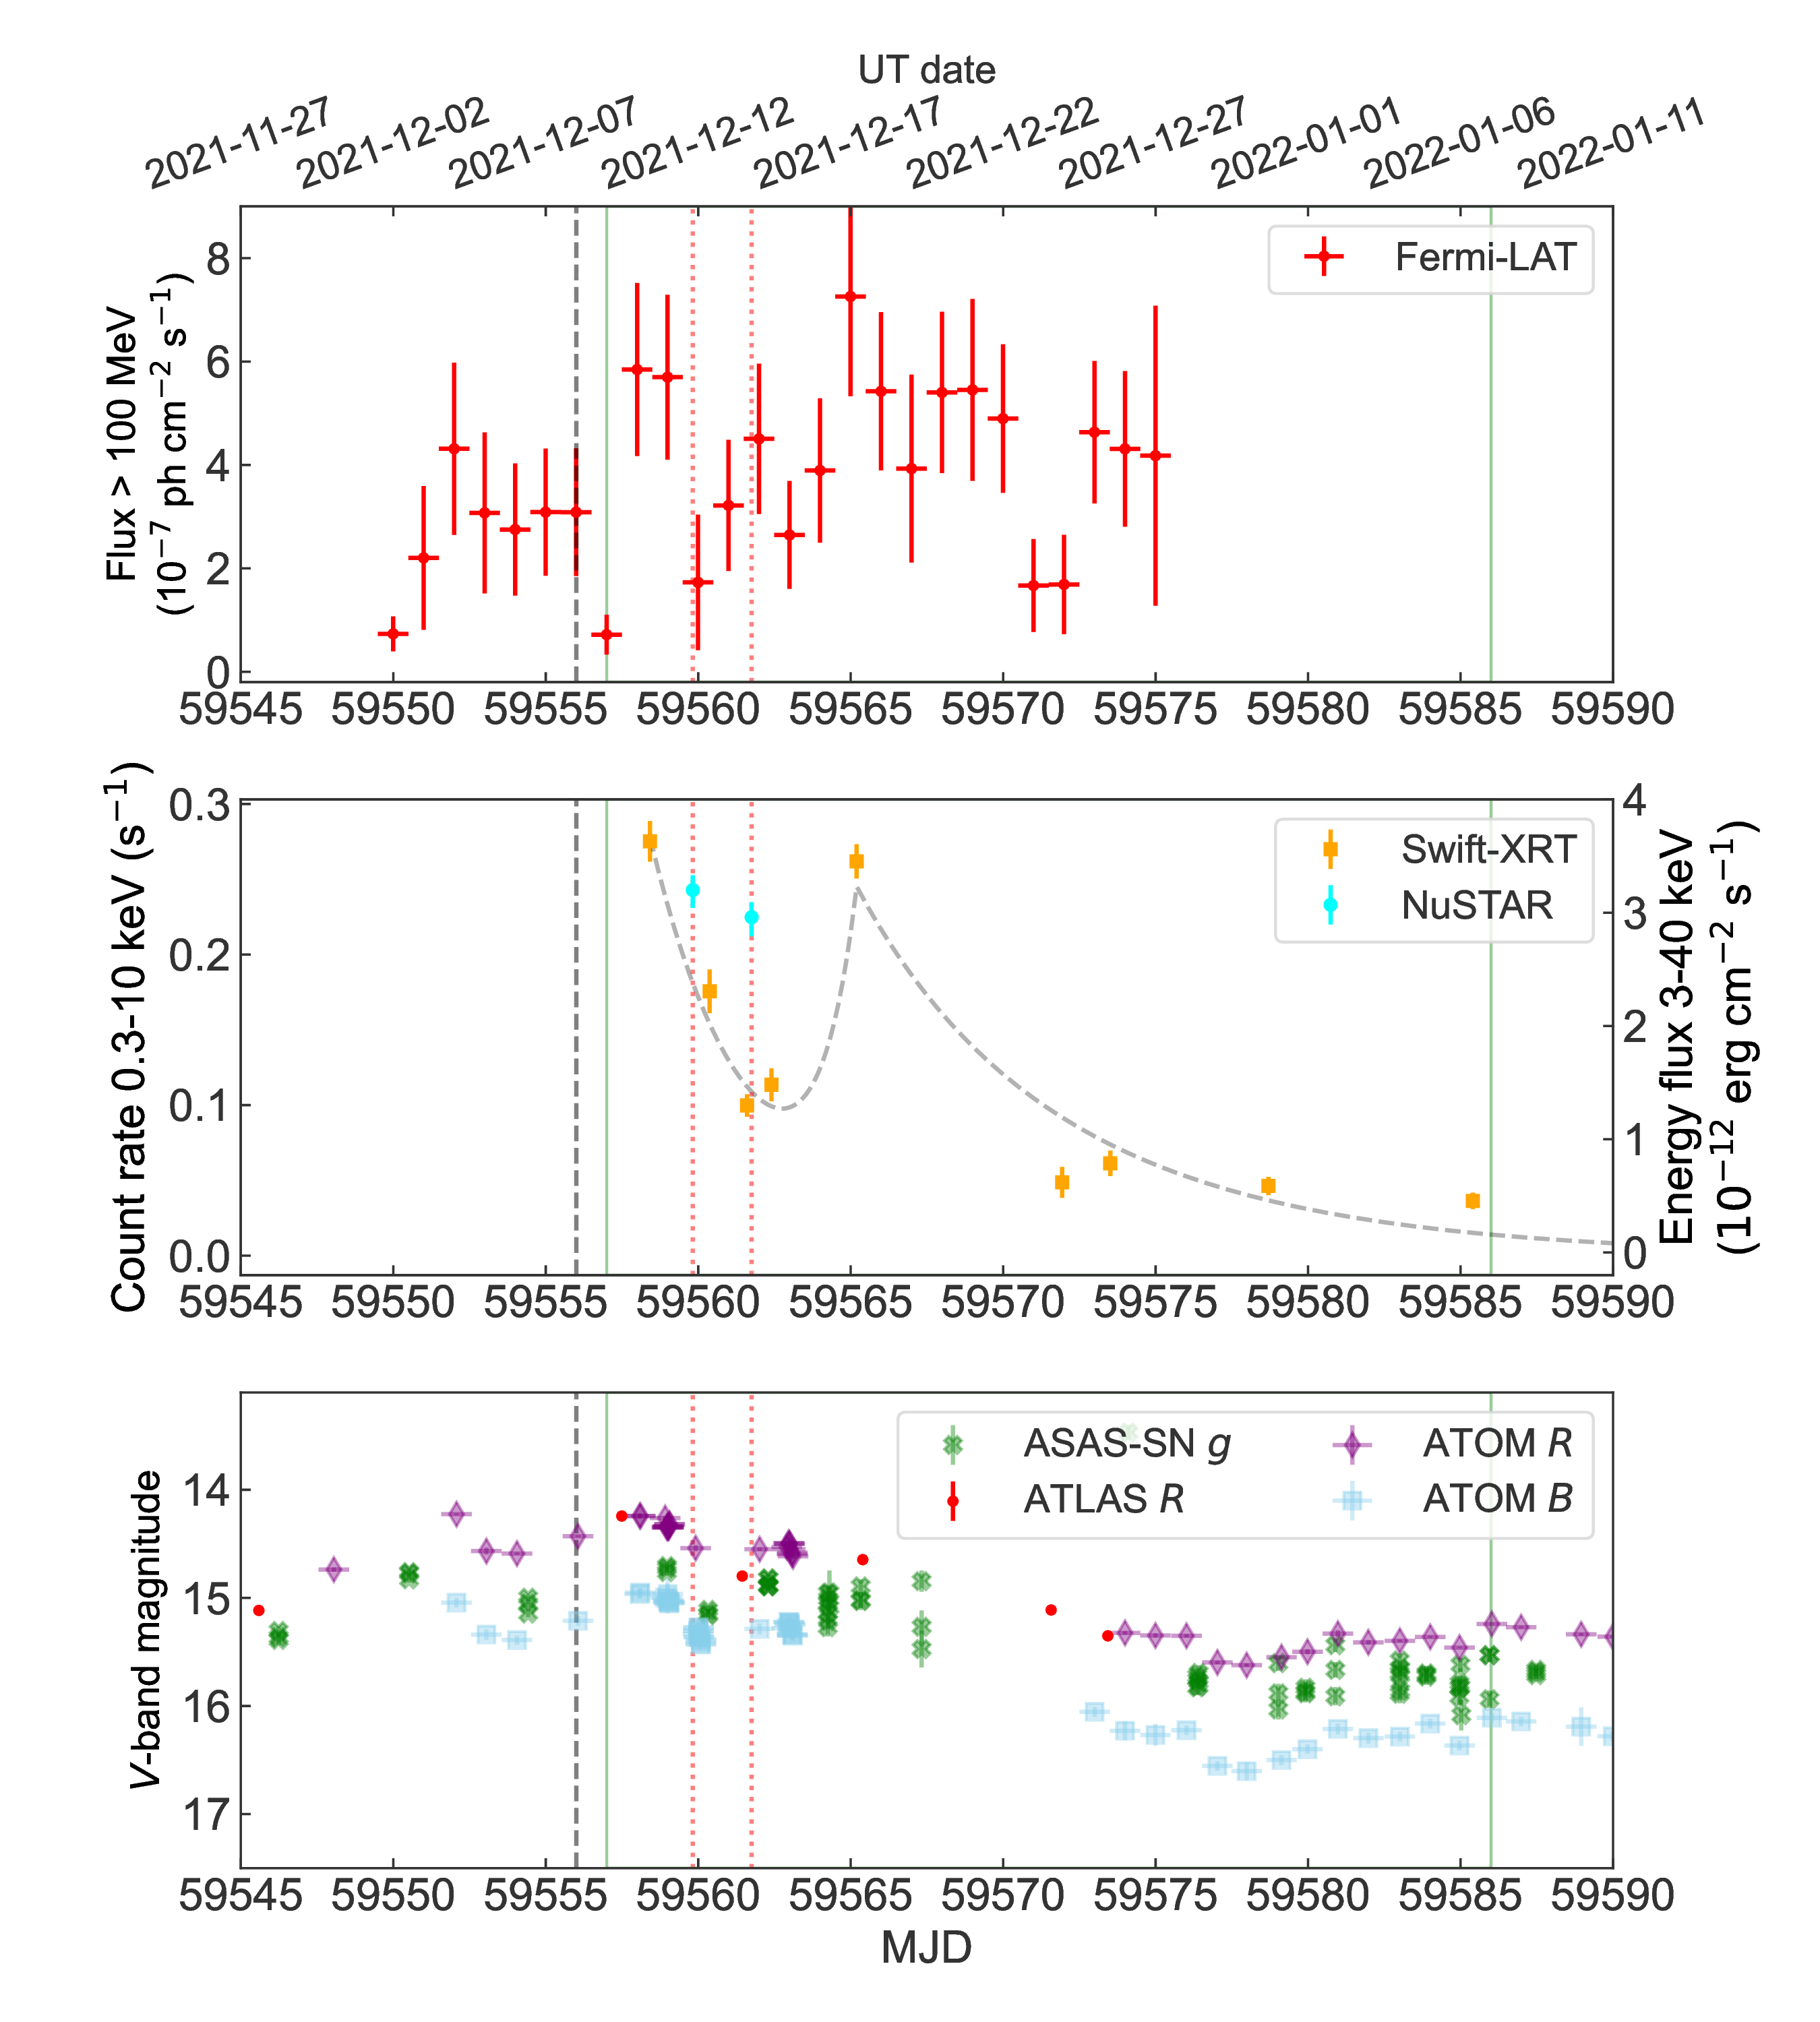
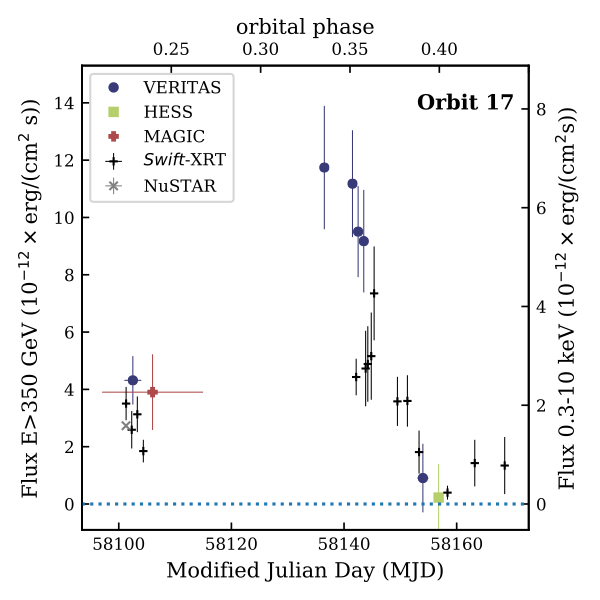
Figure 1b: The light curves focusing on a ∼2-month period after the neutrino event. The Fermi-LAT flux is binned nightly. The vertical dashed lines show the time of the neutrino event; the dotted lines show the times of the two NuSTAR observations presented in this work; the green hatch-filled regions show the period during which the VERITAS and H.E.S.S. data were taken. The dashed curve in the middle panel shows the best-fit model with three exponential components to describe the Swift-XRT data.
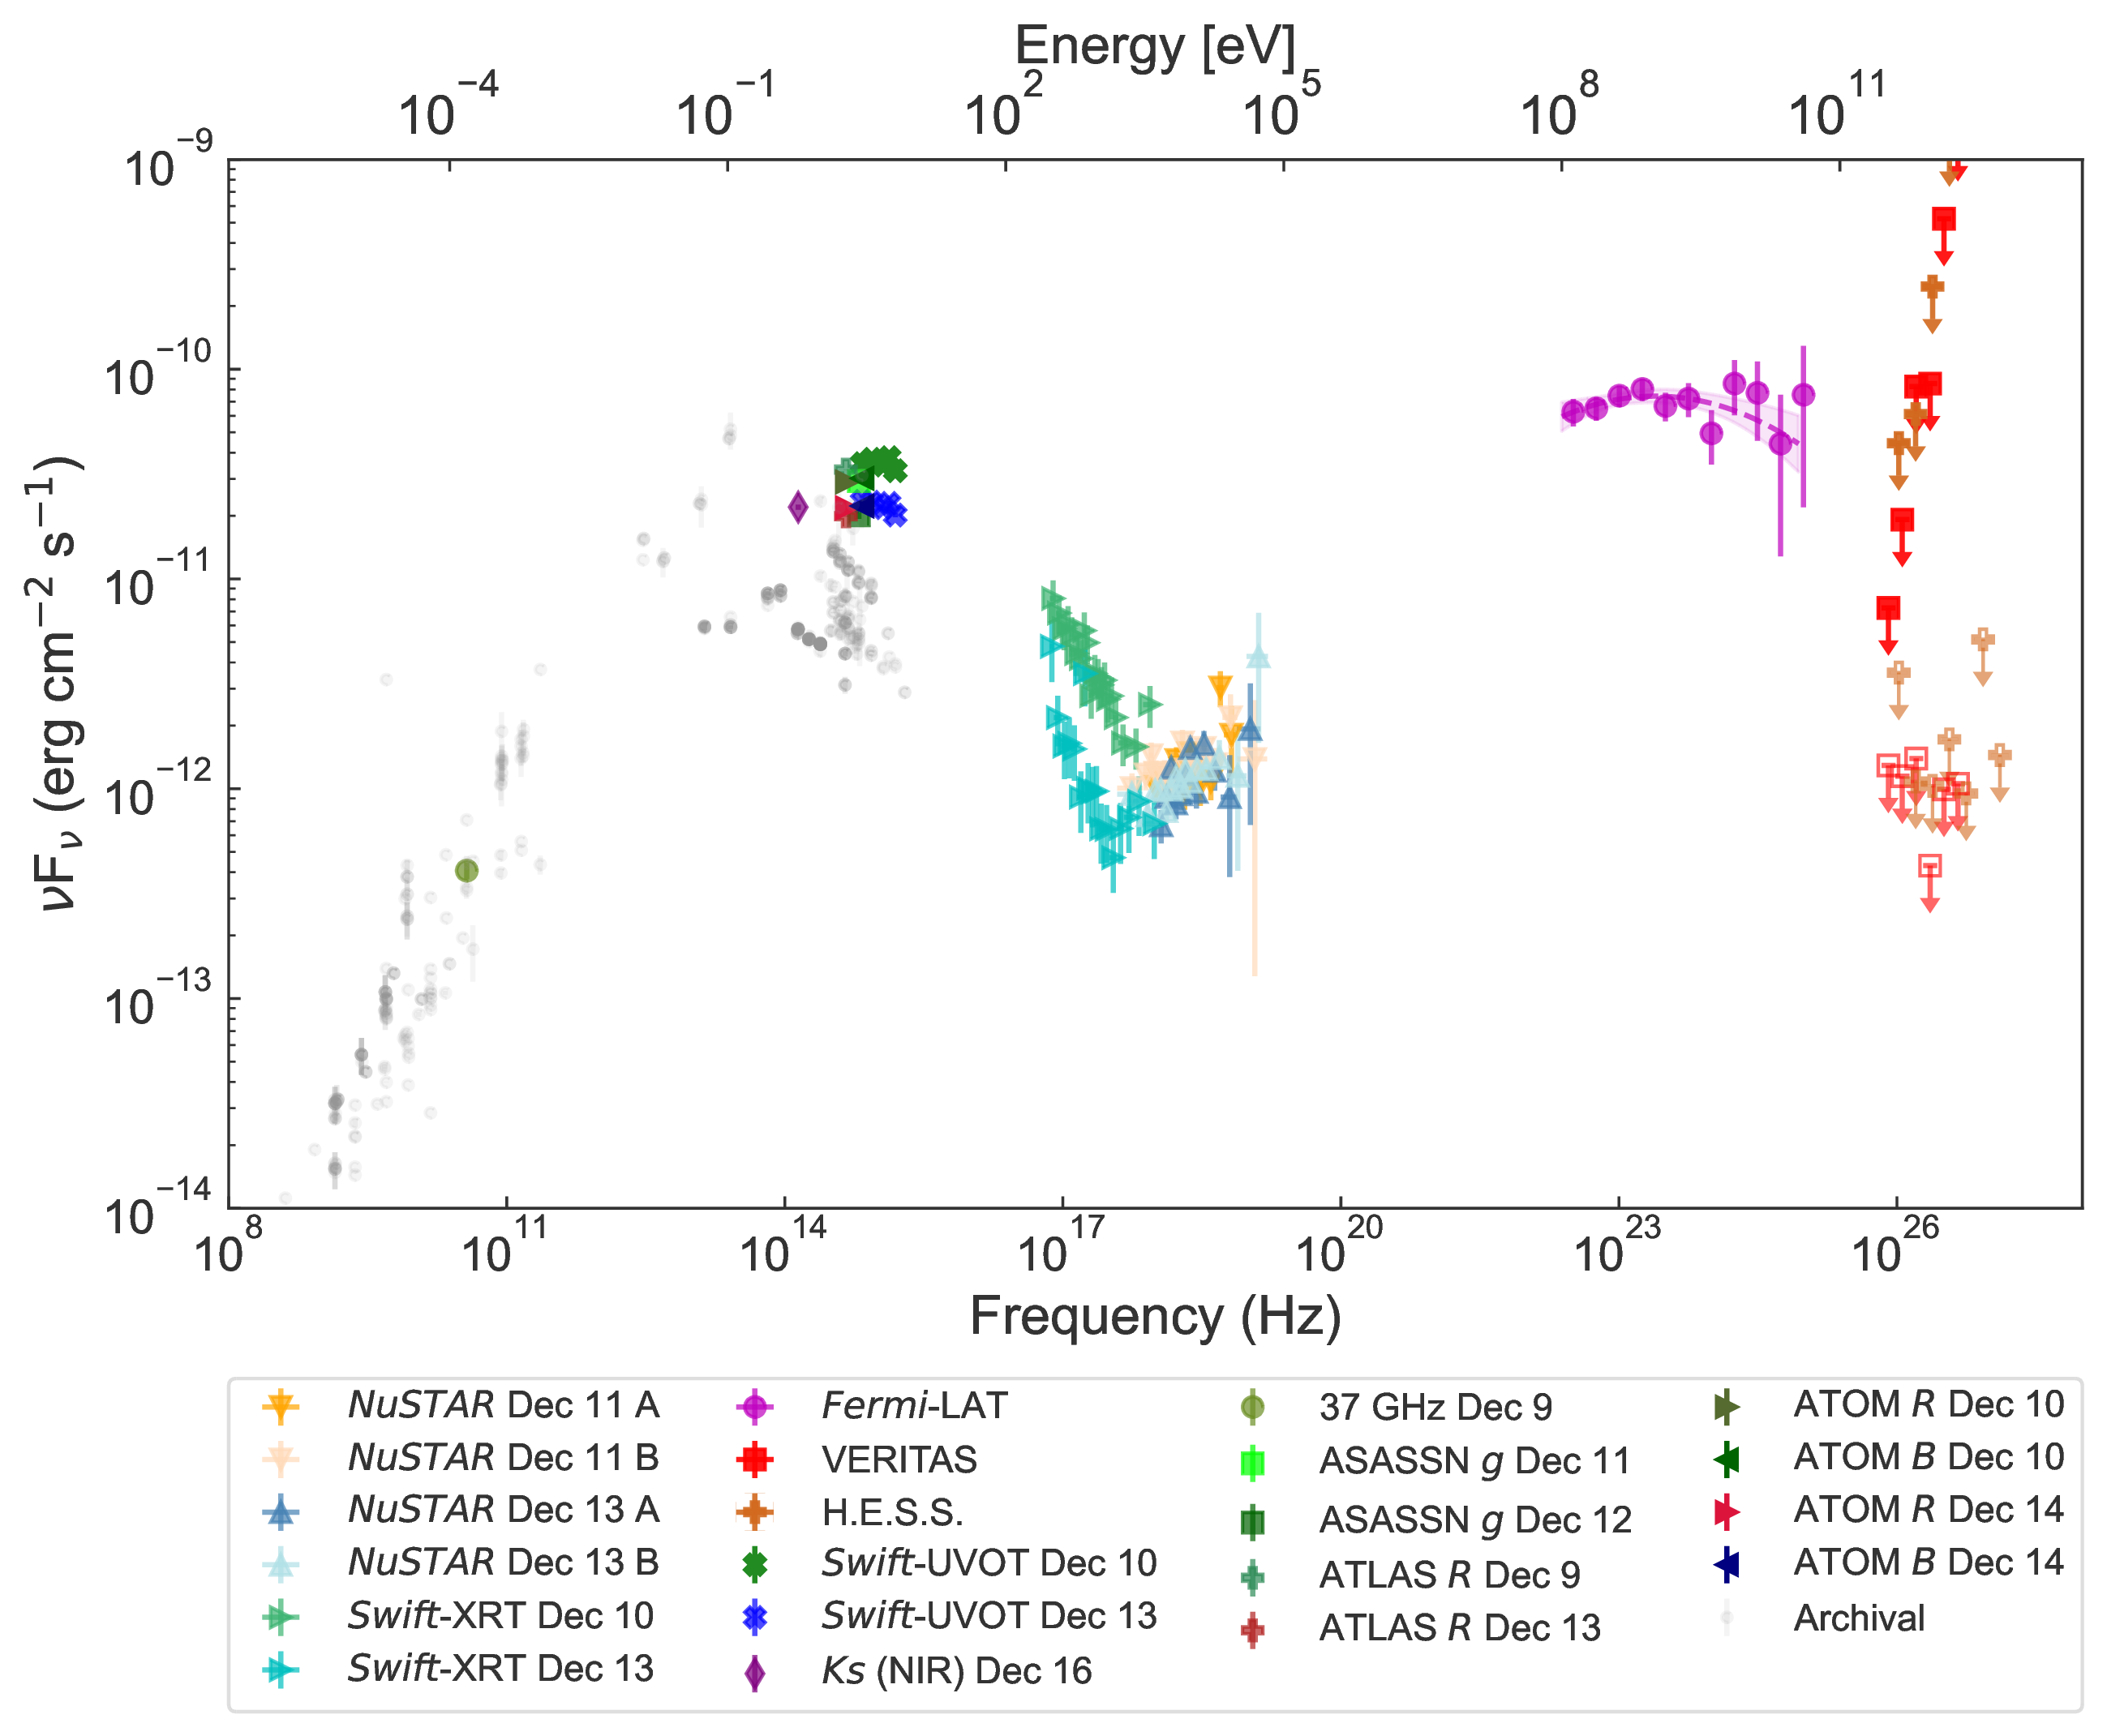
Figure 2: The broadband SED of PKS 0735+178 in December 2021 along with archival data from radio to UV bands (shown as gray filled circles). The VERITAS and H.E.S.S. spectra were averaged over the entire period of the ToO observations (see Section 2), with the observed SED and those corrected for the EBL absorption shown as the unfilled and filled symbols, respectively. The Fermi-LAT spectrum was averaged over a four-week period from December 1 to 28, 2021. The magenta shaded region shows the best-fit log-parabola model to the Fermi-LAT spectrum and its 1-σ uncertainty.
Figure 3: The lepto-hadronic model with an external photon field, as described in Section 4.4. The solid blue, orange, and green lines are the synchrotron, SSC, and external Compton components of the leptonic emission from the primary electrons, respectively; the dashed red line is the combined synchrotron and inverse-Compton emission from Bethe-Heitler pairs; the dotted and dash-dotted lines are the neutral and charged pion cascade components, respectively; the solid gray line is the sum of all electromagnetic components; and the solid pink line above a few TeV is the neutrino emission. The yellow star marks the nominal flux of 1.5 170-TeV neutrinos per year using an effective area of 30 m2 (see Subsections 4.2.1 and 4.4) to guide the eye.

