In this paper, we report the discovery of very high energy (VHE) gamma-ray emission from the blazar S3 1227+25. This detection makes S3 1227+25 one of only nine intermediate-frequency-peaked BL Lacertae (IBL) objects detected in the VHE regime with current ground-based gamma-ray observatories. The VERITAS observations were triggered by the detection of a hard-spectrum GeV flare on May 15, 2015 with the Fermi-Large Area Telescope (LAT). The VERITAS and Fermi-LAT observations were also complemented with target of opportunity observations with Swift, optical photometry, polarimetry and radio measurements, also presented in this work, in addition to the VERITAS and Fermi-LAT data.
A combined five-hour VERITAS exposure on May 16th and May 18th, 2015 resulted in a strong 13σ detection at a flux level at 9% of the Crab Nebula above 120 GeV. A temporal analysis of the gamma-ray flux during this period finds evidence of a shortest variability timescale of 6.2 ± 0.9 hours, indicating emission from compact regions within the jet, and the combined gamma-ray spectrum shows no strong evidence of a spectral cut-off. An investigation into correlations between the multiwavelength observations found evidence of optical and gamma-ray correlations, suggesting a single-zone model of emission. Finally, the multiwavelength spectral energy distribution is well described by a simple one-zone leptonic synchrotron self-Compton radiation model.
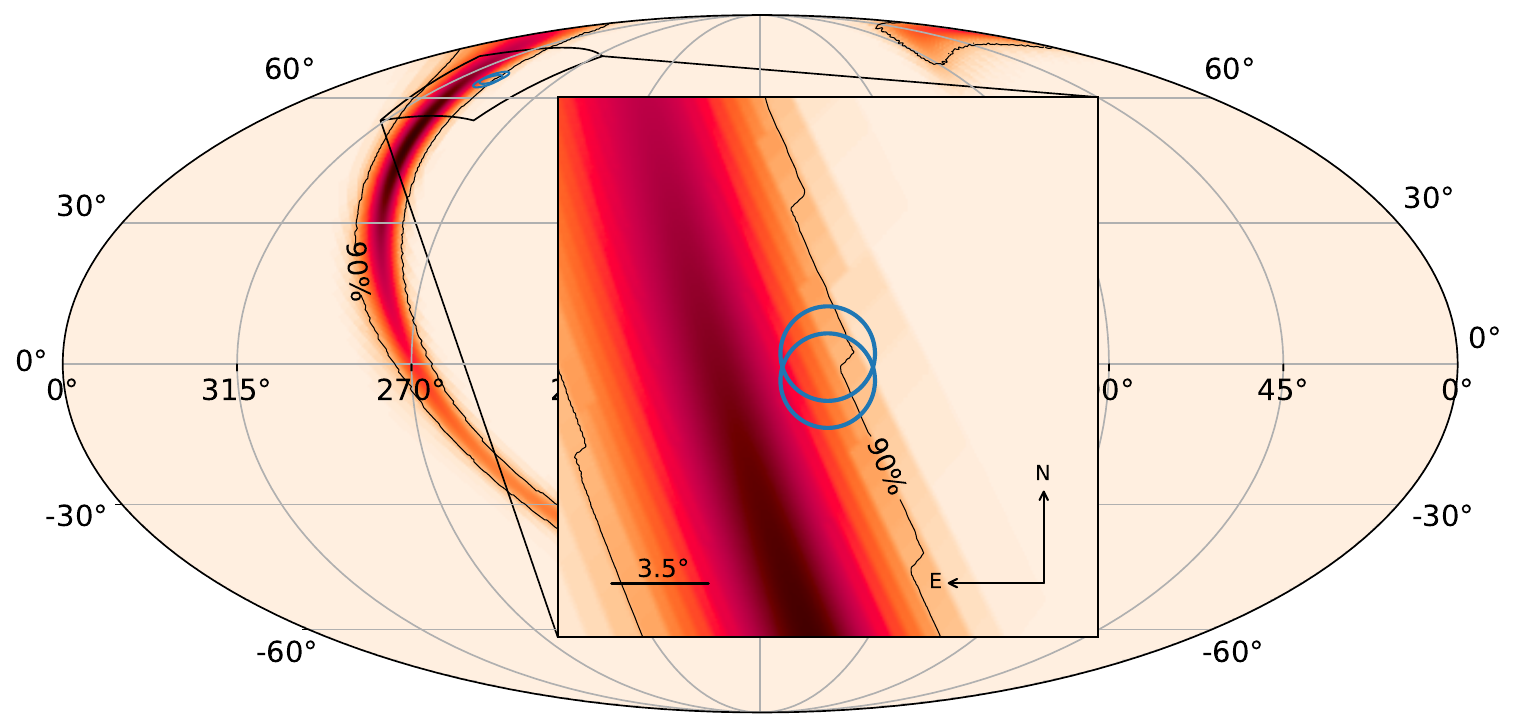
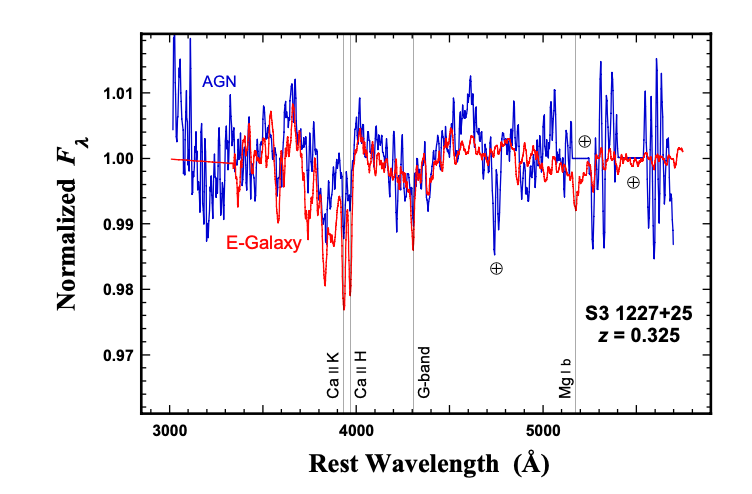
Figure 1: The normalized median spectrum of S3 1227+25 compared to the normalized spectrum of a typical late-type galaxy. Identifying observed features with Ca II H&K and the G-band yielded a redshift of z = 0.325. Major telluric absorption features in the spectrum of the AGN are marked with the terrestrial symbol. The redder telluric features have been edited out of the spectrum of S3 1227+25.
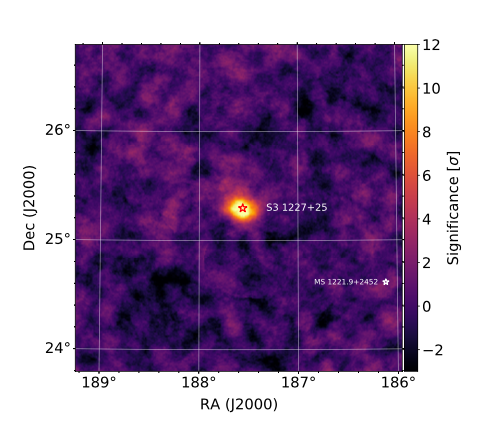
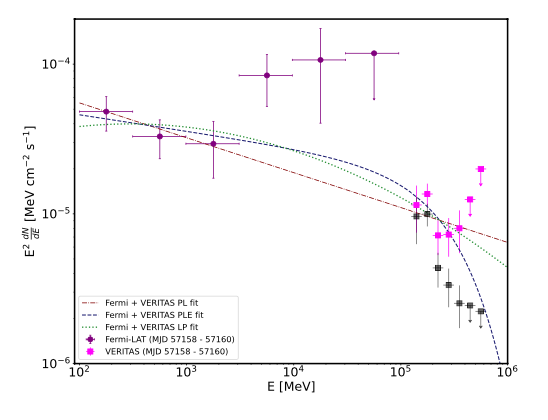
Figure 2: Left: VERITAS significance skymap based on observations taken on May 16, 2015 and May 18, 2015 UTC (MJD 57158 and 57160) at the location of the new VHE source positionally coincident with S3 1227+25. The known VHE blazar MS 1221.9+2452, shown with a white marker, was not detected during this period. Right: The purple data points show the Fermi-LAT spectrum obtained for S3 1227+25 in the energy range 100 MeV–100 GeV between May 16 and May 18, 2015 UTC (MJD 57158 – 57160). The data are binned into two energy bins per decade, with individual bins having a TS < 4 (roughly corresponding to a significance of ∼ 2σ) considered as upper limits. The magenta data points show the VHE spectrum for S3 1227+25 based on VERITAS observations taken on May 16 and May 18, 2015 UTC (MJD 57158 – 57160). A minimum significance of two standard deviations and three on-source photons are required for each flux point and upper limits at 95% confidence level are quoted otherwise. De-absorbed flux points, using the Domınguez et al. (2011) EBL model, are shown in magenta and the corresponding observed fluxes are shown in black. A power law (PL), power law with exponential cut-off (PLE) and log parabola (LP) function is fit to the de-absorbed combined gamma-ray spectrum and is shown as dashed red, blue and green curves respectively.
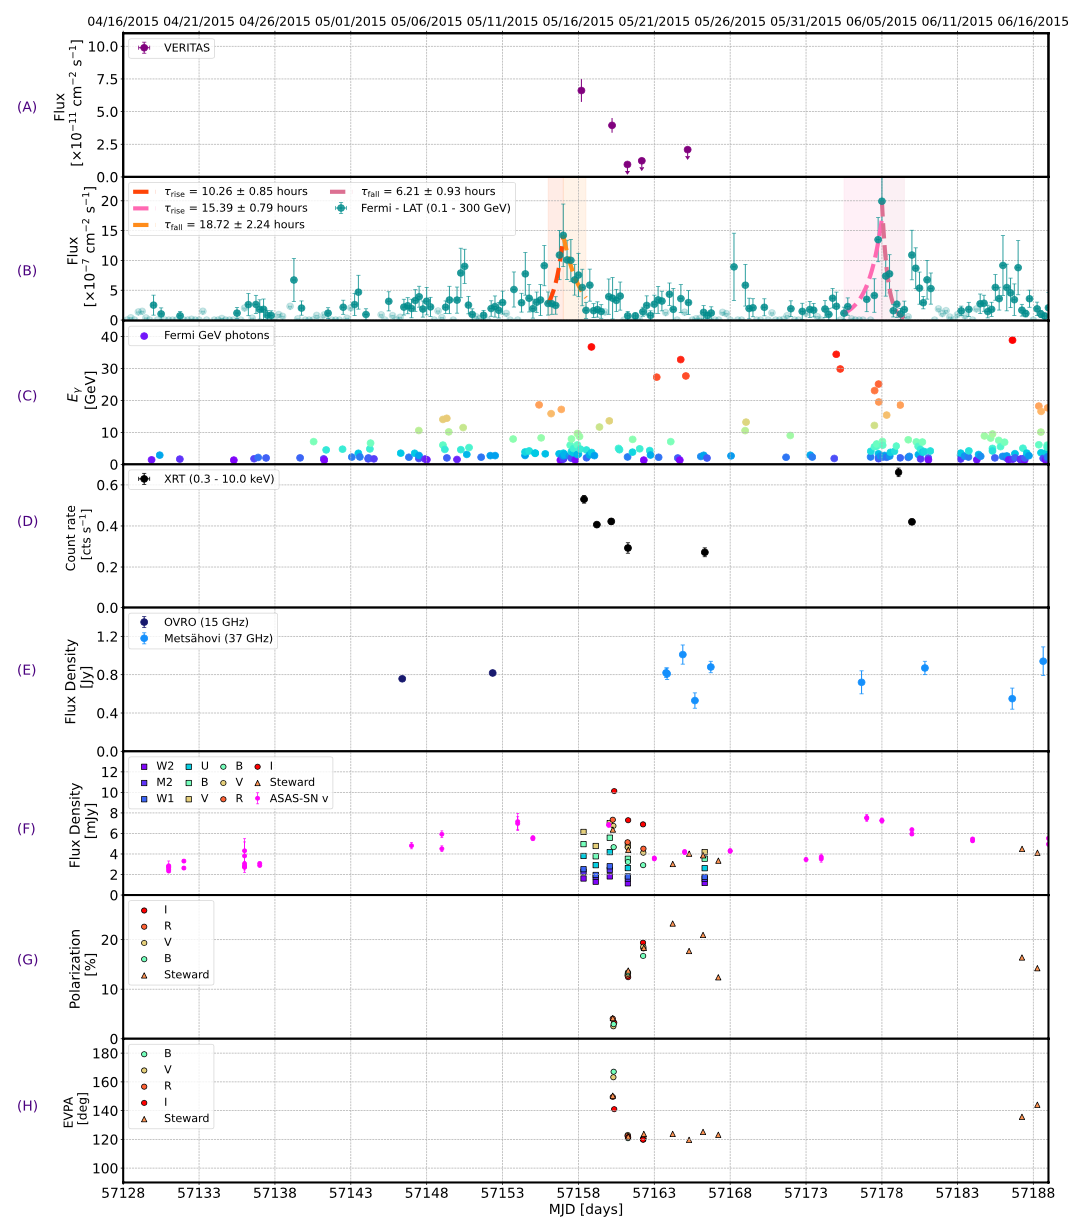
Figure 3: Multiwavelength lightcurves of S3 1227+25 between MJD 57128 and MJD 57189, which corresponds to midnight on April 16, 2015 until midnight on June 16, 2015, a month either side of the VERITAS detection. (A) Daily-binned VHE lightcurve for VERITAS observations above an energy threshold of 120 GeV. Upper limits at 95% confidence level are quoted for observations with a significance of lower than 2σ. (B) Fermi-LAT lightcurve in 6 hour bins in the 0.1–300 GeV band. The shaded regions indicate the two periods of flaring activity used to compute the variability timescales, obtained from the fits (dashed curves) and shown in legend. Upper limits are shown for individual bins having a significance of lower than 2σ. (C) Fermi-LAT GeV photon energies positionally coincident (at 95% containment) with the source position. (D) Swift-XRT count rate in the 0.3–10 keV band. (E) Radio flux observations: OVRO (dark blue) and Metsahovi (light blue) lightcurves at 15 GHz and 37 GHz respectively. (F) Optical/UV flux observations: Swift-UVOT (square markers), Lowell Observatory (circles), Steward photometry in the 4000-7000 ̊A band (triangles) and optical data, not corrected for extinction, from the ASAS-SN Sky Patrol (magenta points). (G) Electric vector polarization angle (EVPA): Lowell Observatory (circles), Steward photometry in the 4000-7000 ̊A band (triangles). (H): Polarization: Lowell Observatory (circles), and Steward photometry in the 4000-7000 ̊A band
(triangles).
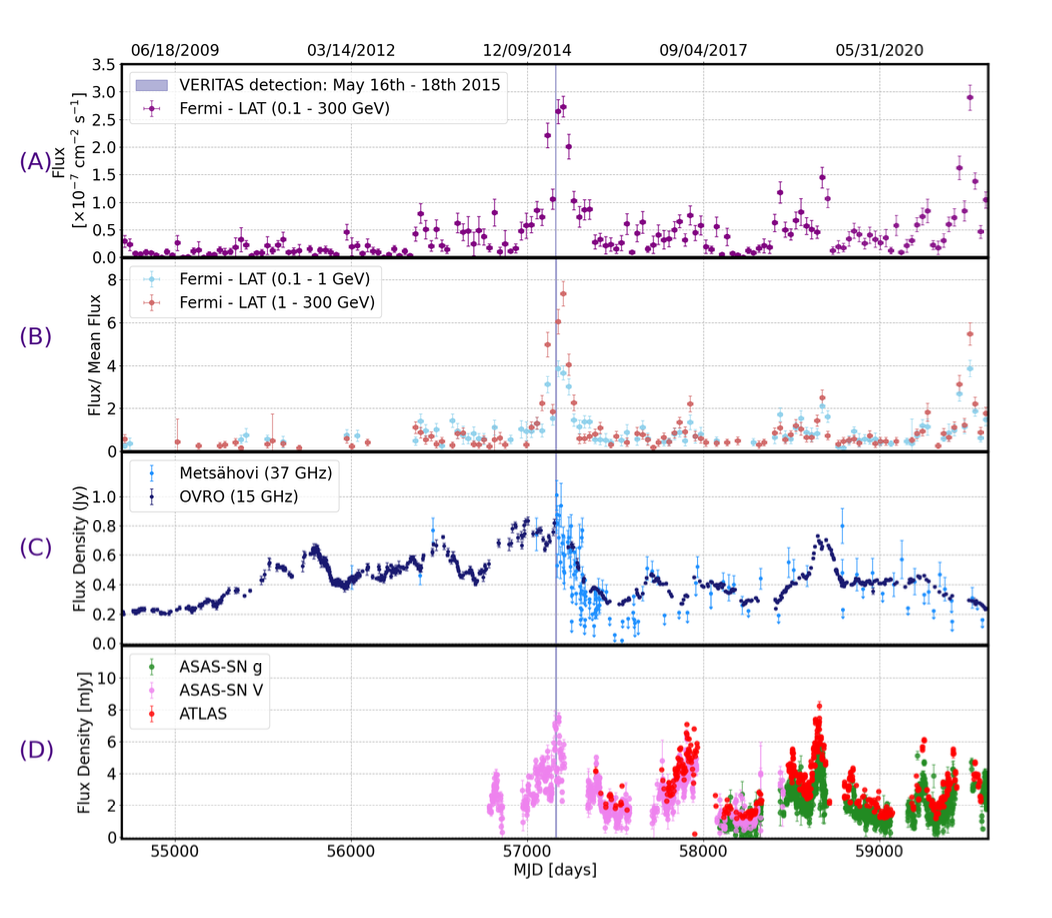
Figure 4: Multiwavelength lightcurves of S3 1227+25 over a wider time interval, MJD 54683 to MJD 59611, corresponding to midnight on August 4, 2008 until midnight on February 1, 2022. The blue narrow band corresponds to the VERITAS detection. (A) Fermi-LAT lightcurve in the 0.1–300 GeV band. (B) Separate Fermi-LAT lightcurves showing the low energy flux (0.1 ≤ Eγ ≤ 1 GeV) as blue circles and the high energy flux (1 ≤ Eγ ≤ 300 GeV) using red circles. To aid visual comparison, the individual flux values have been divided by the mean flux in the corresponding energy ranges. The error bars are purely statistical and only data points with TS ≥ 10 are shown. (C) Radio flux observations: OVRO (dark blue) and Metsahovi (light blue) lightcurves at 15 GHz and 37 GHz respectively. For the Metsahovi data, individual bins having a signal-to-noise ratio of less than 4 are considered non-detections and shown as upper limits. (D) Optical flux observations: Optical data, not corrected for extinction, from the ASAS-SN Sky Patrol in the g and V band (green and magenta respectively) and ATLAS R band data (in red).

Figure 5: Local cross-correlation functions (LCCFs) calculated between the different lightcurves are shown in color. The x-axis represents the time delay, ∆ta,b = ta −tb, in days for two lightcurves a and b. The dashed vertical line corresponds to ∆ta,b = 0. The corresponding shaded regions indicate the error bounds of the LCCFs. The blue lines represent the 68%, 95% and 99% confidence intervals (from lighter to darker shades) derived from Monte Carlo simulations.
Figure 6: The multiwavelength broadband SED of S3 1227+25 during the nights of the VERITAS detection, May 16 – May 18, 2015 (MJD 57158 –57160), fitted using agnpy. The grey points represent archival data. The dashed brown curve represents the best fit one-zone synchrotron and SSC radiation model, obtained using all of the 5000 samples from all of the 30 walkers, with the parameters shown in Table 2.

