Superluminous supernovae (SLSNe) are a rare class of stellar explosions with luminosities ~10-100 times greater than ordinary core-collapse supernovae. One popular model to explain the enhanced optical output of hydrogen-poor (Type I) SLSNe invokes energy injection from a rapidly spinning magnetar. A prediction in this case is that high-energy gamma rays, generated in the wind nebula of the magnetar, could escape through the expanding supernova ejecta at late times (months or more after optical peak). This paper presents a search for gamma-ray emission in the broad energy band from
100 MeV to 30 TeV from two Type I SLSNe, SN2015bn and SN2017egm, using observations from Fermi-LAT and VERITAS.
The VERITAS observation consisted of a 1 hr serendipitous exposure of SNS2015bn while observing a different source a few months after the burst, and a 10 hr DDT observation on SN2017egm in early 2019, about 2 years after the burst. Although no gamma-ray emission was detected from either source, the derived upper limits approach the putative magnetar's spin-down luminosity. Prospects are explored for detecting very-high-energy (VHE; 100 GeV - 100 TeV) emission from SLSNe-I with existing and planned facilities such as VERITAS and CTA.
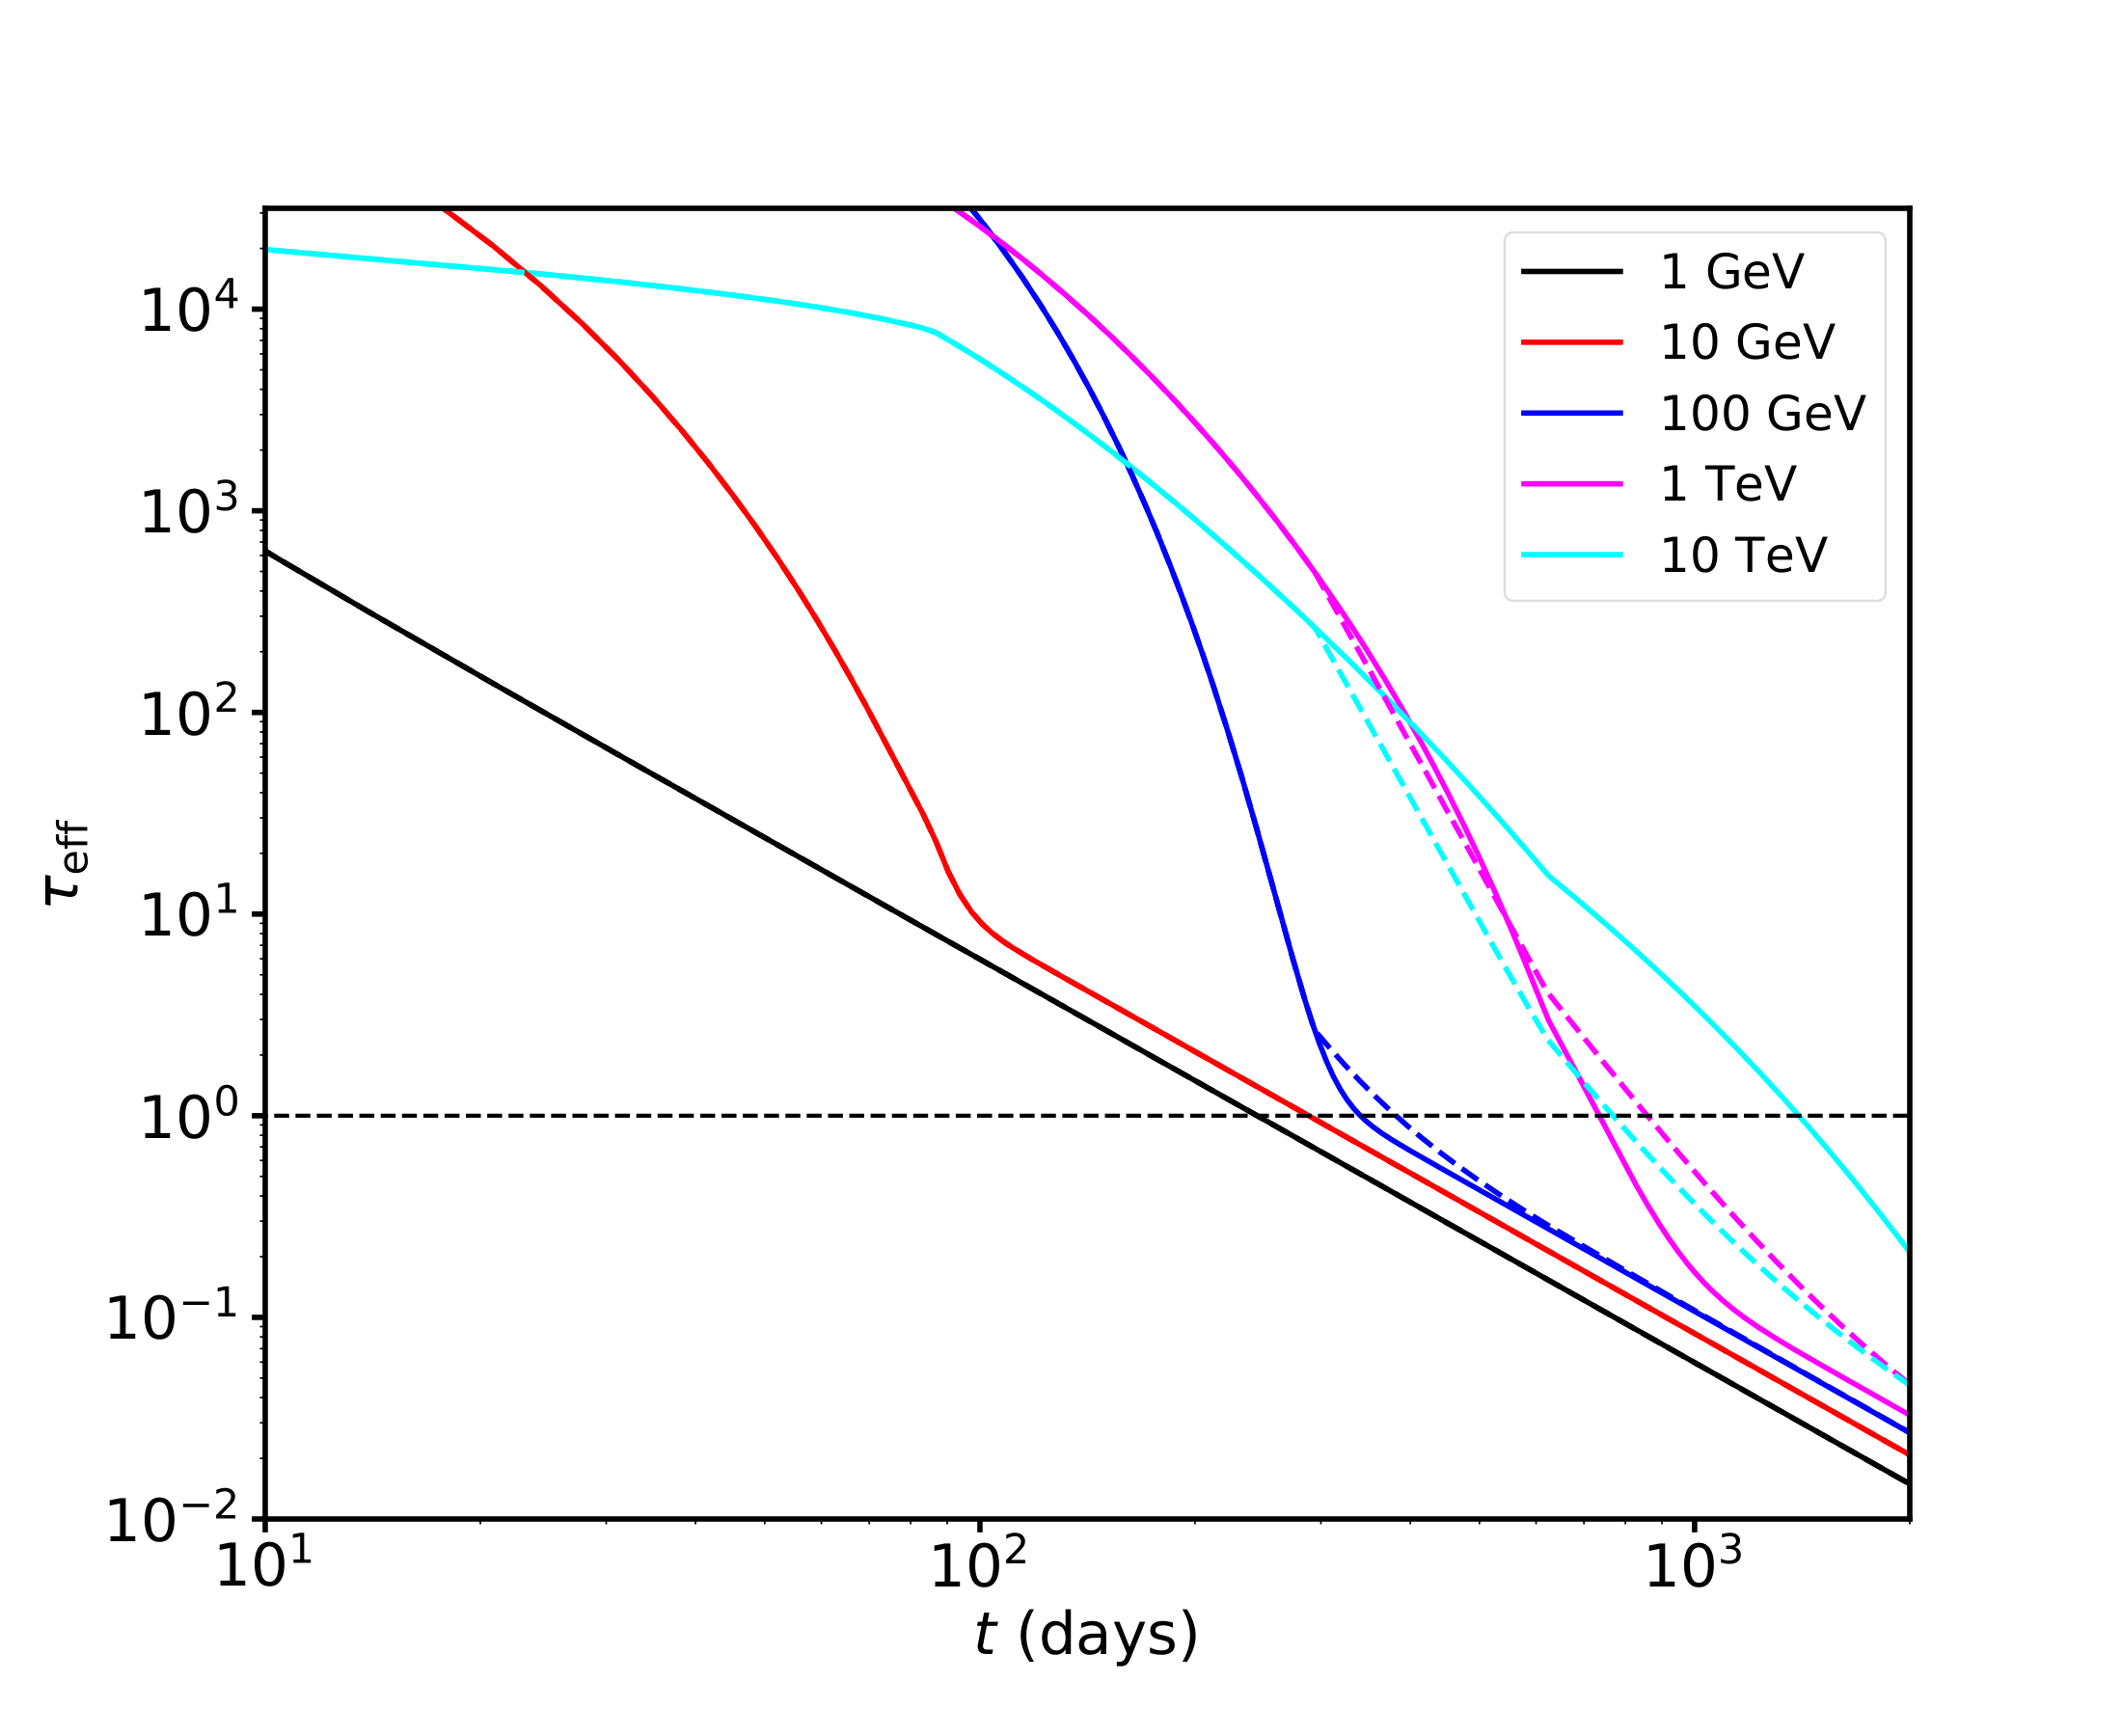
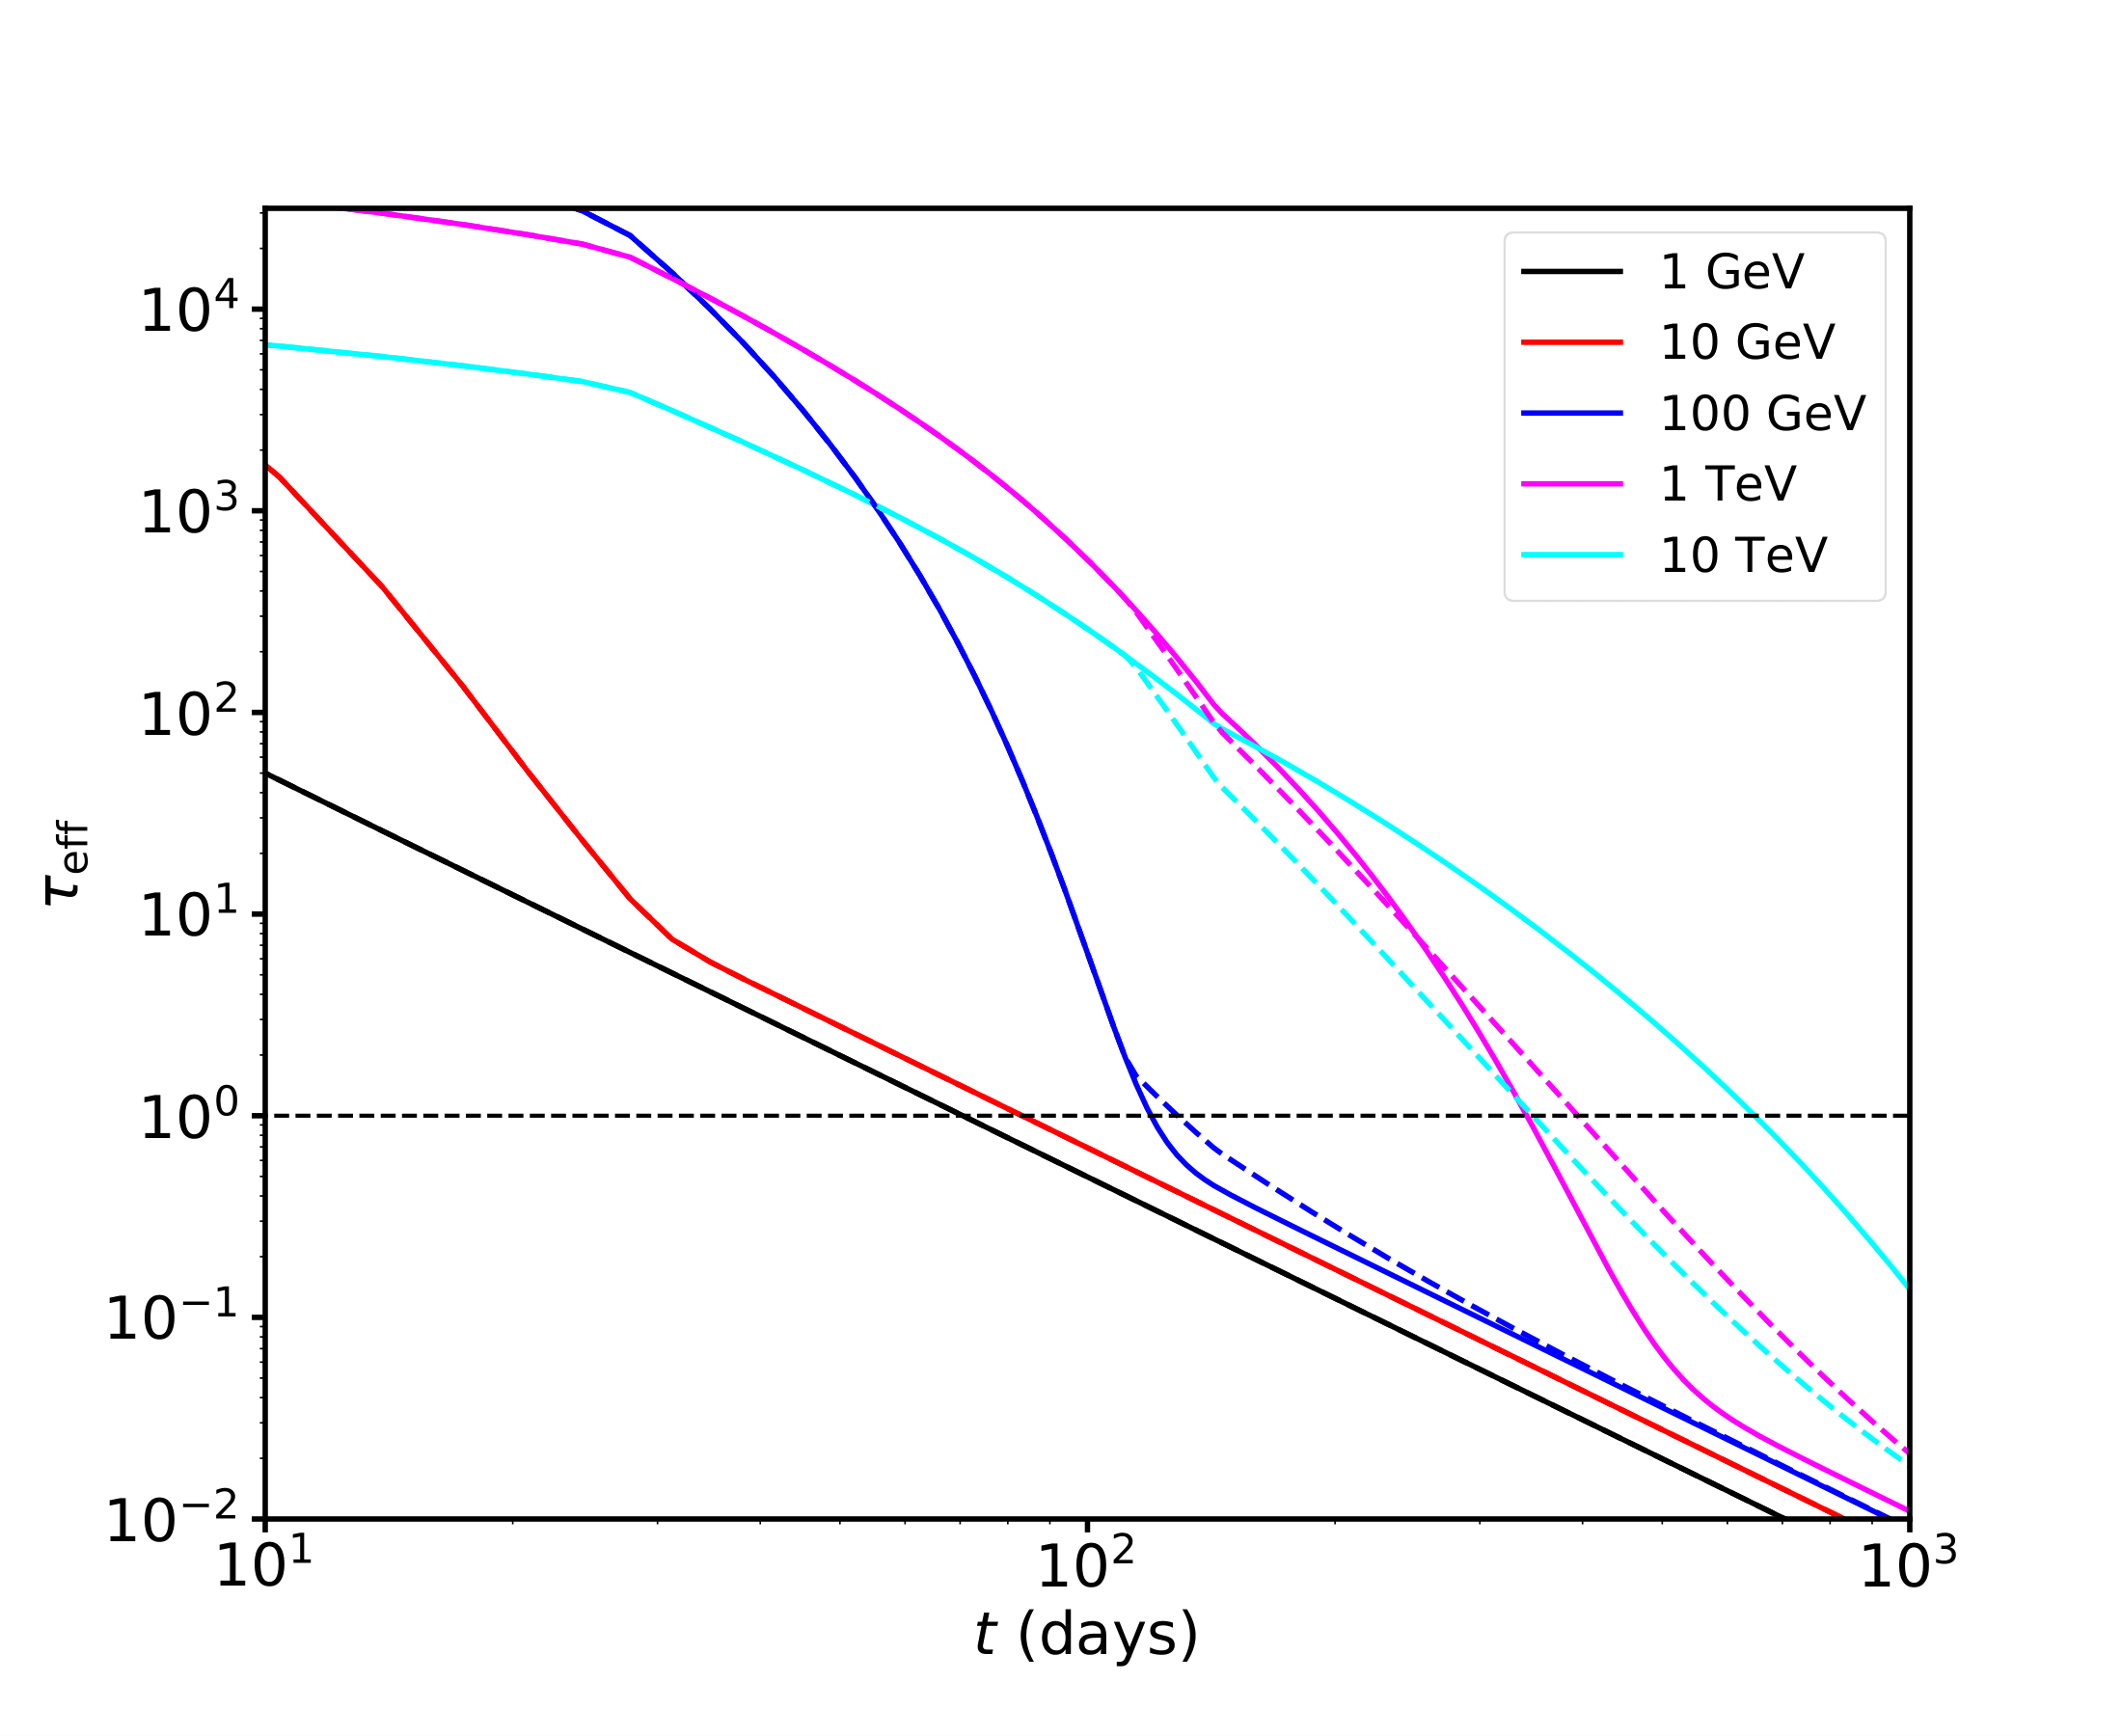
Figure 1: Optical depth at different photon energies as a function of time, calculated for ejecta properties (mass MΘ, mean velocity, etc.) derived from observations of SN2015bn (Nicholl et al. 2018) and SN2017egm (Nicholl et al. 2017a) shown in Table 1. Top: SN2015bn. Bottom: SN2017egm. The horizontal dotted line represents τeff = 1. The crosssections for photon-photon and photon-matter pair production opacities are taken from Zdziarski & Svensson (1989). The solid lines correspond to target blackbody radiation temperature Teff = (Lopt/4πR2)1/4 , where Lopt and R are the optical luminosity and ejecta radius, respectively. The dashed lines are computed with a temperature floor of T = 4000 K, to mimic the approximate spectrum in the nebular phase. Below ∼10 GeV the opacity is dominated by photon-matter pair production at all times. Above 100 GeV, pair production on the thermal target radiation field dominates up to a few years.
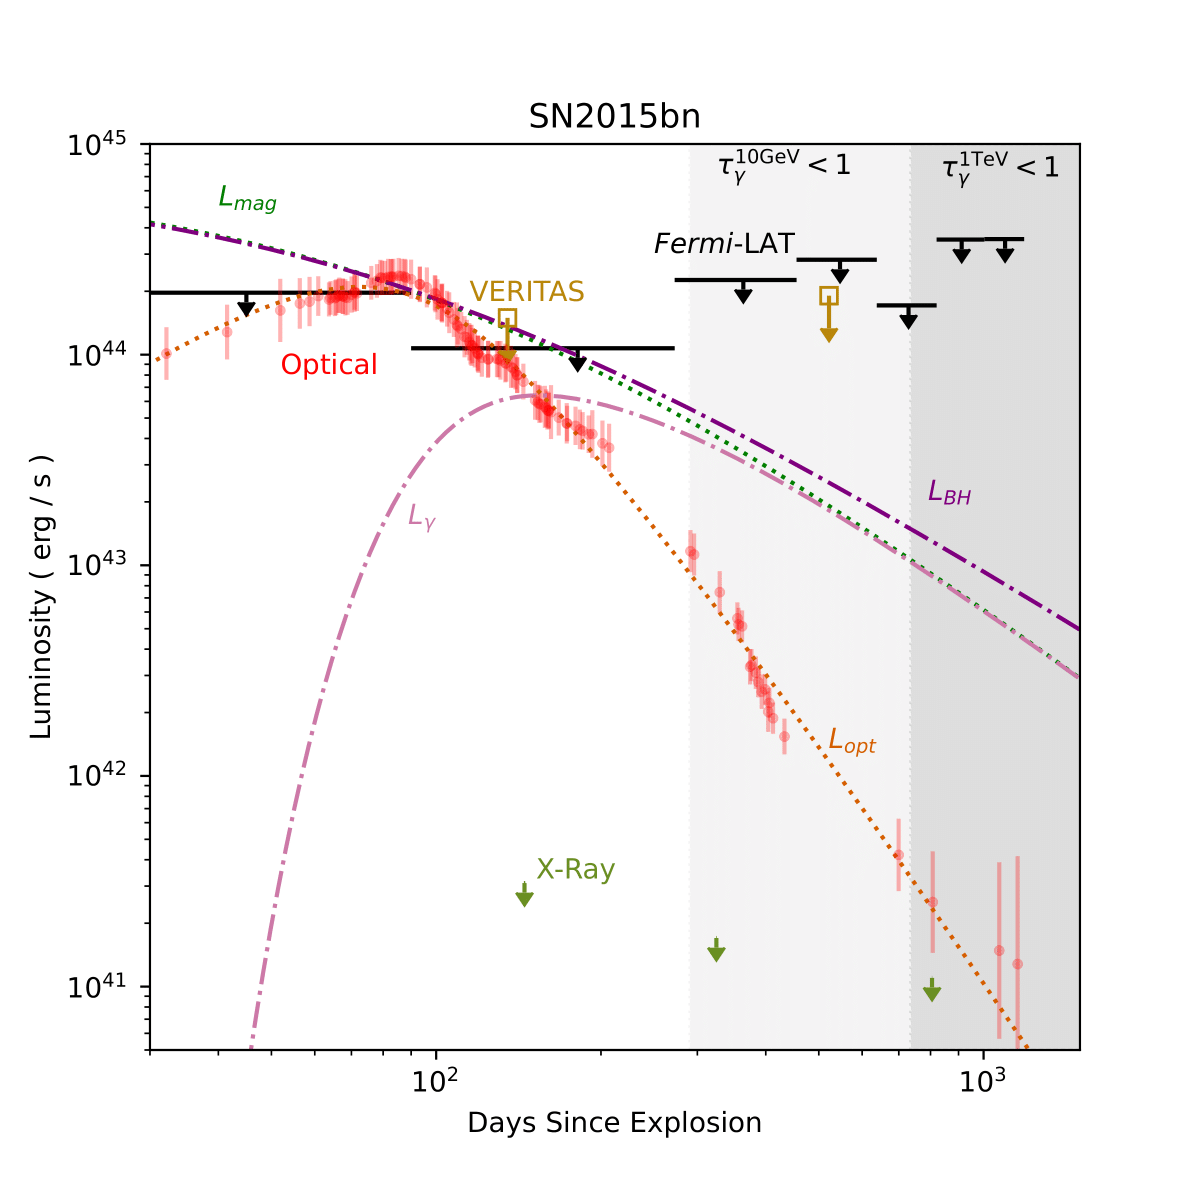
Figure 2: Light curves of SN2015bn spanning 30-1500 days after explosion. Curves shown include (1) the (thermal) supernova luminosity, Lopt, fit to UVOIR bolometric luminosity data (in red; Nicholl et al. 2018) to obtain the magnetar parameters; (2) magnetar spin-down luminosity, Lmag (green dotted lined); and (3) predicted gamma-ray luminosity that escape the ejecta, Lγ (pink dotted-dashed line; Equations A1, A3 and A4). Black bars show Fermi-LAT upper limits reported for six 180 day bins starting ∼90 days after explosion. The olive open box shows the VERITAS integral energy flux.
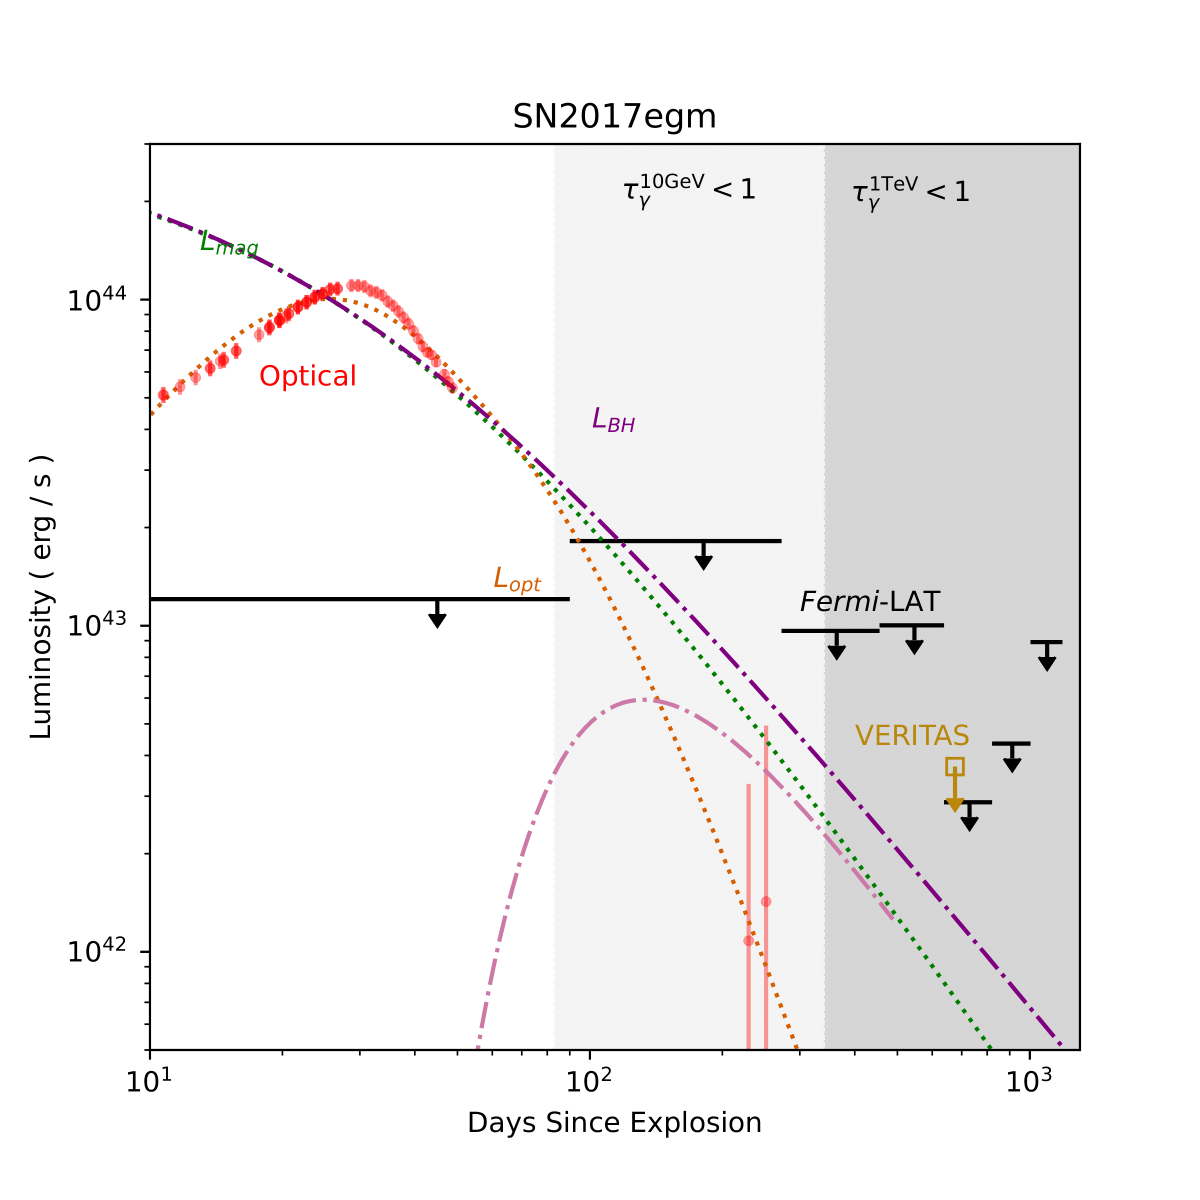
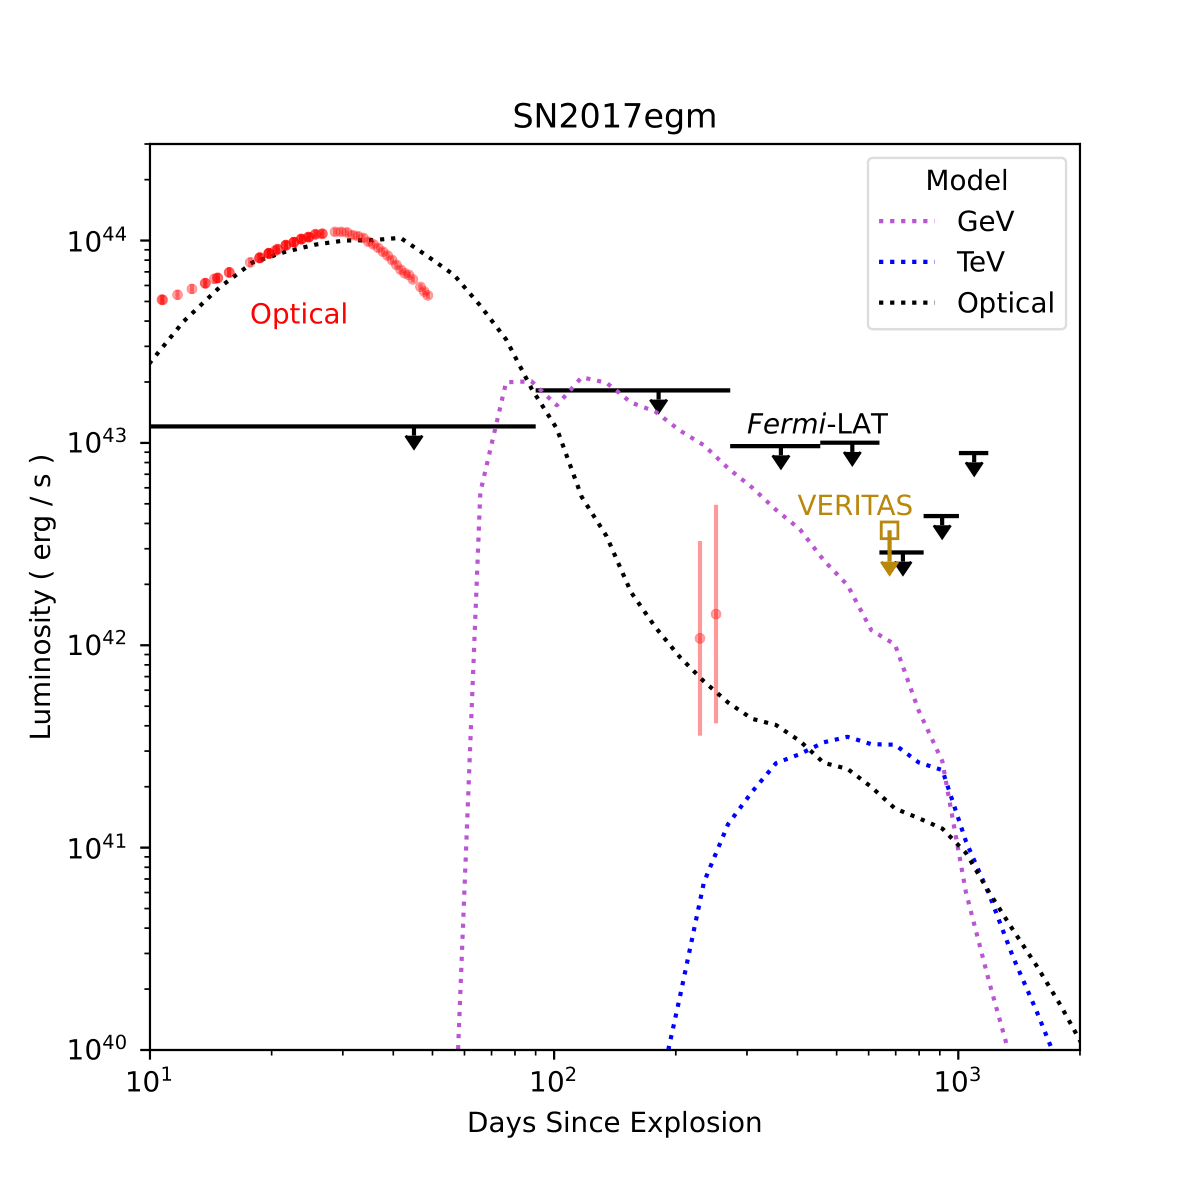
Figure 3: The SN2017egm light curve spanning 10-1300 days after explosion, following the same format as Figure 2. UVOIR data are shown in red (Bose et al. 2017; Nicholl et al. 2017a). Integral energy flux upper limits from Fermi-LAT are reported for six 180 day bins starting ∼90 days after the explosion. Integral energy flux upper limits are shown for VERITAS data taken ∼670 days after explosion, with EBL absorption correction applied. The maximum luminosity of the black hole accretion model LBH (Eq. 1) is shown in purple. All upper limits denote the 95% confidence level.
Figure 4: Model light curve for nebular magnetization (from Vurm & Metzger (2021)) for SN2015bn with εB = 10−7 (top panel) and SN2017egm with εB = 10−6 (bottom panel).
Figure 5: Top: escaping gamma-ray luminosity Lγ(t) for the sample of SLSNe fit by Nicholl et al. (2017b). Five well-studied SN are highlighted in blue, including SN2015bn. Overplotted are the VERITAS and CTA sensitivity curves for various exposures. Middle: distribution of peak escaping gamma-ray flux Fγ,max = max[Lγ]/4πD2 , for the light curves from the top panel where D is the distance to each source. Again, VERITAS and CTA sensitivities for different exposures are shown as vertical dashed lines. Bottom: distributions of times since explosion to reach the maximum gamma-ray flux Fγ,max from Fγ above.
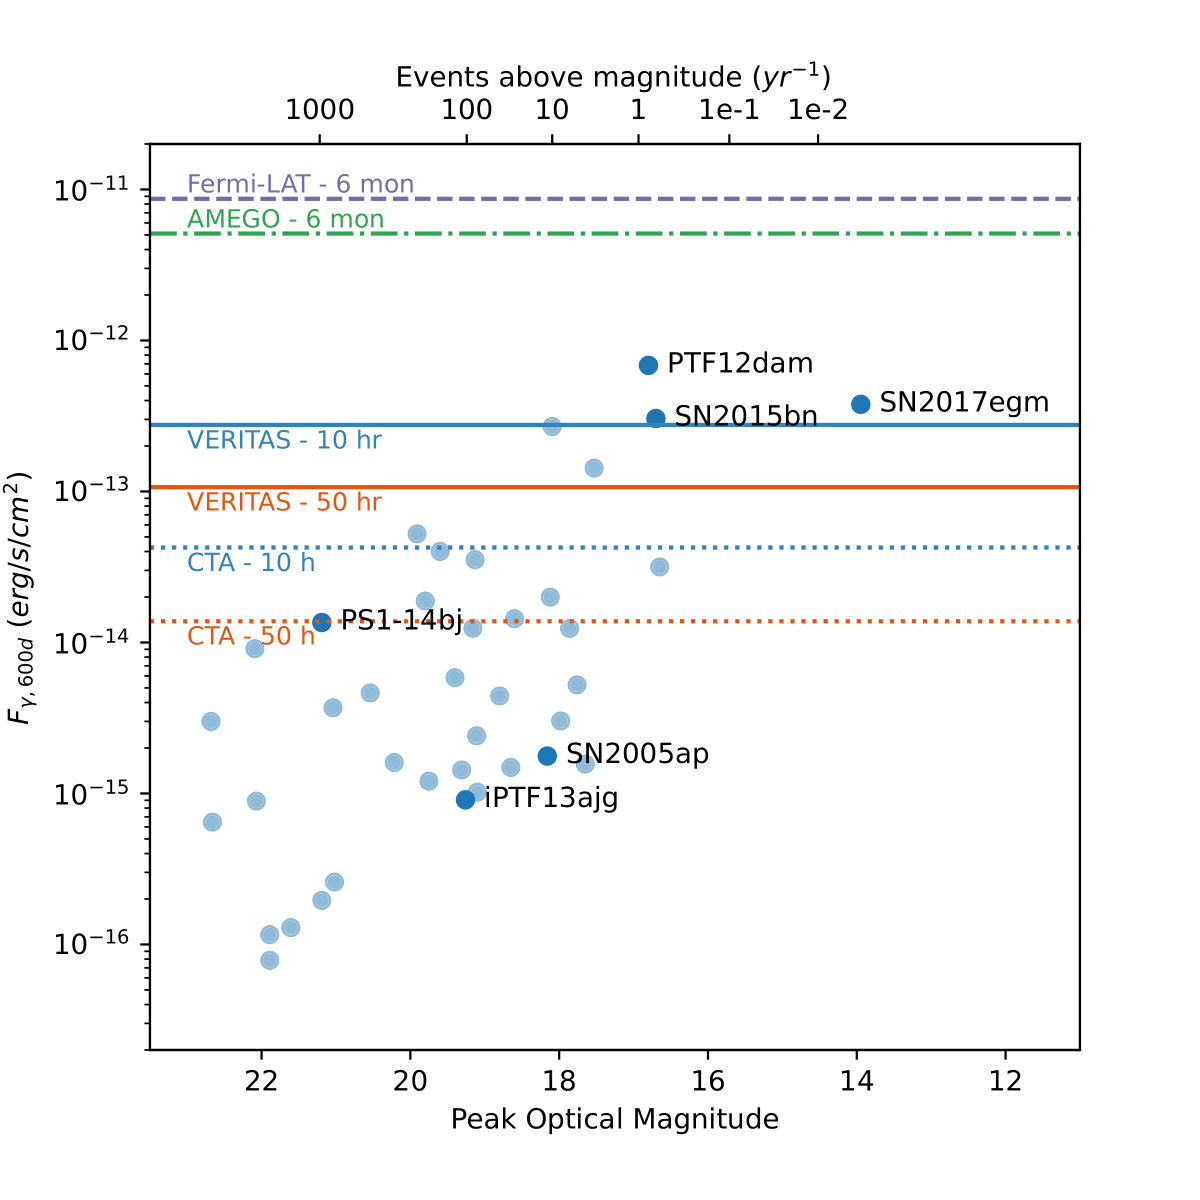
Figure 6: Blue dots show the peak optical apparent magnitudes of a sample of SLSNe-I (Nicholl et al. 2017b) as a function of their predicted maximum gamma-ray luminosity at 600 days after explosion (Fγ,600d). The top axis shows the approximate rate of events above the given peak optical magnitude, calculated using the method described in the main text. Peak maximum gamma-ray luminosities are calculated from fits of optical data with fixed κγ = 0.01 cm2 g−1 . Integral sensitivities of various instruments are overplotted for different exposures. Solid lines: VERITAS 10 and 50 hr integral sensitivities above 220 GeV. Dotted lines: CTA (in development) 10 and 50 hr integral sensitivities above 125 GeV as estimated from 50 hr Monte Carlo simulations of the southern array (The CTA Consortium 2019) and extrapolated to 10 hours. Similar extrapolation is done for Fermi-LAT from 10 yr to 6 months (Nolan et al. 2012) (dashed line). Proposed project AMEGO integral sensitivity above 100 MeV for 6 month observation window is also plotted (dashed-dotted line) (Kierans 2020).
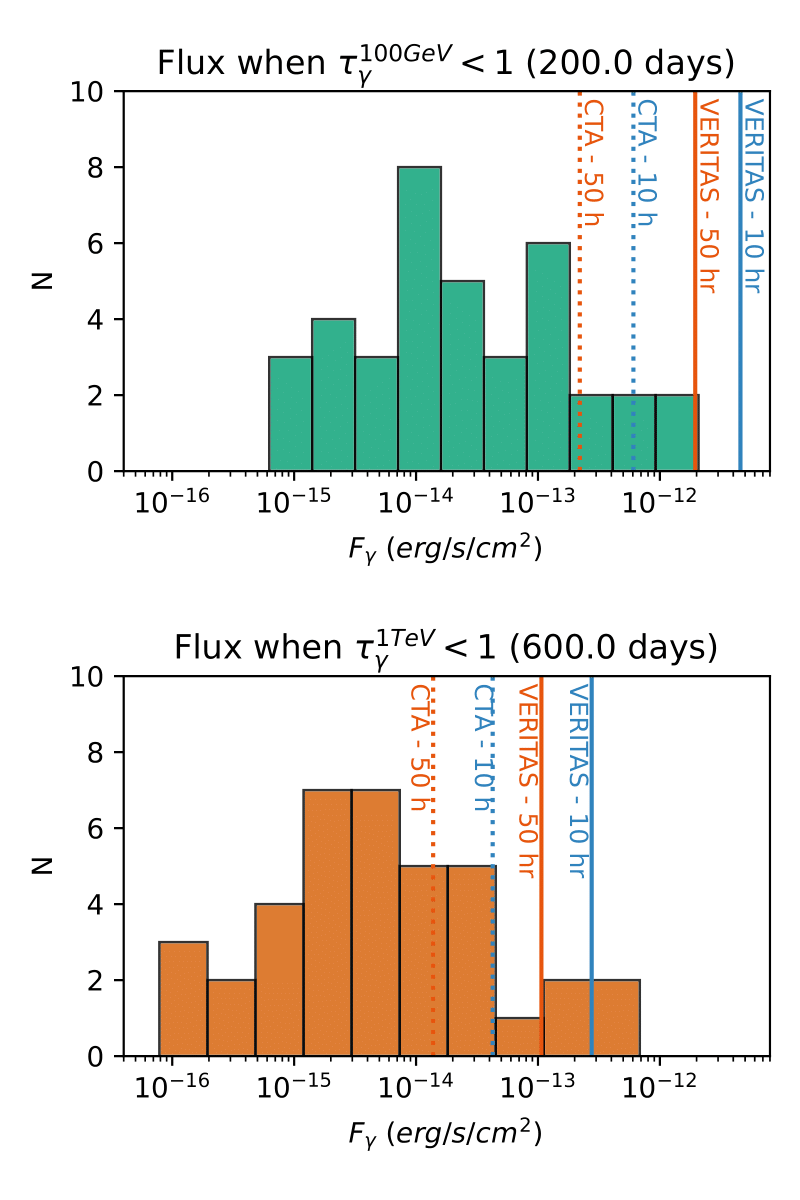
Figure 7: Distribution of gamma-ray luminosities Lγ at t = 200 d (top) and t = 600 d (bottom), when the optical depth for 100 GeV and 1 TeV photons drops below 1, calculated for a sample of 38 SLSNe (Nicholl et al. 2017b).
