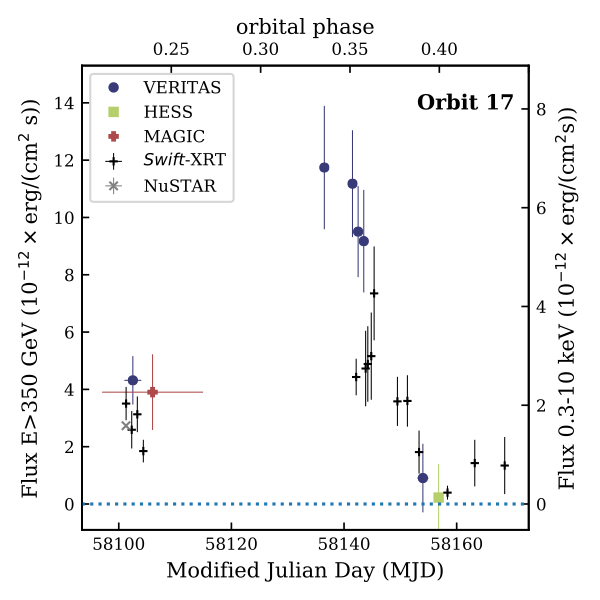
Broadband SED during the three Bayesian blocks obtained from the VERITAS light curve in the 2013 to 2014 season. See Figure 9 below for more details.
Reference: H. Abe et al. (The MAGIC, H.E.S.S. and VERITAS Collaborations, et al.), MNRAS 517, 4736 (2022)
MAXI J1820+070 is a low-mass X-ray binary with a black hole as a compact object. This binary underwent an exceptionally bright X-ray outburst from March to October 2018, showing evidence of a non-thermal particle population through its radio emission during this whole period. The combined results of 59.5 hours of observations of the MAXI J1820+070 outburst with the H.E.S.S., MAGIC and VERITAS experiments at energies above 200 GeV are presented, together with Fermi-LAT data between 0.1 and 500 GeV, and multiwavelength observations from radio to X-rays. Gamma-ray emission is not detected from MAXI J1820+070, but the obtained upper limits and the multiwavelength data allow us to put meaningful constraints on the source properties under reasonable assumptions regarding the non-thermal particle population and the jet synchrotron spectrum. In particular, it is possible to show that, if a high-energy gamma-ray emitting region is present during the hard state of the source, its predicted flux should be at most a factor of 20 below the obtained Fermi-LAT upper limits, and closer to them for magnetic fields significantly below equipartition. During the state transitions, under the plausible assumption that electrons are accelerated up to ~ 500 GeV, the multiwavelength data and the gamma-ray upper limits lead consistently to the conclusion that a potential high-energy and very-high-energy gamma-ray emitting region should be located at a distance from the black hole ranging between 10^11 and 10^13 cm. Similar outbursts from low-mass X-ray binaries might be detectable in the near future with upcoming instruments such as CTA.
FITS files: N/A
Figures from paper (click to get full size image):
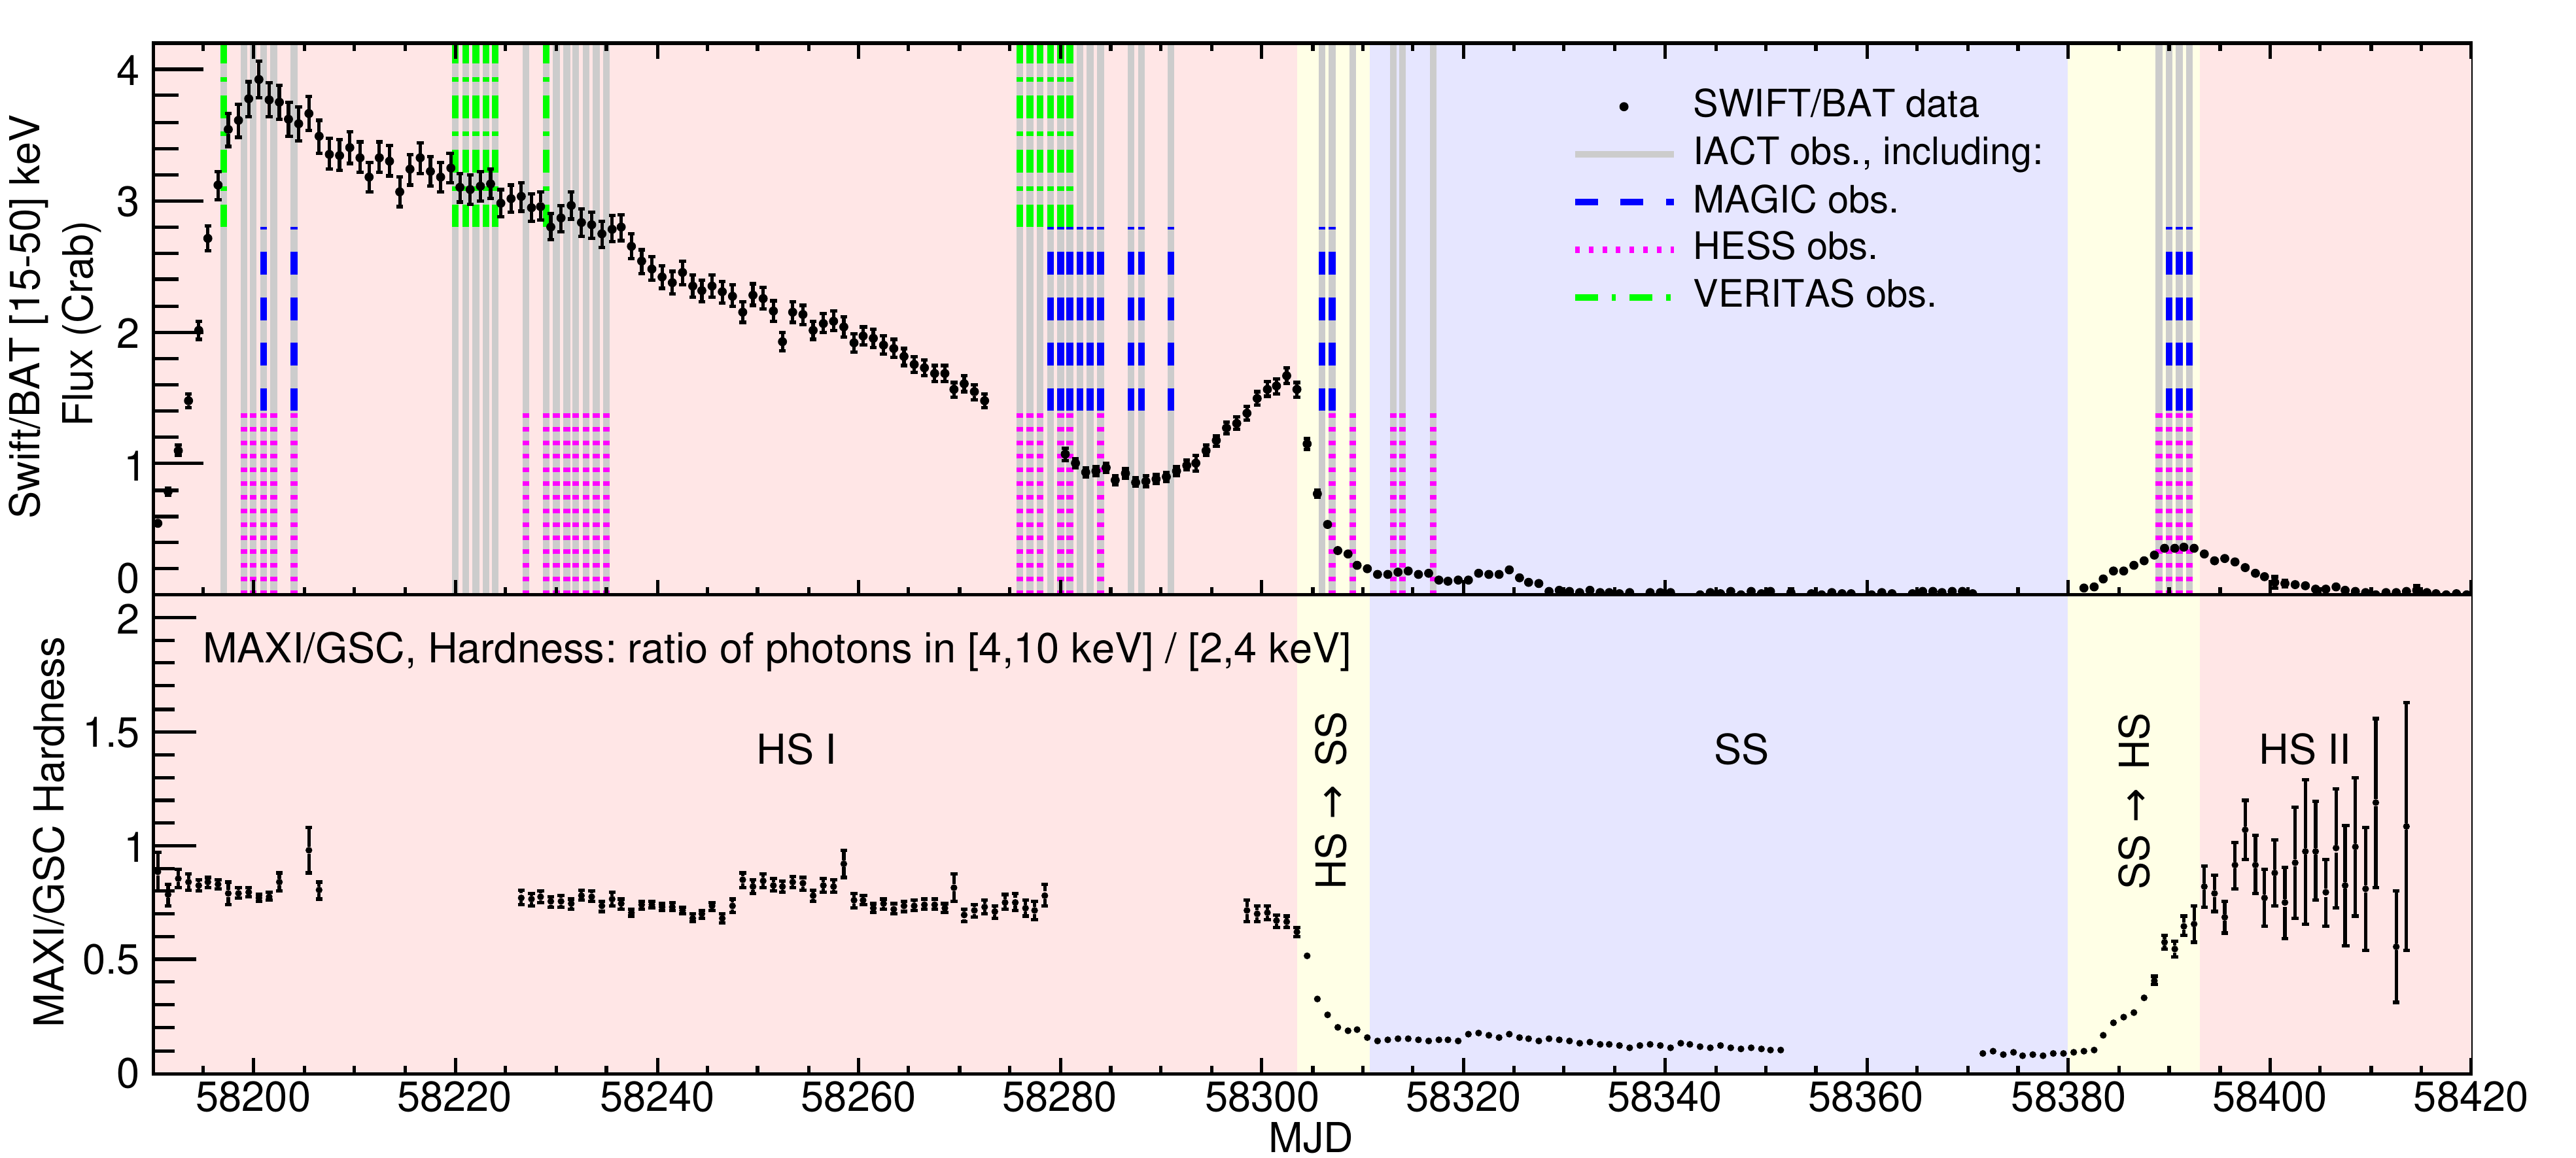
Figure 1: Top panel: X-ray flux in the 15–50 keV band as seen by Swift/BAT, with the VHE observation dates superimposed as vertical lines with different styles for each collaboration. Only the days with data after quality cuts are shown. Bottom panel: Evolution of the MAXI J1820+070 hardness ratio of the 4–10 to 2–4 keV fluxes as seen by MAXI/GSC. The source states are superimposed as light red (HS), light blue (SS) and light yellow (HS–SS / SS–HS) background colours.
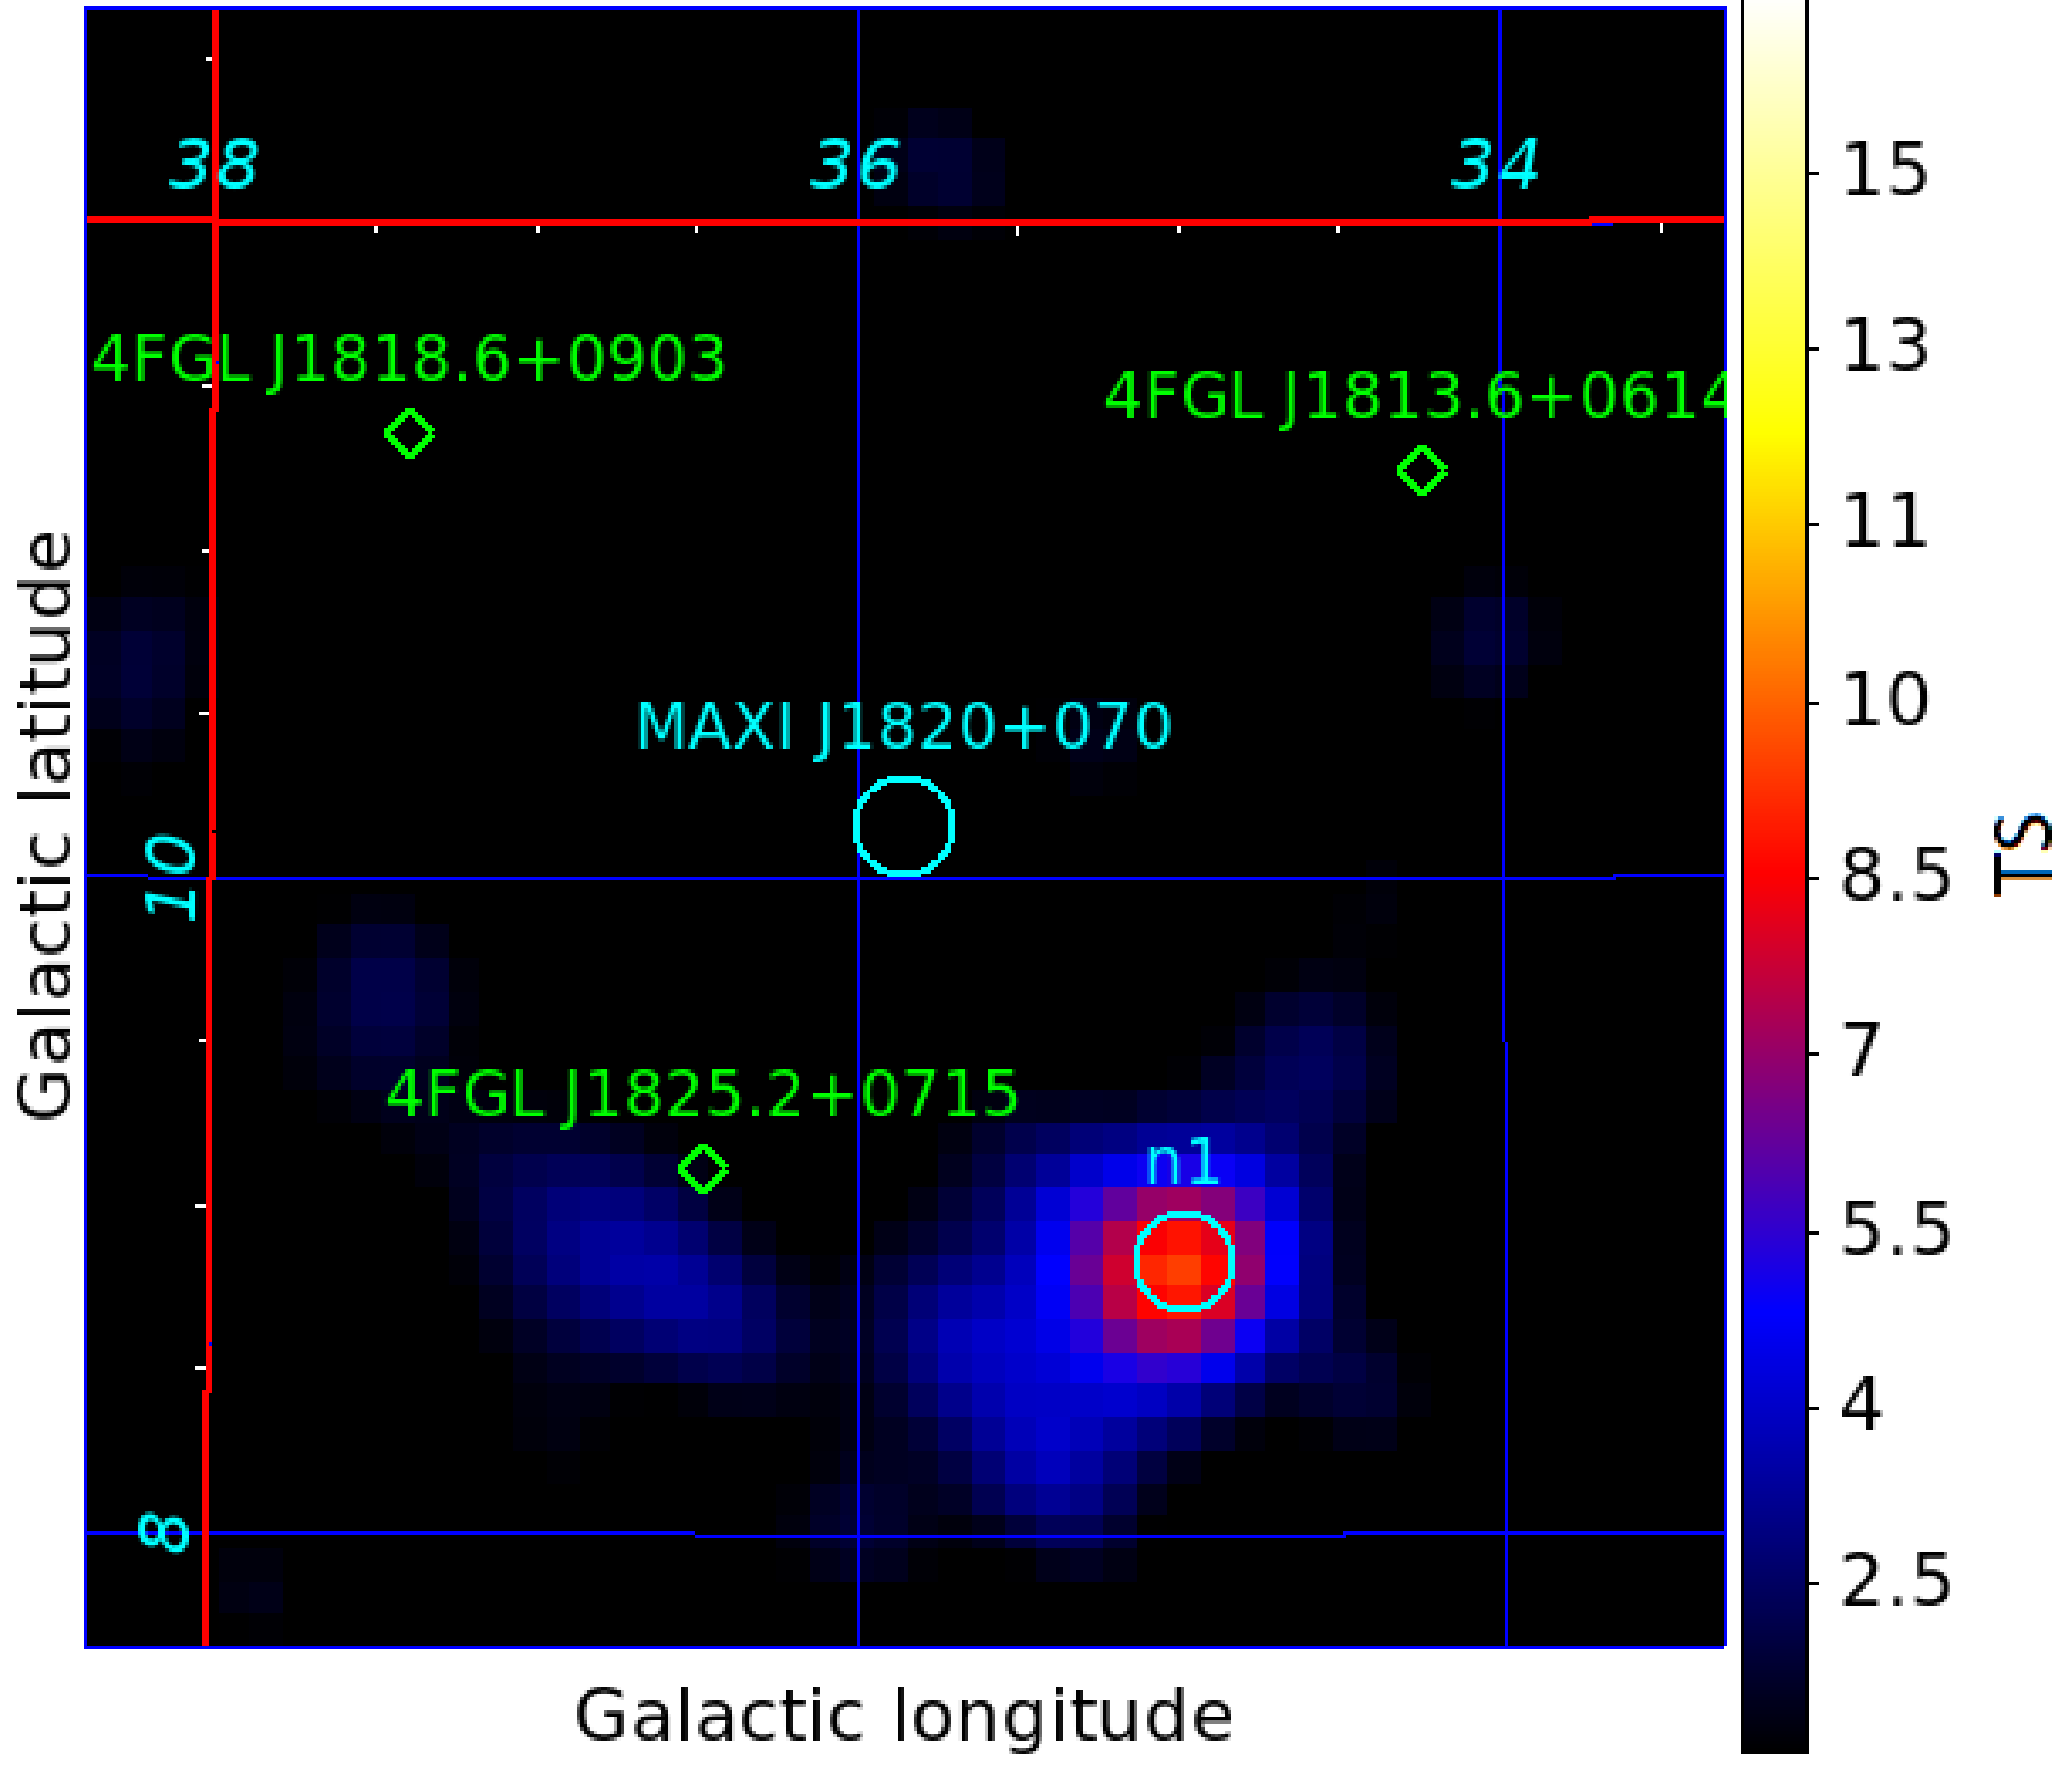
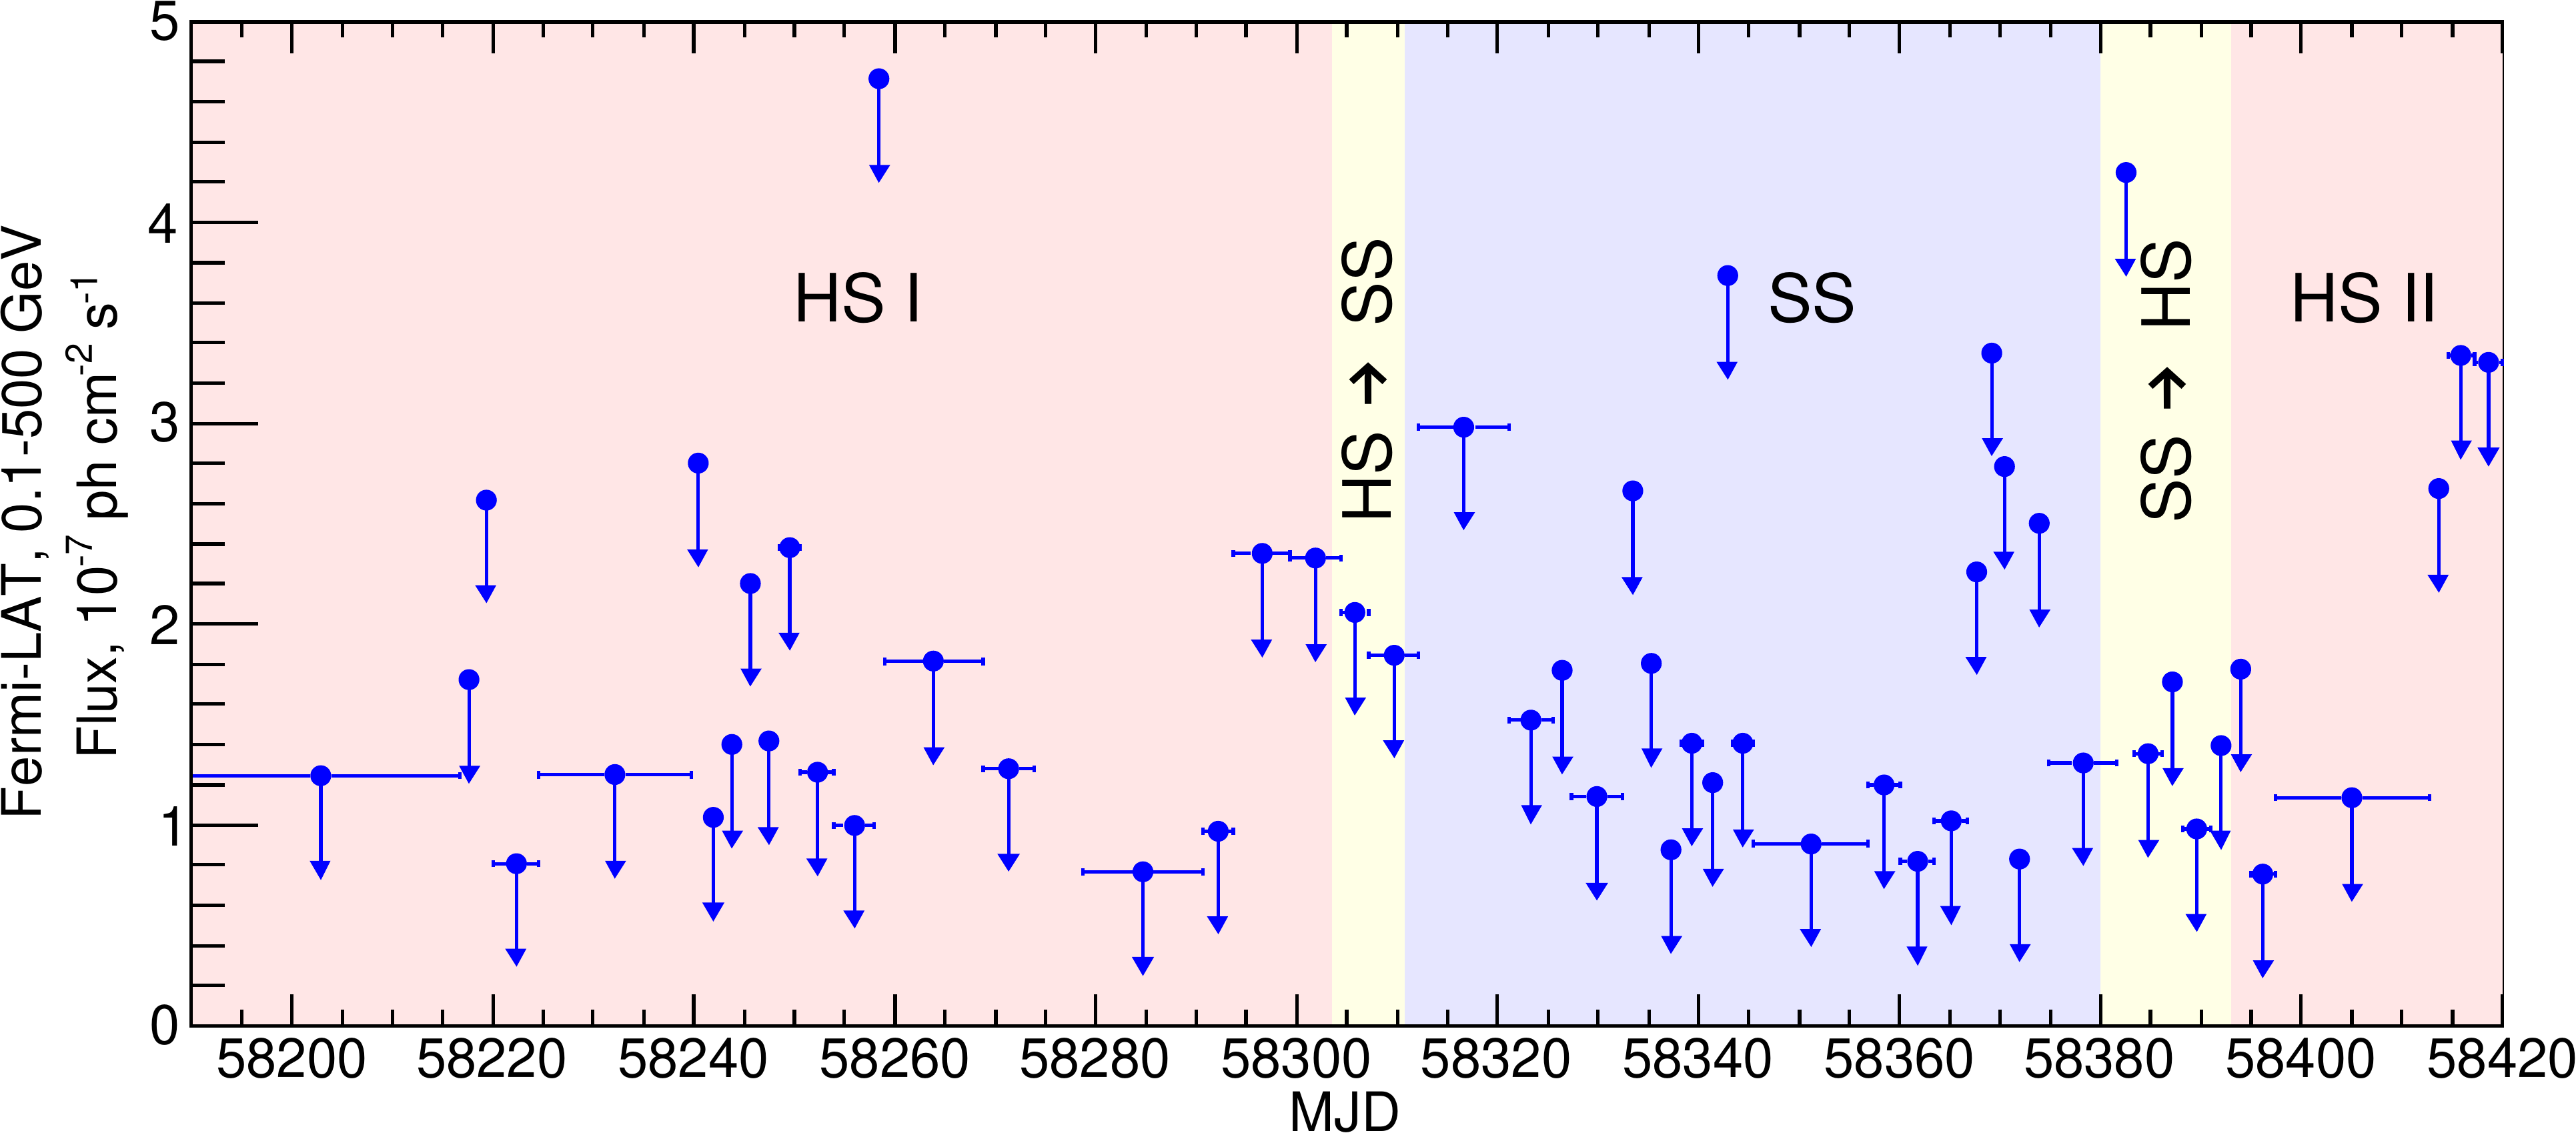
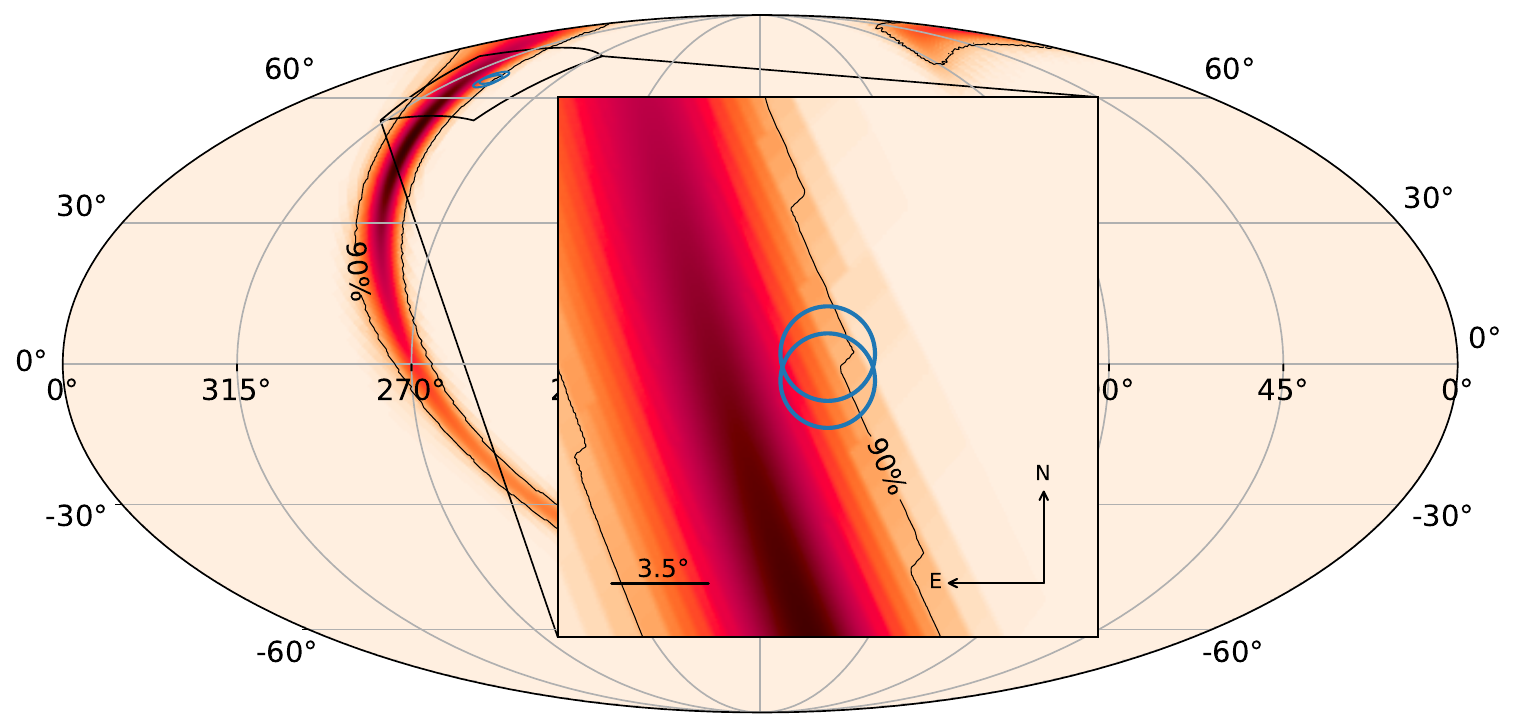
Figure 2: Left panel: Test-statistics map in Galactic coordinates of a 5◦ × 5◦ region around MAXI J1820+070 (cyan circle at the centre) in the 0.1 − 500 GeV energy range, with a 0.1◦ pixel size. Green symbols show the 4FGL Fermi-LAT sources present in the region. The cyan circle marked as n1 shows a TS ∼ 10 point-like residual positionally coincident with PSR J1823+0550. Right panel: Fermi-LAT light curve of MAXI J1820+070 in the 0.1 − 500 GeV energy band with an adaptive time binning. The bin widths correspond to 16 photons arrived in a 1◦-radius around MAXI J1820+070. Source states are represented with light red (HS), light blue (SS) and light yellow (HS–SS / SS–HS) background colours.
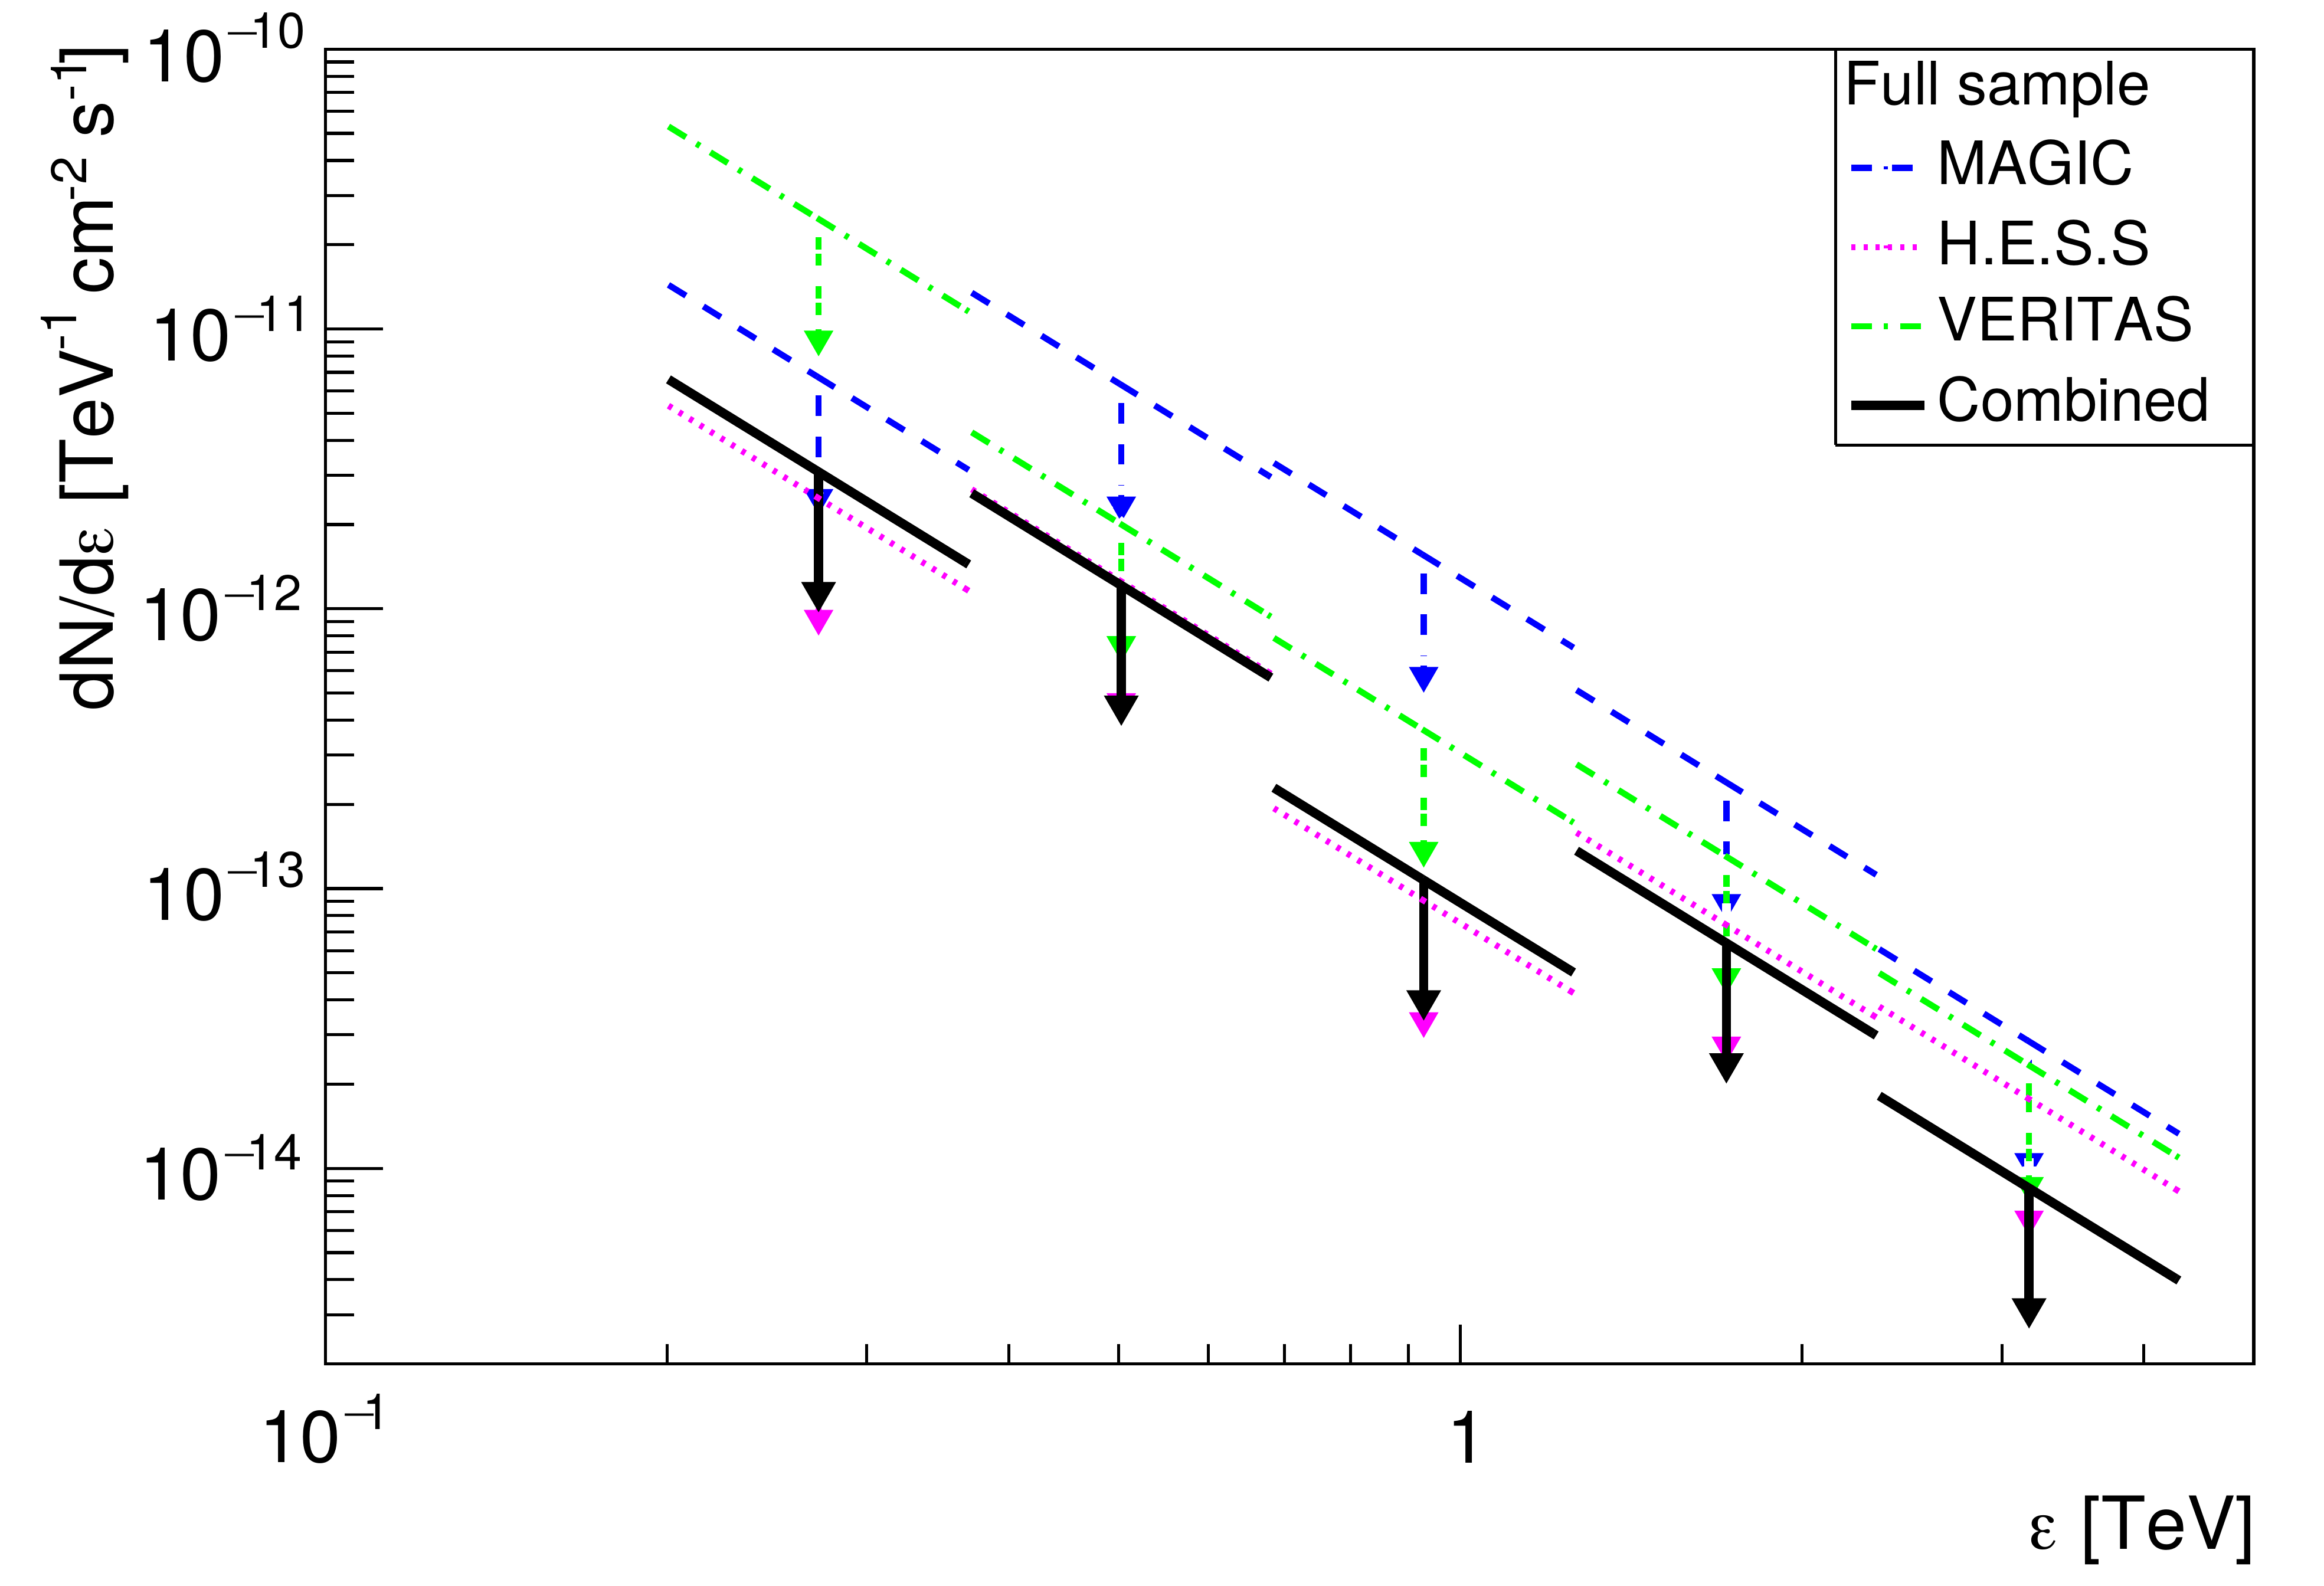
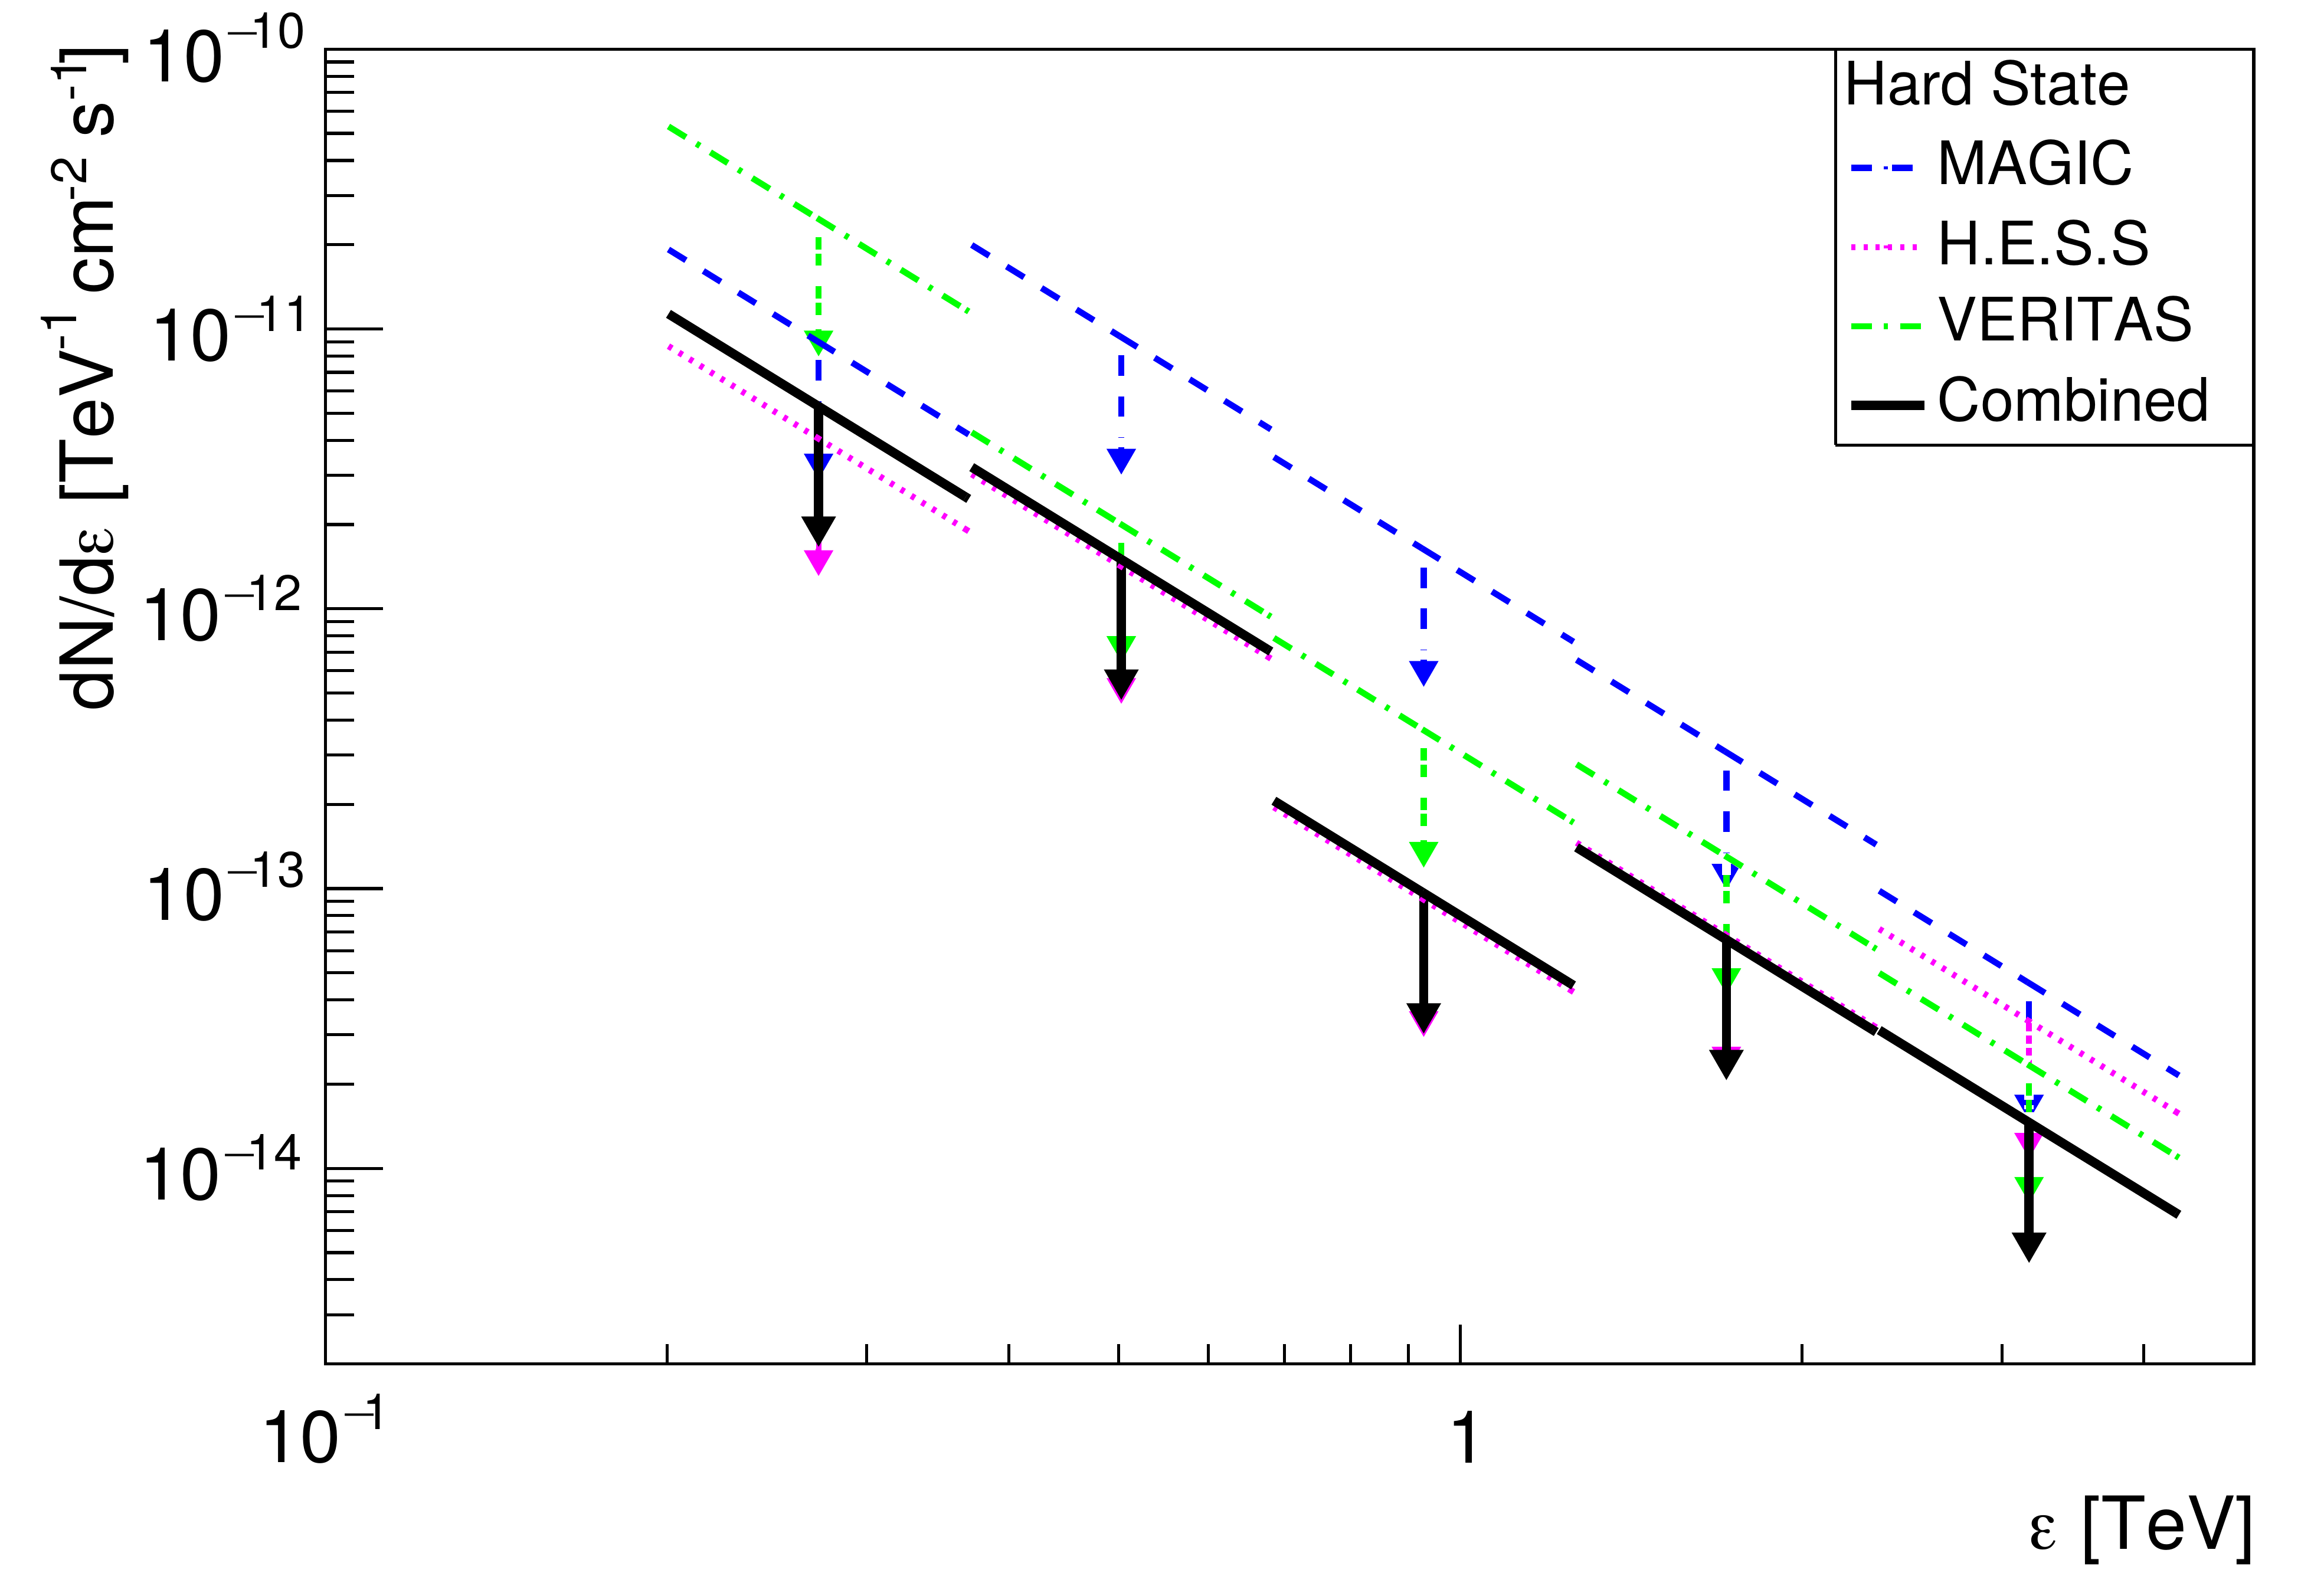
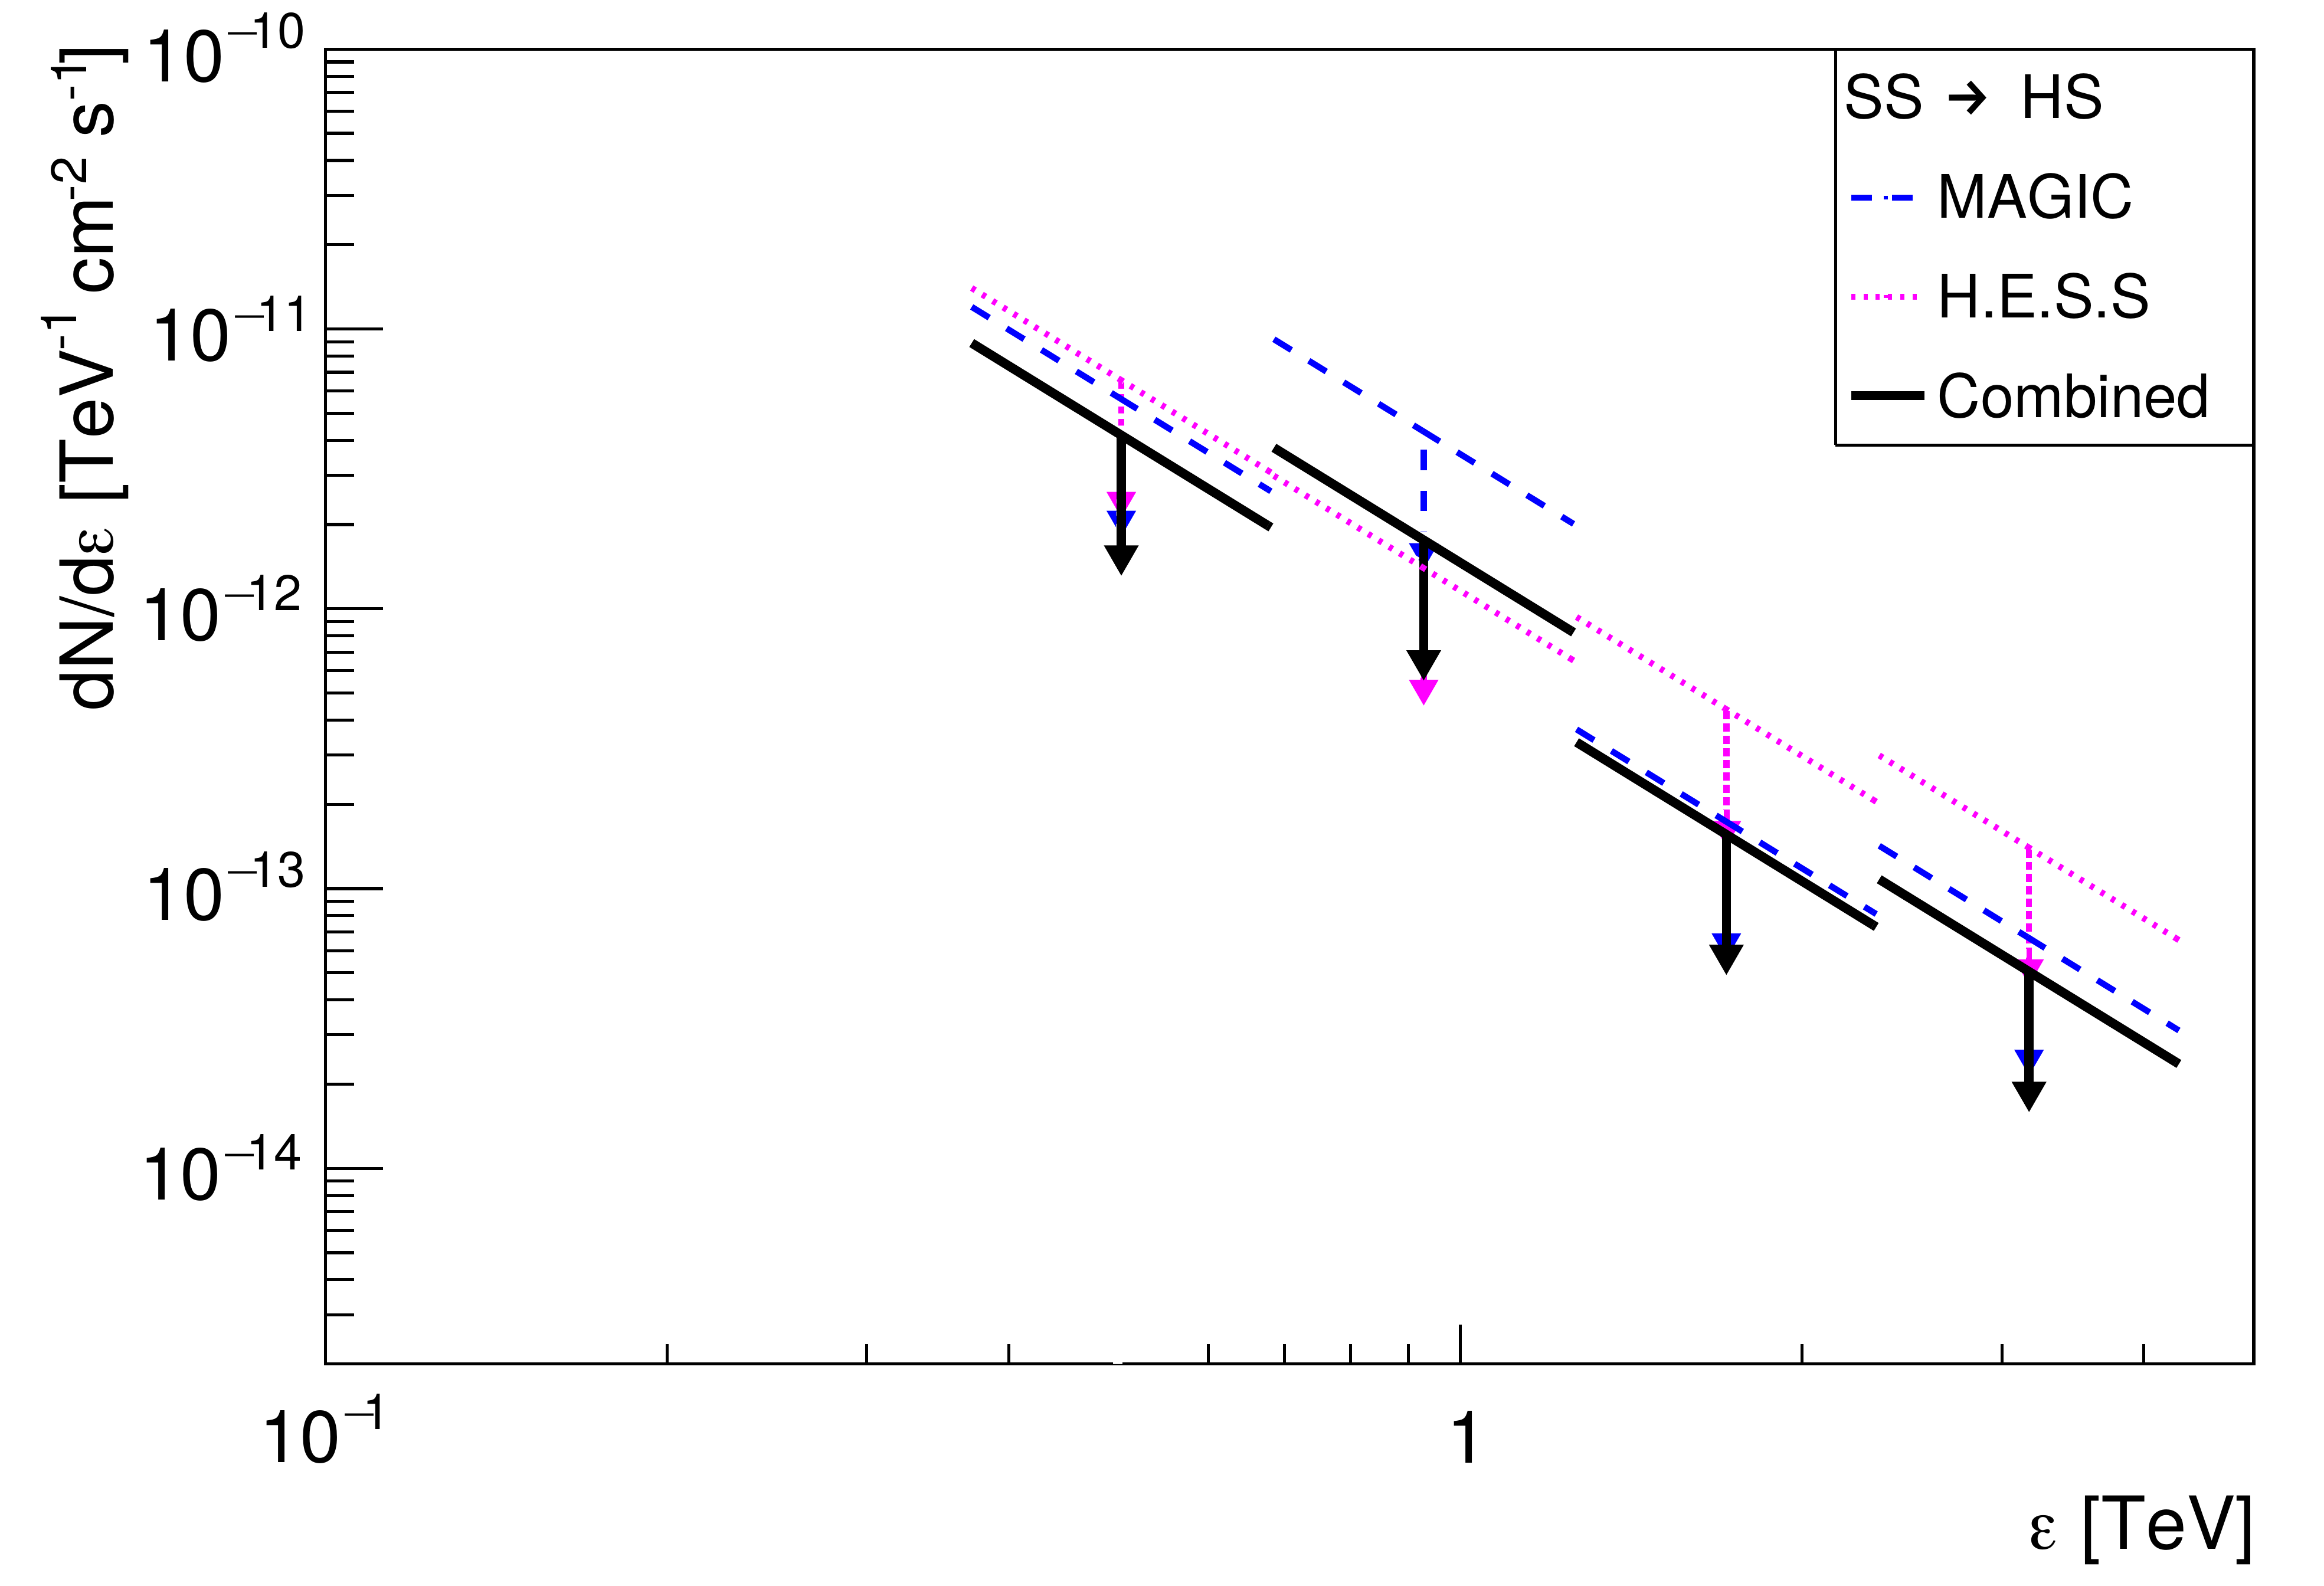
Figure 3: Differential flux upper limits of MAXI J1820+070 for different energy bins and source states (indicated in the legend). Coloured markers represent the results for the individual experiments, while black lines show the combined upper limits.
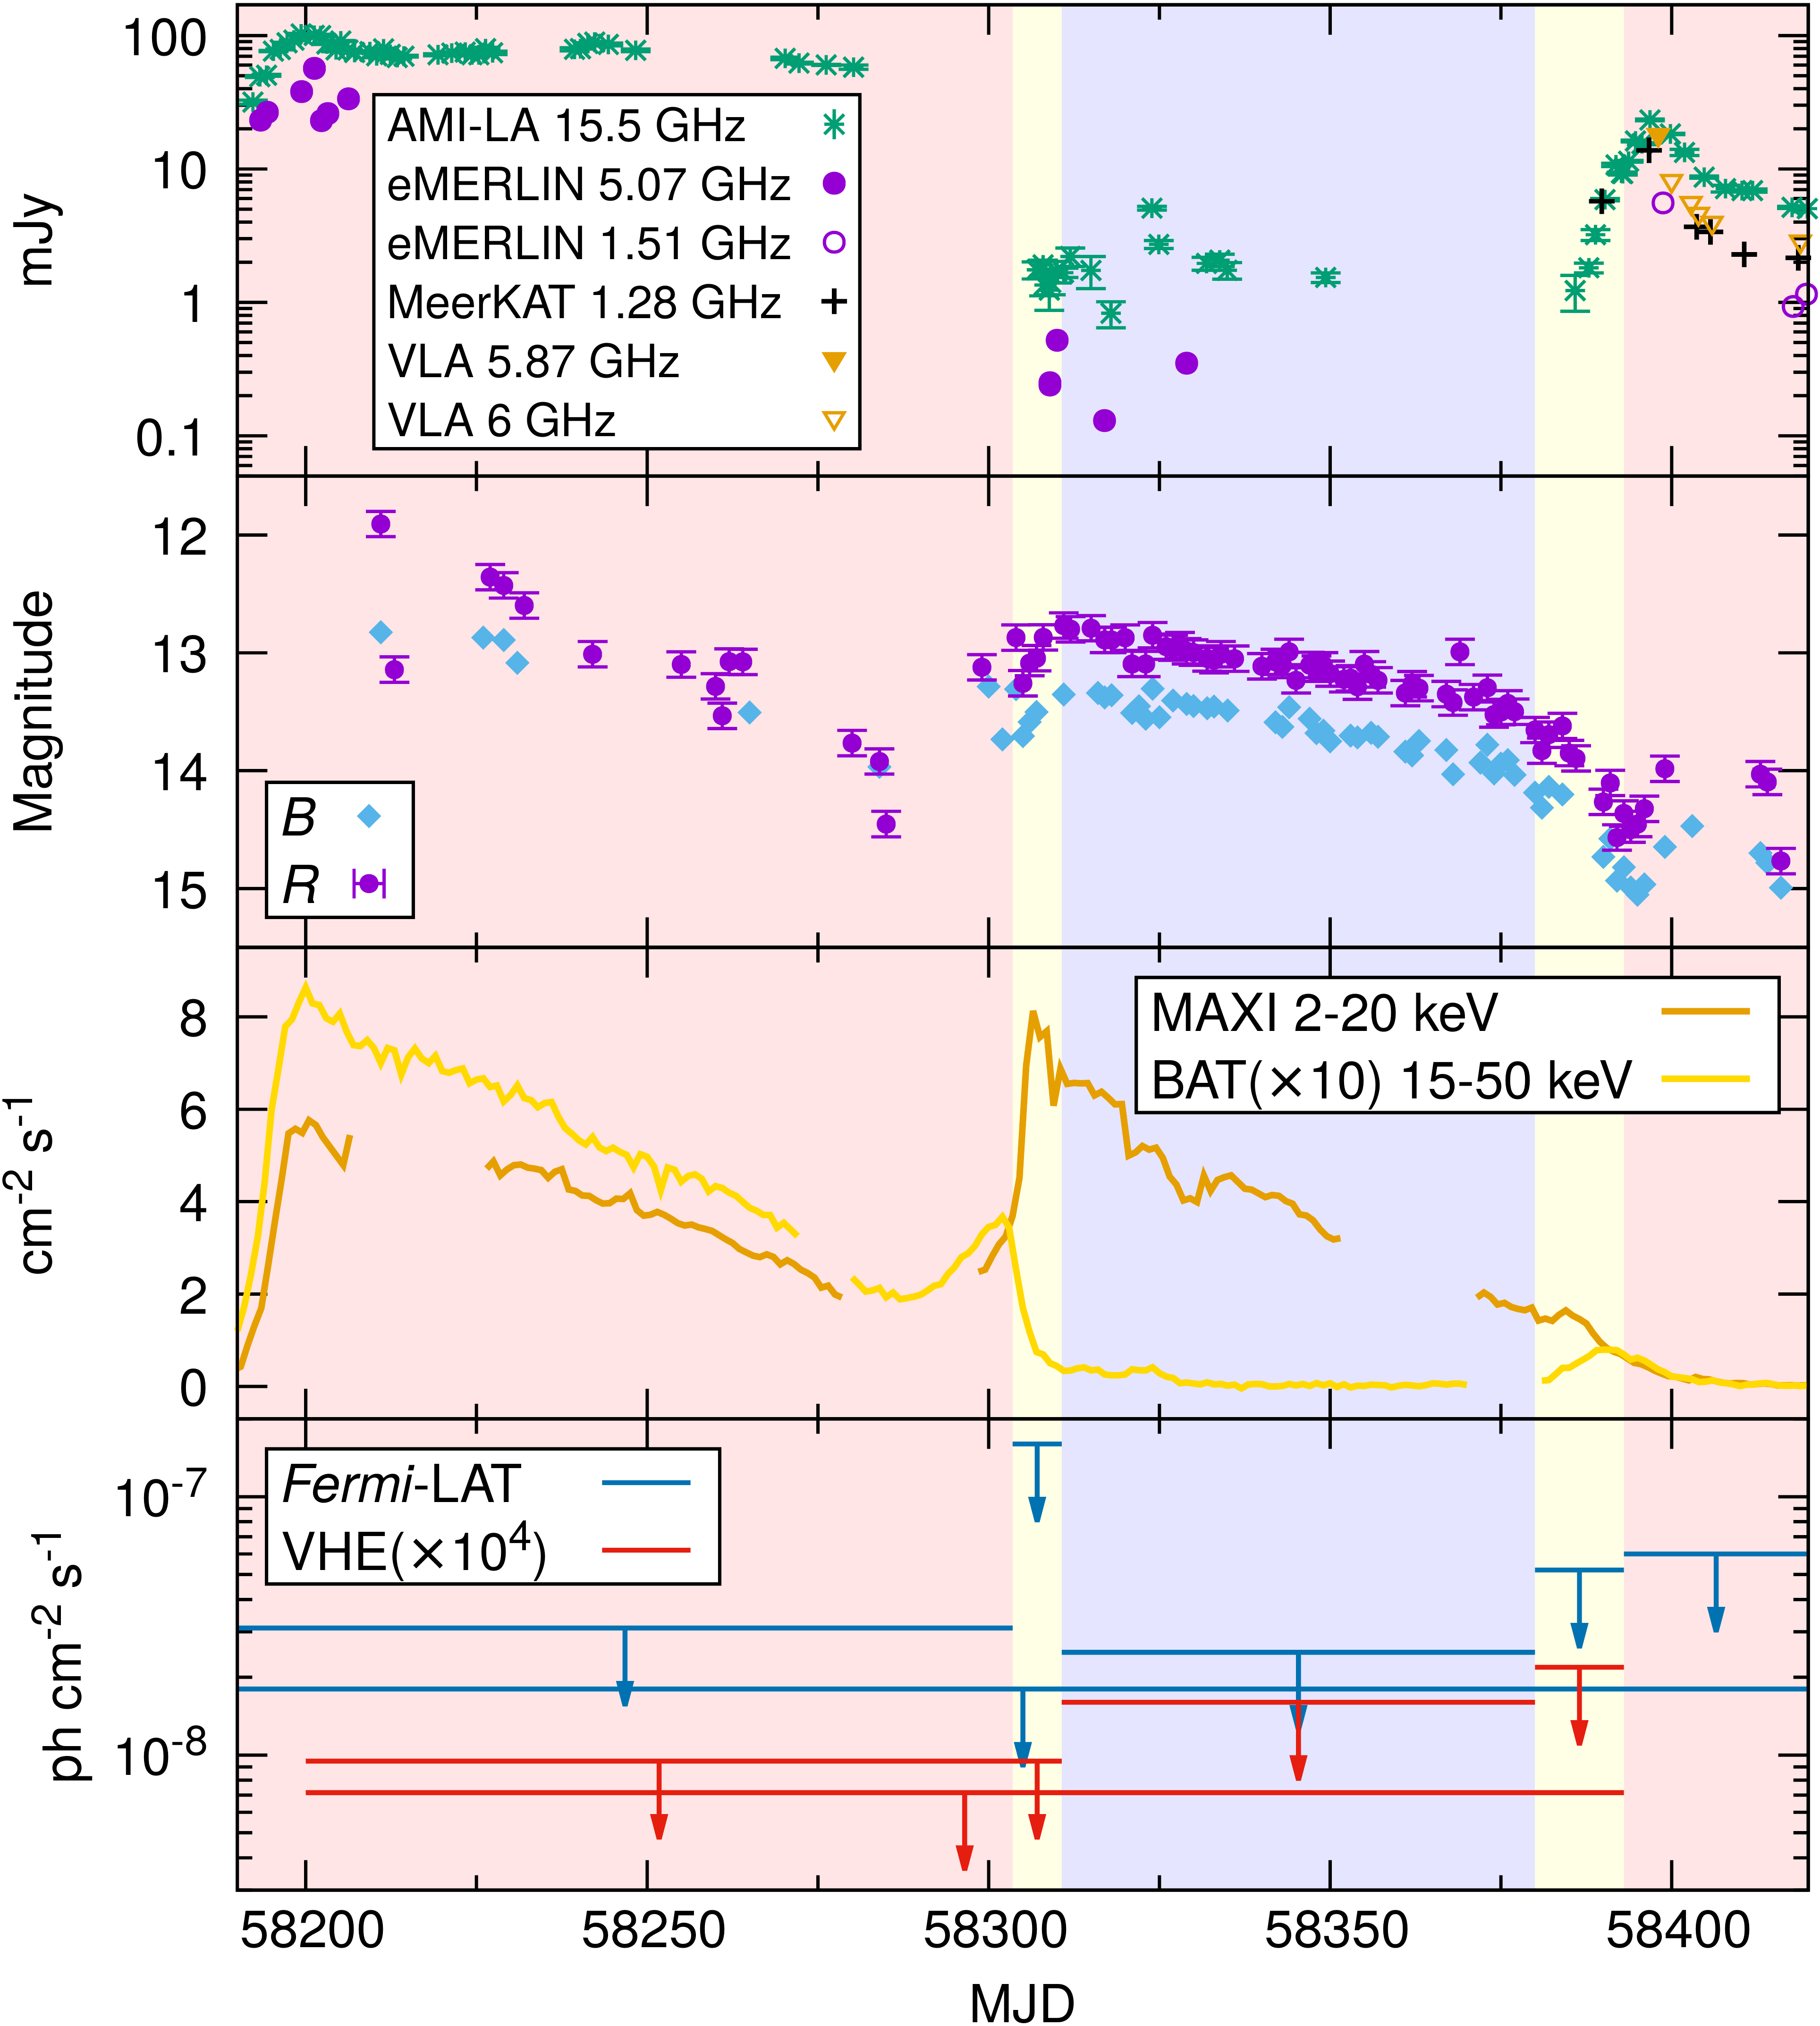
Figure 4: From top to bottom: Radio, optical, X-ray, and gamma-ray light curves of MAXI J1820+070 during its 2018 outburst (MJD 58189.0 – 58420.0). The shaded areas correspond to the HS (light red), the HS–SS and SS–HS transitions (light yellow), and the SS (light blue). The units of the third panel are [ph cm−2 s−1 ] for MAXI/GSC, and [counts cm−2 s−1 ] for Swift/BAT. The latter fluxes are multiplied by 10 for a better visualisation. The bottom panel shows the Fermi-LAT ULs above 100 MeV, and the H.E.S.S./MAGIC/VERITAS combined ULs (multiplied by 104) for each source state and transition for which data are available, as well as for the whole outburst. The VHE ULs are computed above 200 GeV except for the SS–HS transition (MJD 58380.0 – 58393.0) for which 300 GeV ULs are shown.
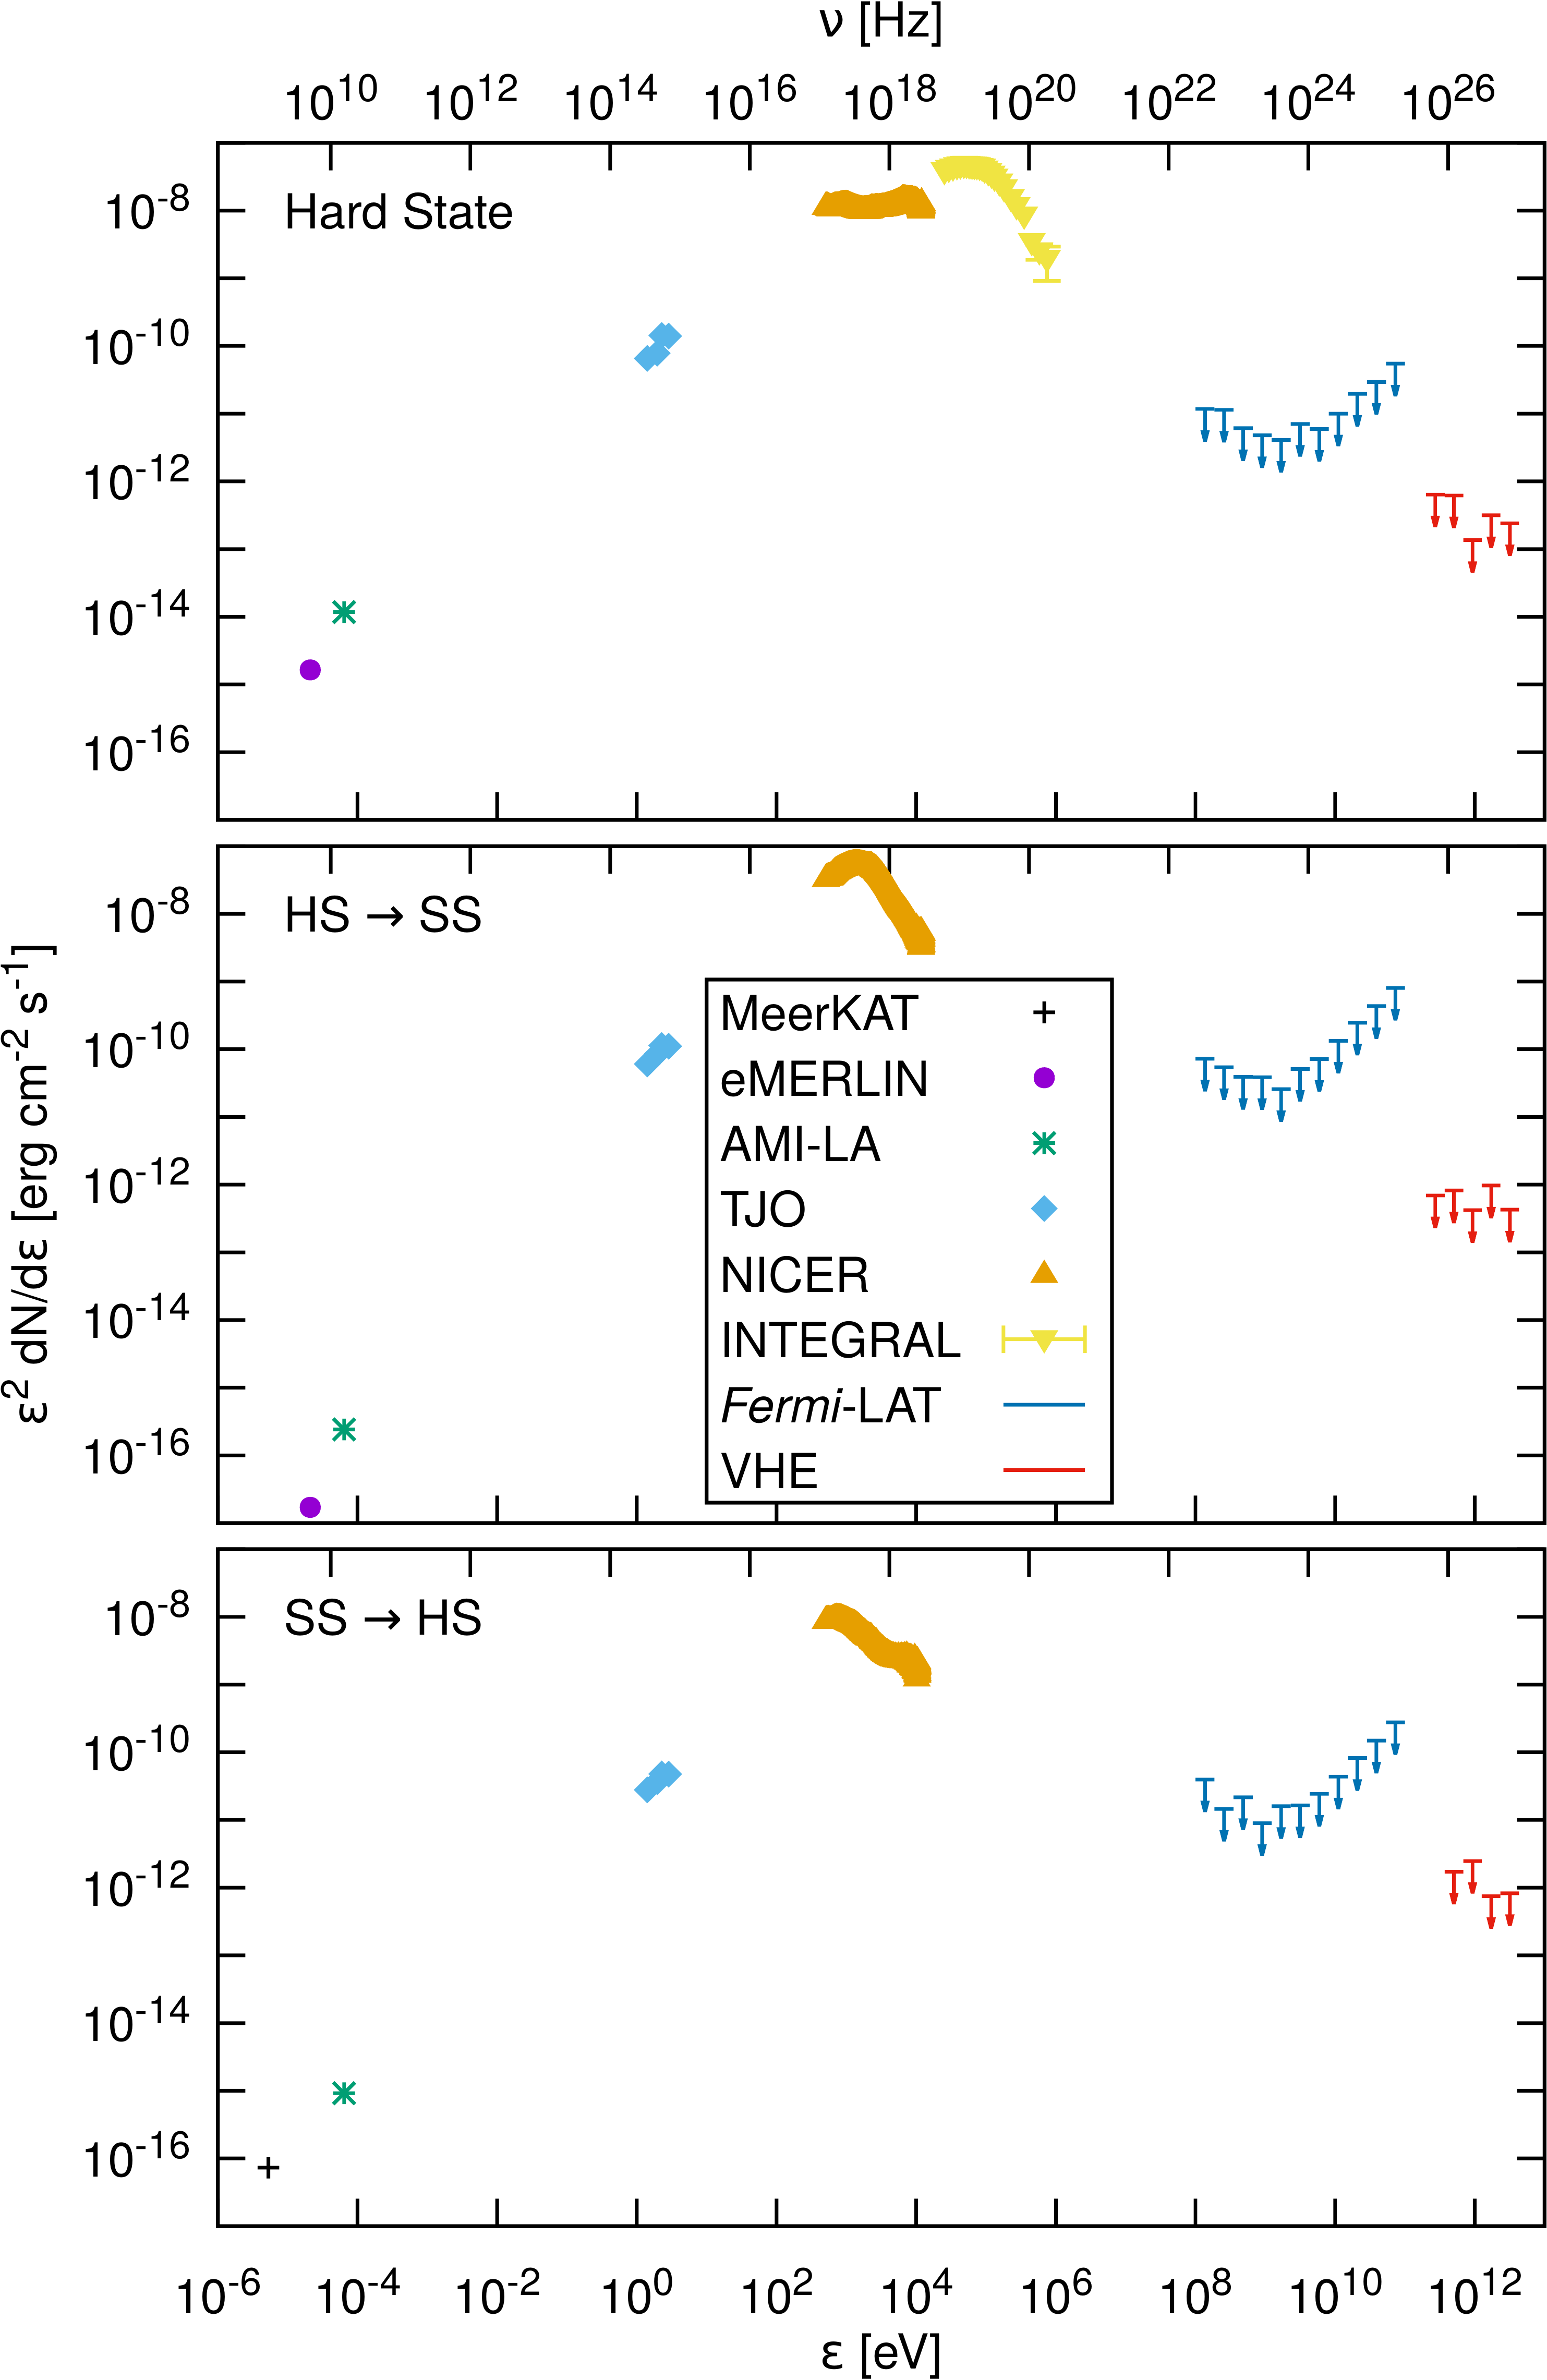
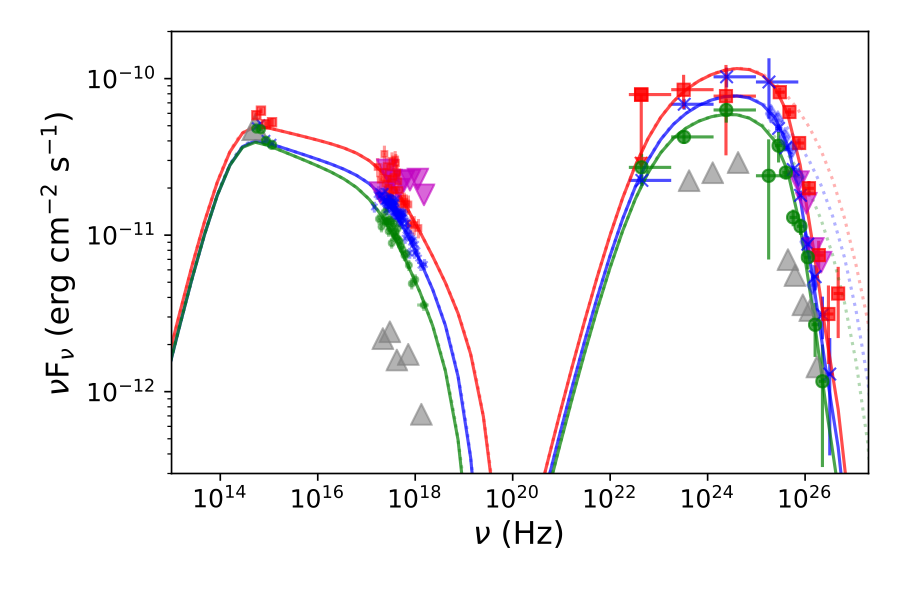
Figure 5: From top to bottom: Spectral energy distributions of MAXI J1820+070 averaged over the HS, the HS–SS transition, and the SS– HS transition. Fermi-LAT points include the contribution from the two HSs of the source. The eMERLIN data shown are those at 5.07 GHz. MeerKAT data are used in the bottom panel instead of eMERLINs.


