Reference: A.U. Abeysekara et al. (The VERITAS Collaboration), ApJ Letters 861, L20 (2018)
Full text version
ArXiv: arXiv:1807.04607
Contacts: Marcos Santander, David Williams
See also: Paper on follow-up observations to IceCube neutrino event IC-170922A
On September 22, 2017, the IceCube neutrino observatory announced the detection of the high-energy neutrino IC 170922A, of potential astrophysical origin. The neutrino direction was consistent with the location of the gamma-ray blazar TXS 0506+056, which was in an elevated gamma-ray emission state as measured by Fermi-LAT. Follow-up observations of the blazar led to its first detection in VHE gamma-rays by the MAGIC telescopes. The significance of the correlation between the neutrino and the flaring blazar is at the 3 sigma level, providing first evidence for the existence of an astrophysical source of high-energy neutrinos. Details of the neutrino detection and the multi-wavelength follow-up campaign (including an initial non-detection by VERITAS) are presented in the IceCube paper linked above.
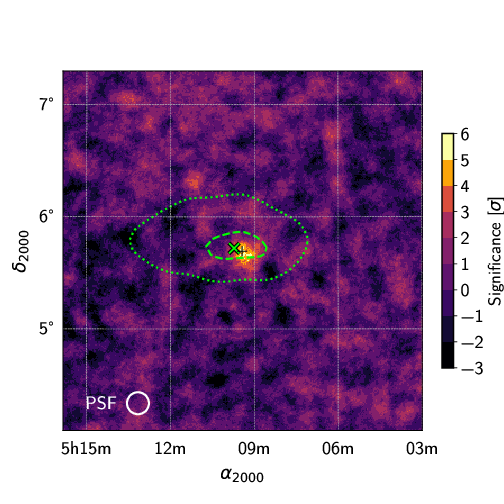
The potential association with an astrophysical neutrino event has made TXS 0506+056 a source of particular interest, and extended VERITAS observations were collected between September 2017 and February 2018 to characterize its high-energy emission. In this work we present results from the analysis of 35 hours of VERITAS data collected during this period, which resulted in the VHE detection of the blazar at a statistical significance of 5.8 sigma.
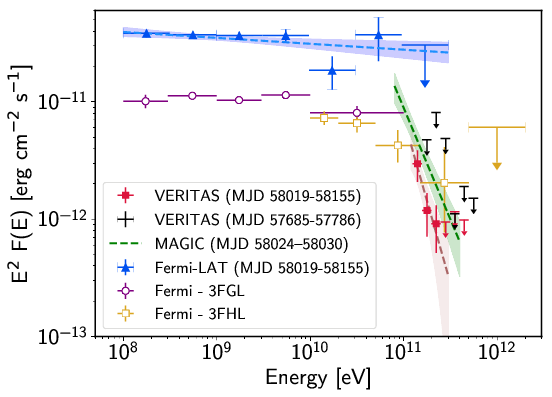
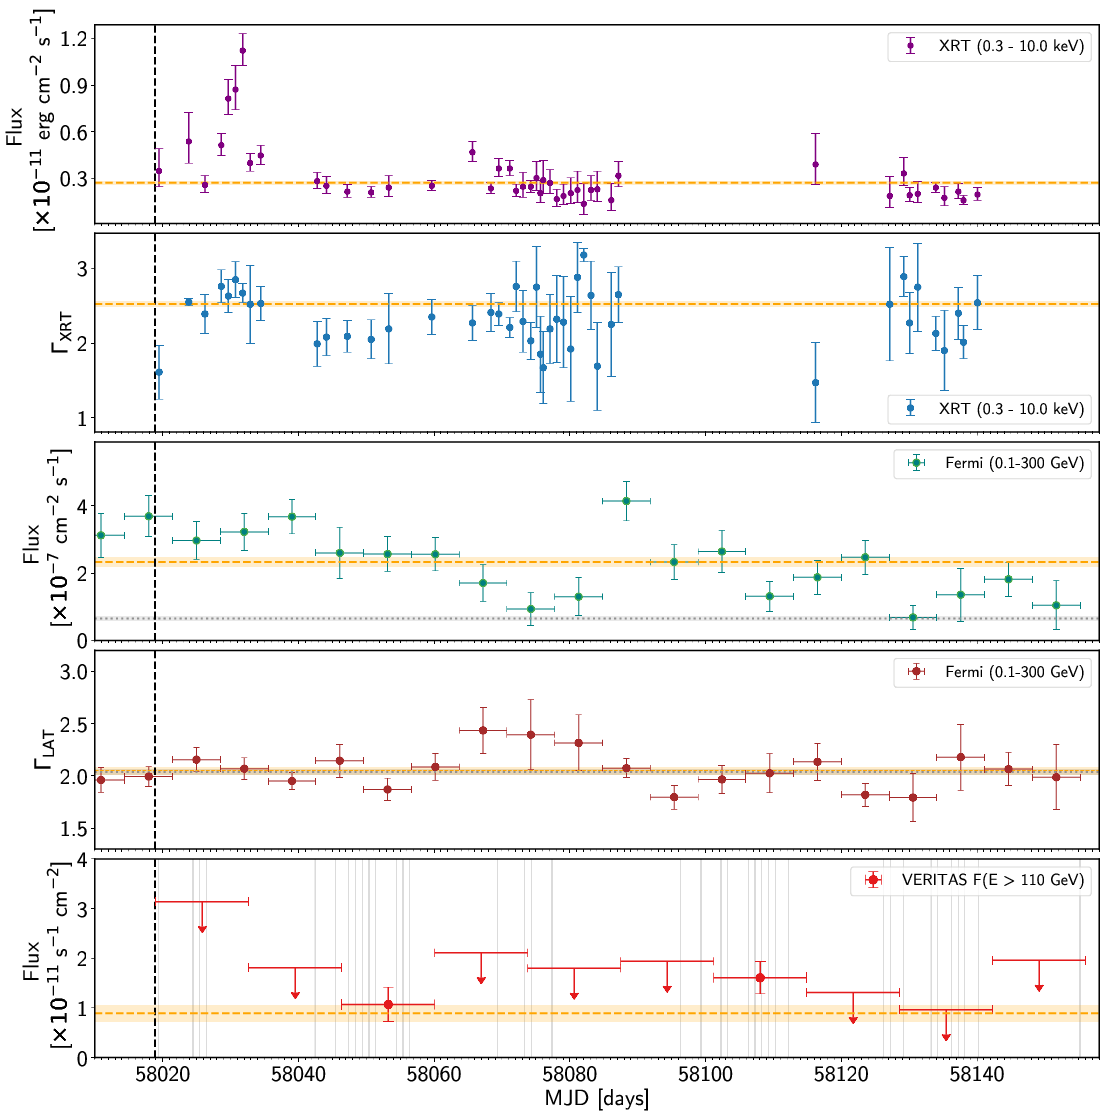
The average integral photon flux during this period was (8.9 ± 1.6)×10-12 cm-2 s-1 above an energy threshold of 110 GeV, which corresponds to 1.6% of the Crab Nebula flux above the same energy threshold. The VHE photon spectrum measured by VERITAS is well characterized by a power-law, with a soft spectral index of 4.8 ± 1.3. The VHE integral flux observed by VERITAS is consistent with a constant in time, at a comparable level as the source flux reported in the Fermi-LAT 3FHL catalog in a similar energy range. The analysis of Fermi-LAT data in the GeV range indicates that the integral photon flux was variable during the period of VERITAS observations, with a steady photon index consistent with catalogued values. Swift XRT observations indicate variability in both photon index and integral flux, but no temporal correlation is evident between the X-ray, GeV, and VHE energy ranges.
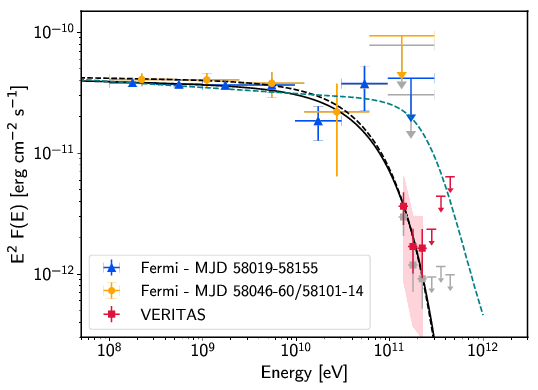
The study of the gamma-ray SED of TXS 0506+056 shows an exponential cutoff in the photon spectrum between the Fermi and VERITAS energy ranges, which cannot be explained as being caused by EBL absorption alone. This has important implications, since the emission of >100 TeV neutrino such as IC 170922A is expected to be accompanied by hadronic gamma rays in a similar energy range. The spectral softening requires either a break in the parent particle population or intrinsic absorption of the potential hadronic VHE emission at the source in order to explain these observations.
The detection of TXS 0506+056 representes the first time that neutrino follow-up observations have revealed a new VHE source. Future observations could clarify if blazars are indeed the sources of astrophysical neutrinos
detected by IceCube.
FITS files: VERITAS significance map (Figure 1)
Figures from paper (click to get full size image):
location (from IceCube Collaboration et al. (2018)).
the model of Franceschini et al. (2008). The pink band in the VHE range illustrates the energy-scale systematic uncertainty on the VERITAS spectrum.


