HESS J1943+213 is an enigmatic Υ-ray point source in the direction of the Galactic Plane. We use the strong detection of the source with VERITAS observations in conjunction with multi-wavelength observations from VLBA, Fermi-LAT, Swift-XRT, and FLWO 48" optical telescope to solidify the classification of the source as an extreme HBL (a fairly rare type of blazar) and explore its properties across the electromagnetic spectrum. We find an extended, jet-like structure in multi-frequency VLBA observations of the HESS J1943+213 radio counterpart. We do not detect proper motion above 0.1 milliarcsec over a course of a year, supporting an extragalactic origin for the source. In addition, the radio spectral indices of the core and the jet and the level of polarization are in a range typical for blazars.
We perform flux and spectral variability searches and find no significant variability in any of the investigated bands. HESS J1943+213 appears to be one of the most stable blazars.
Data from VERITAS, Fermi-LAT, Swift-XRT, and the FLWO 48" telescope, and archival infrared and hard X-ray observations are used to construct the spectral energy distribution (SED) of the source. The well-measured Υ-ray peak of the SED with VERITAS and Fermi-LAT provides constraining upper limits on the source redshift, z < 0.23.
We model the HESS J1943+213 SED with a two-zone SSC model described by a homogenous, compact blob within a conical wider jet. The model is a two-flow representation in which there is a highly Doppler boosted inner jet region (blob) embedded in a wider, conical structure with a lower Lorentz factor (jet). The VLBA images are used to constrain the jet half-opening angle and jet basis length parameters.
The lack of rapid flux variability and the hard VHE spectra make extreme HBLs attractive candidates for hadronic emission models. We test for possible contribution of secondary ?-rays from ultra-high-energy cosmic ray-initiated electromagnetic cascades to the ?-ray emission of HESS J1943+213, and find that only a segment of the VHE spectrum can be accommodated with this process.
Figure 1: Time-averaged VERITAS spectrum of HESS J1943+213, combining data from 2014 and 2015 observations. The band shows the 99% con fidence interval of a power-law fi t to the spectrum.
Figure 2: VERITAS light curve of HESS J1943+213 above 230 GeV. The red dashed line is a fi t of a constant to the data. 68% upper limits are derived for time bins in which the source flux is consistent with zero.
Figure 3: Spectra of HESS J1943+213 with Swift-XRT for the three observations taken in 2014. The dashed lines show the absorbed power-law models used for unfolding the spectra. The inset fi gure shows the 2-10 keV fluxes for the three observations.
Figure 4: Light curves from FLWO 48" observations with Harris V (teal), SDSS r' (red) and SDSS i' (purple) filters. The spectral flux densities are given in arbitrary units (a.u.). The dashed lines show the average flux for each of the light curves.
Figure 5: Contour images of HESS J1943+213 with VLBA (a) 1.6 GHz, (b) 4.3 GHz, (c) 7.6 GHz, and (d) 15 GHz bands. Contour levels plotted above 1% of the peak image intensity: -1, 1, 2, 4, 8, 16, 32, 64 (1.6 GHz); -2, -1, 1, 2, 4, 8, 16, 32, 64 (4.3 GHz and 7.6 GHz); -8, 8, 16, 32, 64 (15 GHz). Negative levels are shown with dashed lines.
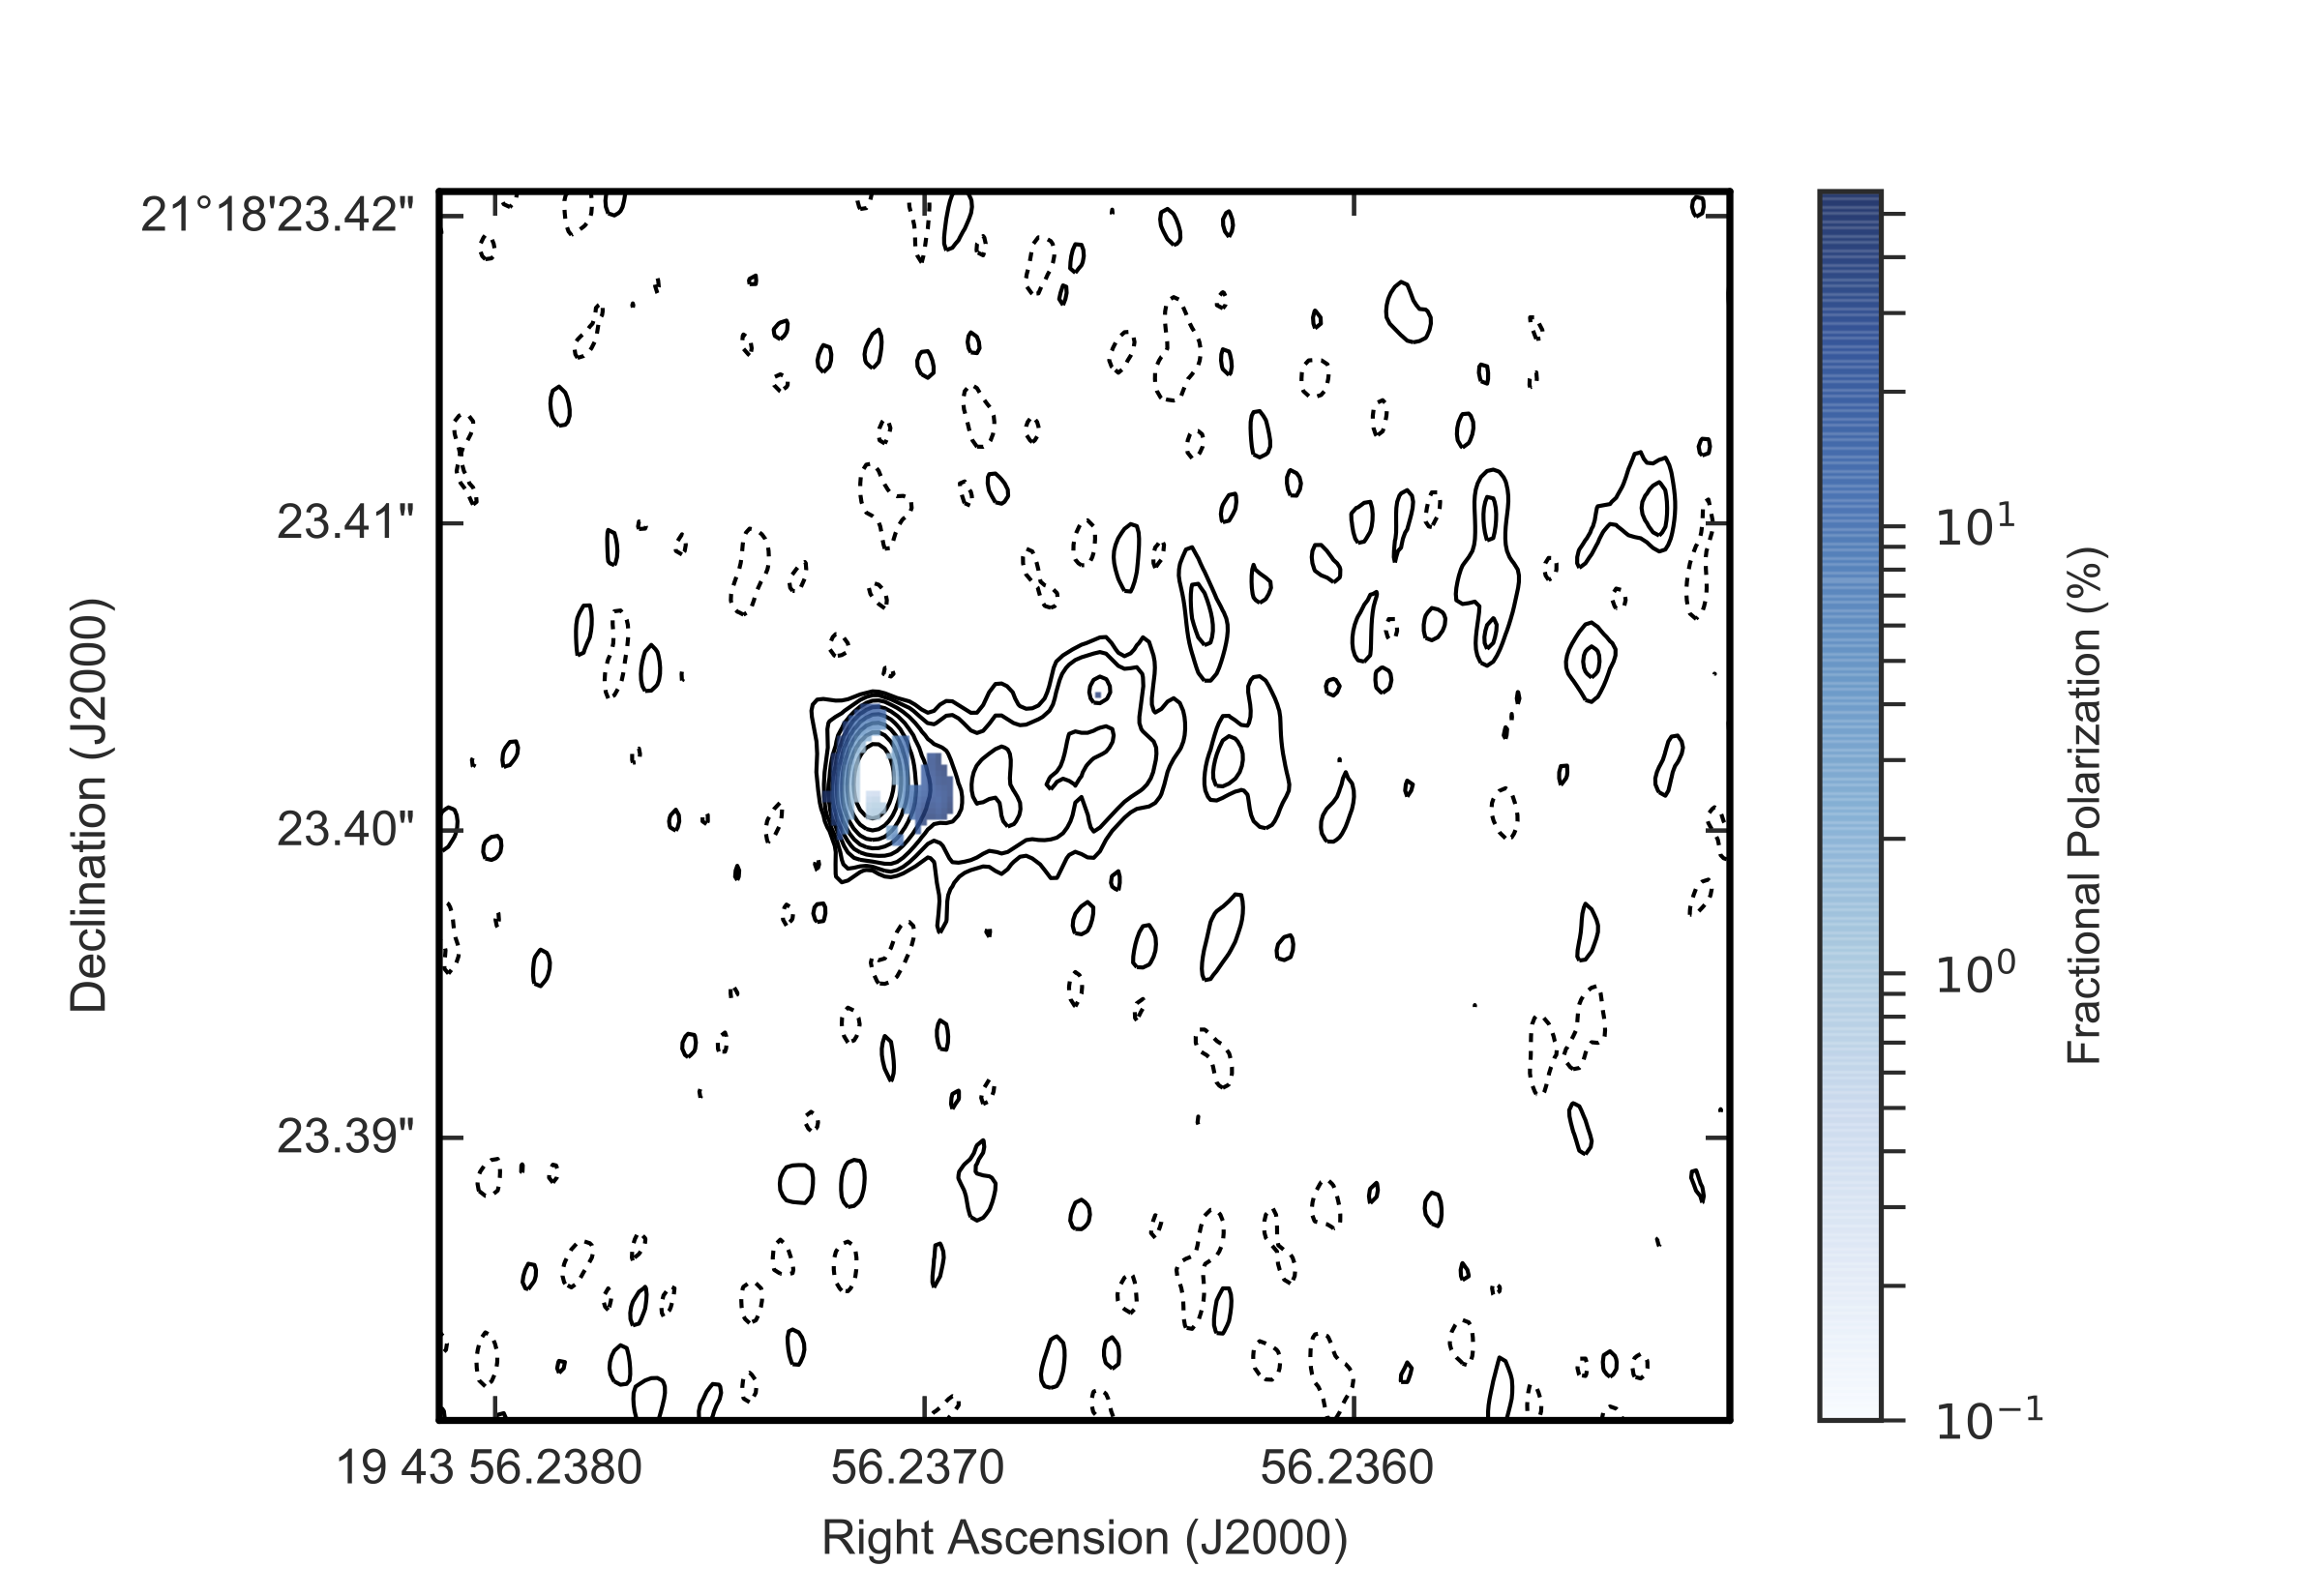
Figure 6: Epoch II VLBA 4.3 GHz (left) and 7.6 GHz (right) images of HESS J1943+213 radio counterpart. The contours represent the -1 (dashed), 1, 2, 4, 8, 16, 32, 64, 128 levels above 0.3% of the peak image intensity. The fractional polarization is illustrated with the color maps.
Figure 7: Spectral map of the core-jet structure of HESS J1943+213 radio counterpart made from epoch II VLBA 4.3 GHz and 7.6 GHz (degraded to 4.3 GHz resolution) band images, with contours for 4.3 GHz (red) and 7.6 GHz (blue) representing -1 (dotted), 1, 2, 4, 8, 16, 32, 64, 128 levels above 0.3% of the peak image intensity.
Figure 8: VERITAS observed spectrum (blue points) fit to upper bound of the Fermi-LAT spectrum absorbed by EBL for redshift values ranging from 0 to 0.6. The inset figure shows the χ2 distribution with redshift of the VERITAS spectrum fi t to the EBL-absorbed extrapolations of the Fermi-LAT upper bound. The gray-shaded areas show the 95% rejection regions.
Figure 9: SED of HESS J1943+213, including the SSC model with components for a blob of relativistic particles (solid light blue curves) and a larger jet (dash-dotted red curves). The model for the host galaxy emission is shown in solid red, while the brown curve gives the summed emission from all model components. The flux points include data from VLA 1.4 GHz, VLBA 1.6, 4.3, 7.6, 15 GHz, WISE, CAHA 3.5 m (Peter et al. 2014), FLWO 48", Swift-XRT and Swift-BAT, Fermi-LAT and VERITAS. The assumed source redshift is z = 0.16. The EBL model from Franceschini et al. (2008) is used to deabsorb the VERITAS points.

Figure 10: Predicted secondary Υ-ray spectra from cascades initiated by UHECRs shown in dashed lines. The legend specifi es the assumed distance and the UHECR power required to produce each spectrum. The solid black line shows the Fermi-LAT spectrum extrapolated to VHE energies and absorbed by the EBL using the model from Franceschini et al. (2008), assuming a source redshift of z = 0.16 (near the best-fi t redshift value from the redshift estimation procedure in Section 3.1). The dotted red line is the SSC model from Section 3.3.


