The Cygnus region is the brightest region of diffuse gamma-ray emission in the northern sky; rich in both potential sources of cosmic rays (including supernova remnants, pulsar wind nebulae and X-ray binaries) and interstellar gas, it provides a promising area to probe the origins and interactions of cosmic rays. We present results from deep observations toward the Cygnus region using 300 hr of very high energy (VHE) gamma-ray data taken with the VERITAS Cherenkov telescope array and over 7 yr of high-energy gamma-ray data taken with the Fermi satellite at an energy above 1 GeV.
This article addresses in detail the VHE gamma-ray sources in the region. We report the identification of a potential Fermi-LAT counterpart to VER J2031+ 415 (TeV J2032+4130) and resolve the extended VHE source VER J2019+ 368 into two source candidates (VER J2018+ 367* and VER J2020+ 368*) and characterize their energy spectra. We explore the Fermi-LAT morphology of 3FGL J2021.0+4031e (the Gamma Cygni supernova remnant), and a region of enhanced emission coincident with VER J2019+ 407 is identified and jointly fit with the VERITAS data. By modeling 3FGL J2015.6+ 3709 as two sources, one located at the location of the pulsar wind nebula CTB 87 and one at the quasar QSO J2015+ 371, a continuous spectrum from 1 GeV to 10 TeV was extracted for VER J2016+ 371 (CTB 87).
In addition, 71 locations coincident with Fermi-LAT sources and other potential objects of interest are tested for VHE gamma-ray emission. No emission was detected from these regions and upper limits on the differential flux are placed at an average of 2.3% of the Crab Nebula flux. We interpret these observations in a multiwavelength context and present the most detailed gamma-ray view of the region to date.
Figure 1: The VERITAS exposure map of the observations used in this analysis, in Galactic (longitude, l , and latitude, b) and equatorial (right ascension, αJ2000, and declination, δ J2000) coordinates, solid and dashed lines respectively. The color scale represents the acceptance-corrected live time in hours. The bright regions correspond to the primary targets within the region, MGRO J2019+37, TeV J2032+4130 and the Gamma-Cygni supernova remnant.
Figure 2: Significance sky maps above 400 GeV of the entire region using the Point (0.1o) (left) and Extended (0.23o) (right) integration radii. Significances were calculated using Equation 17 of Li & Ma (1983) and the ring background method. Areas around known sources and bright stars were excluded from background regions. Overlaid are the 1 σ ellipses for the source extension fits with an asymmetric Gaussian function for the three extended sources (VER J2019+407, VER J2031+415, VER J2019+368) and the position for VER J2016+371 (cross).


Figure 3: Histograms of the significances of the bins in VERITAS sky maps (Figure 2). Blue includes all the bins, orange all the bins that are not excluded due to their proximity to a source or a bright star, and black is a normal distribution (with mean = 0 and standard deviation = 1.0). The mean and standard deviation indicated for each figure correspond to the orange histogram. Left: point integration region (0.1o radius, mean=0.03, standard deviation =1.00); right: extended integration region (0.23o radius, mean=0.03, standard deviation = 1.18).
Figure 4: Histograms of mean significances calculated from 71 random locations outside the source exclusion regions in the significance sky map repeated 50,000 times for both the Point (left) and Extended (center) integration regions. The blue line shows the results of the test; the black dashed line is the best fit Gaussian distribution. The mean and the one, two, and three standard deviations of the distribution are shown in orange. Note that the mean significance is slightly less than zero in both instances, reflecting the fact that the locations of bright stars have not been excluded from the possible locations of the randomly drawn locations. The mean of the significance of the upper limit locations is marked by the green line and in both cases is clearly offset from the mean, corresponding to a 2.9 and 1.7 fluctuations for the Point and Extended integration regions respectively.


Figure 5: Map of the 95% upper limits on the differential flux at 1000 GeV using the Point (0.1o, left) and Extended (0.23o, right) integration radii. Upper limits were calculated using the method of Rolke (Rolke et al. 2005) at the 95% level and with an assumed spectral index of -2.5 and using the ring background method. Areas around known sources and bright stars were excluded from background regions. Overlaid are the 1 σ ellipses for the source extension fits with an asymmetric Gaussian function for the three extended sources (VER J2019+407, VER J2031+415, VER J2019+368) and the position for VER J2016 +371 (cross).
Figure 6: >1 GeV counts map of the entire region obtained with Fermi - LAT. Point sources of the 3FGL catalog that are significant in this analysis are shown with small black crosses, the extended sources are shown with larger circles showing their characteristic extension. New sources identified in this analysis are shown with black diamonds.
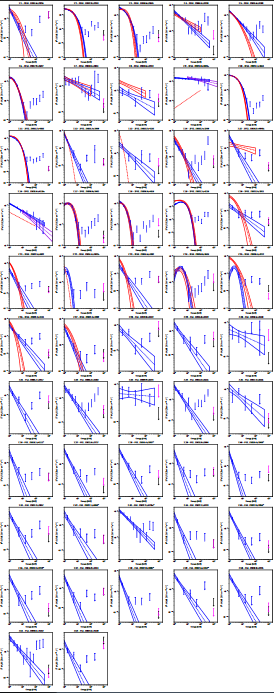
Figure 7: SEDs for all of the Fermi -LAT sources within the survey region (blue). For sources that lie outside the VERITAS source exclusion regions, VERITAS 95% confidence level differential upper limits are presented for the Point and Extended analysis in black and magenta respectively (see Section 4.1 for details). The red butterfly is the 3FGL catalog spectrum (Acero et al. 2015), purple is from the 3FHL catalog (Ajello et al. 2017). The two extended sources 3FGL J2021.0+4031e and 3FGL J2028.6+4110e had their spectra fixed during the production of the 3FGL catalog and thus are plotted without butterflies.
Figure 8: Significance (sqrt{TS}) map of the Fermi -LAT observations in the region of VER J2031+415 with the pulsar PSR J2032+4127 (3FGL J2032.2+4126) fixed to the ON-pulse spectral parameters. The best fit extension of FGL J2032.2+4128e, the source fit to this excess is shown in purple. Overlaid in green dot-dash contours are the 3, 4 and 5 sqrt{TS} contours from the analysis above 5 GeV. Also shown are VERITAS excess contours using the Extended integration region at levels of 50, 100, 150, 200, and 250 counts (red) and HAWC significance contours at 3, 4, 5, 6, and 7 σ (black dash). The locations of VER J2031+415 (black star), 3FGL J2032.3+4126 (purple cross), 2HWC J2031+415 (white tri) and Cygnus X-3 (white plus) are also indicated in the figure.

Figure 9: SEDs from sources in the VER J2031+415 region. Black is the VERITAS Extended analysis, blue is FGL J2032.2+4128e fit above 1 GeV, cyan above 5 GeV, the Fermi -LAT source that is located at the same position as VER J2031+415 and is potentially the low-energy extension of this emission, red is 3FGL J2032.2+4126, the bright pulsar in the region. Also plotted are the TeV J2032+4130 results from HEGRA (Aharonian et al. 2005) and MAGIC (Albert et al. 2008). The butterflies show statistical errors only.


Figure 10: The multiwavelength view of the region around VER J2031+415. Overlaid are VERITAS excess contours (green) produced using the Extended integration region at levels of 50, 100, 150, 200, and 250 counts and Fermi -LAT significance (sqrt{TS}, white) at 1 sqrt{TS} levels above 4 sqrt{TS}. Both the VERITAS and the Fermi -LAT emission are confined to a void in this mulitwavelength emission.
Figure 11: Fermi -LAT sqrt{TS} map of 3FGL J2021.0+4031e (SNR G78.2+2.1). Overlaid are VERITAS excess contours at levels of 50, 100, 150, 200, and 250 (red), and CGPS 1420 MHz (black) contours in 8 logarithmically spaced levels between brightness temperatures 20 and 150 K, (Taylor et al. 2003). The locations of 2HWC J2020+403 (purple diamond) and the Fermi -LAT sources in the region (orange tris for point sources, circles showing the extent for extended sources) are indicated as well.
Figure 12: SEDs from sources in the region of the G78.2+2.1. Black is the VER J2019+407 spectrum from the VERITAS Extended analysis. Also plotted are the Fermi -LAT SEDs from 3FGL J2021.0+4031e (blue) and 3FGL J2021.0+4031eA, the region of 3FGL J2021.0+4031e that lies within the VERITAS Extended integration region (red, 3FGL J2021.0+4031eB was also included in the analysis as an additional source whose spectrum is not shown for clarity). The butterflies show statistical errors only.
Figure 13: A section along the major axis of VER J2019+368 towards VER J2018+367* through the excess map using the Point integration radius (black steps). Each bin was produced using an aperture of width 0.05o and height 0.2o. The data are fit with a single Gaussian (blue) and the sum of two Gaussians (orange). The locations of VER J2018+367* (red dot-dashed) and VER J2020+368* (green dashed) are also shown.
Figure 14: Energy dependent excess map at >1000 GeV (red) and 1000 GeV of 70 counts and a maximum excess 50 photons s−1cm−2sr−1 in the 2-10 keV energy range from Mizuno et al. (2017).
Figure 15: Spectra of VERITAS sources in the MGRO J2019+37 region. The spectrum for VER J2019+368 was produced using the Extended integration region is shown in black along with the spectra for VER J2018+367* (blue) and VER J2020 +368* (red) which were produced using the Point integration region. The butterflies show statistical errors only.
Figure 16: Spectra of sources in the CTB 87 region. The VERITAS spectrum for VER J2016+371 (black) is plotted along with the Fermi -LAT spectra derived from a single source located at the position of 3FGL J2015.6+3709 (blue). The spectra from an analysis where this was replaced with two sources, one located at the radio position of CTB 87 (red) and one located at the radio position of QSO J2015+371 (magenta), are also shown. The butterflies show statistical errors only.

Figure 17: XMM-Newton counts (red color scale, observation id. 0744640101, no background subtraction nor correction for variation in exposure across the FoV has been applied). VERITAS excess with the Point integration region is shown in levels of ten counts starting at 30 (bright green) along with CGPS 1420 MHz contours (eight logarithmically spaced levels between brightness temperatures 20 and 150 K (Taylor et al. 2003), dark blue). The locations of VER J2016+371 (green plus), the Fermi -LAT position from this work (green cross) and the positions from the different catalogs (black tri symbols) and the radio locations of CTB 87 (cyan o) and QSO J2015+371 (cyan diamond) are shown for comparison.
Figure 18: Trial factor, XT , as a function of local significance, local. The black dashed line presents the total number of bins in the sky map of the whole Cygnus region observed with VERITAS. At low σ , P( σglobal > σ ) approaches 1, thus Equation B8 has no solution.
Figure 19: Global (σ global) vs. local (σ local) significance for the sky survey region. Below σ local ≈ 4.5 the global significance is zero, i.e. a fluctuation of this magnitude is expected every observation.
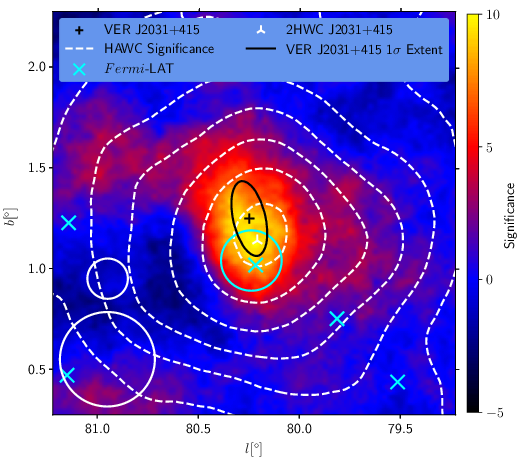
Figure 20: Significance maps of the region around VER J2031+415 (left: point integration region; right: extended integration region). Overlaid are the 1 σ ellipses for the source extension and its centroid (black) along with the location of 2HWC J2031+415 (white tri), the positions of the Fermi -LAT sources (cyan) and HAWC significance contours (at 2 σ levels starting at 4 σ, white dash). The upper white circle in the lower left is the PSF, whilst the lower circle is the integration region.
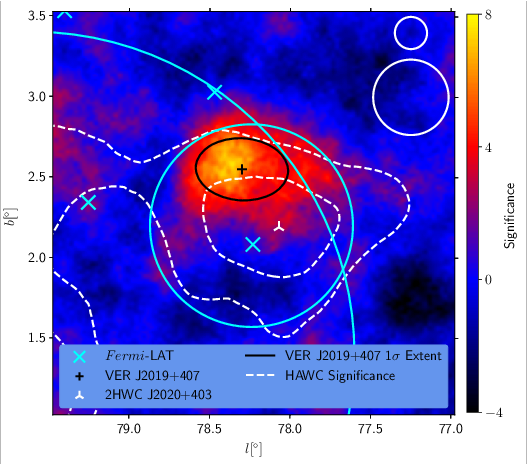
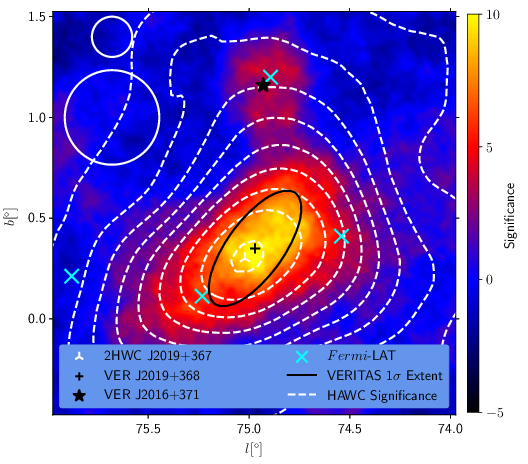
Figure 21: Significance maps of the region around VER J2019+407 (left: point integration region; right: extended integration region). Overlaid are the 1 σ ellipses for the source extension and its centroid (black) along with the location of 2HWC J2019+407 (white tri), the positions of the Fermi -LAT sources (cyan) and HAWC significance contours (at 2σ levels starting at 4σ , white dash). The smaller cyan circle shows the extent of 3FGL J2021.0+4031e (G78.2+2.1) and the arc of a larger cyan circle the extent of 3FGL J2028.6-4110e (the Cygnus Cocoon). The upper white circle in the upper right is the PSF, whilst the lower circle is the integration region.
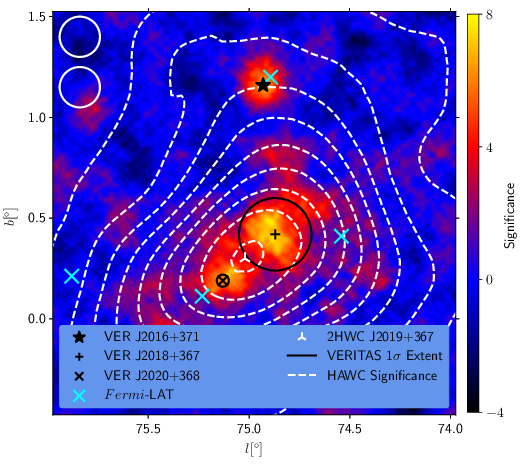

Figure 22: Significance maps of the region around VER J2018+367*, VER J2020+368* and VER J2016+371 (left: point integration region; right: extended integration region). Overlaid are the 1σ ellipses for the source extension and their centroids (black) along with the location of 2HWC J2019+367 (white tri), the positions of the Fermi -LAT sources (cyan) and HAWC significance contours (at 2σ levels starting at 4σ , white dash). The upper white circle in the upper left is the PSF, whilst the lower circle is the integration region.

