1ES 0229+200 is a relatively distant (z = 0.1396), hard-spectrum (Gamma ~ 2.5), very-high-energy (VHE; E > 100 GeV) emitting gamma-ray blazar. This Active Galactic Nucleus (AGN) is a high-frequency peaked BL Lacertae object which means that its emission is peaking relatively high in energy compared to other blazars. 1ES 0229+200 was originally detected by H.E.S.S. and has been studied across the electromagnetic spectrum. This study presents the deepest ever observations of this VHE blazar and reveals that this blazar is variable in the X-ray regime, that it is marginally variable (there is a 1.6% chance that it is non-variable) in the VHE regime, and that its spectral energy distribution is similar to other VHE blazars.rther observations will be required to address these questions.
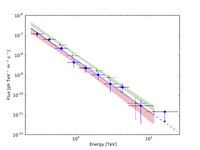
Figure 1: The measured VHE spectrum from 1ES 0229+200 averaged over all three seasons (blue points with error bars). The upper (green) and lower (red) shaded regions show the spectral shape during the flaring and low periods, respectively. The black points are the archival H.E.S.S. spectral points from Aharonian et al. (2007c).
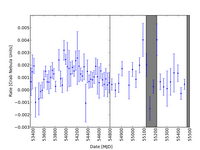
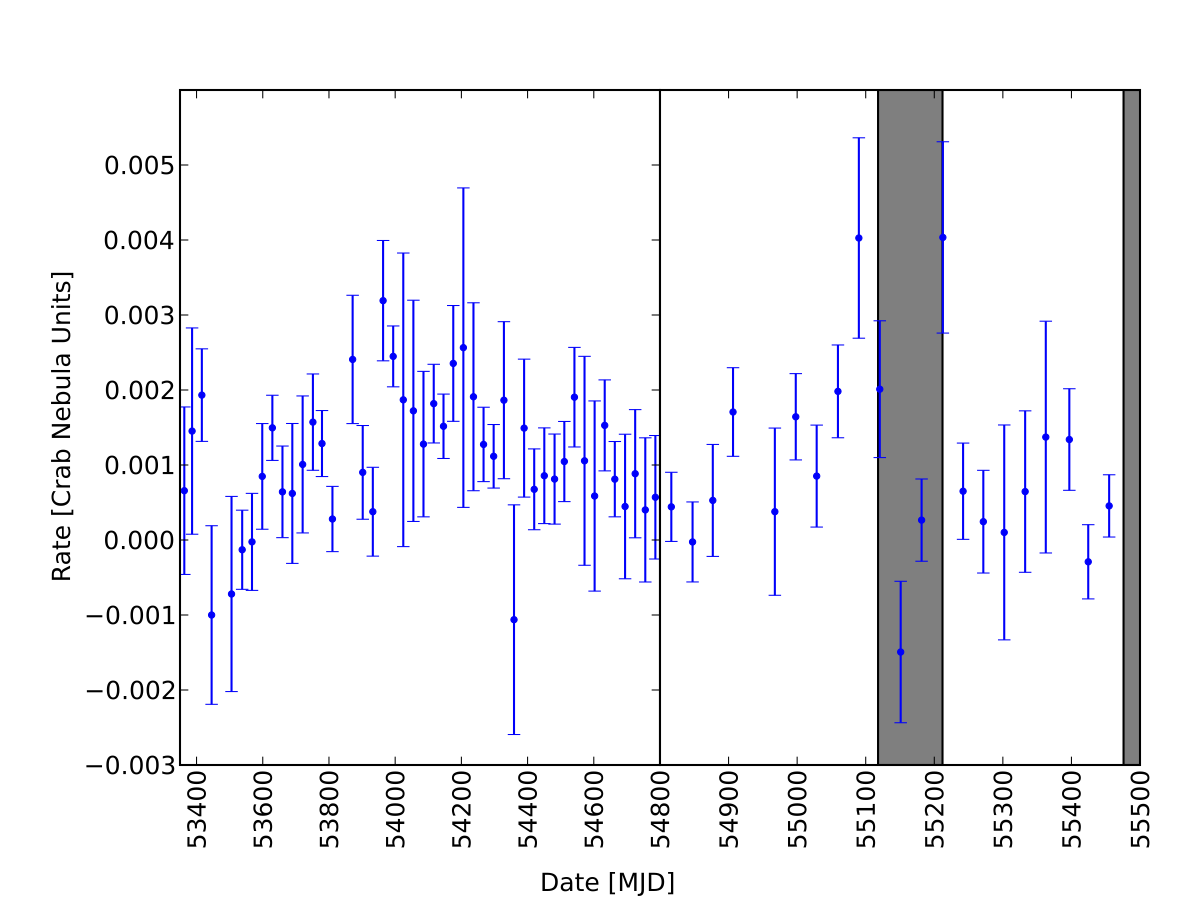
Figure 2: Rate in the BAT 70-month survey (in units of the Crab Nebula’s flux) from 14 to 195 keV. The abscissa of the right panel is spread out for clarity but the time series between the two panels is continuous. Since the BAT is a survey instrument, the exposure on 1ES 0229+200 is not constant in each bin and this is reflected in the size of the error bars. Two points with very small exposures (686 and 141 seconds respectively) and thus very large error bars at MJD 53841 and 54937 have been removed for clarity. The first grey band is the extent of the VERITAS 2009-2010 observing season listed in Table 1 and shown in Figure 4. The VERITAS 2010-2011 observing season begins at the end of the BAT 70-month survey and can be seen as a grey band on the far right. The BAT 70-month survey provides data up to September 2010. These data are also shown in context with the other data sets in Figure 3.
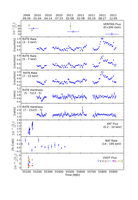
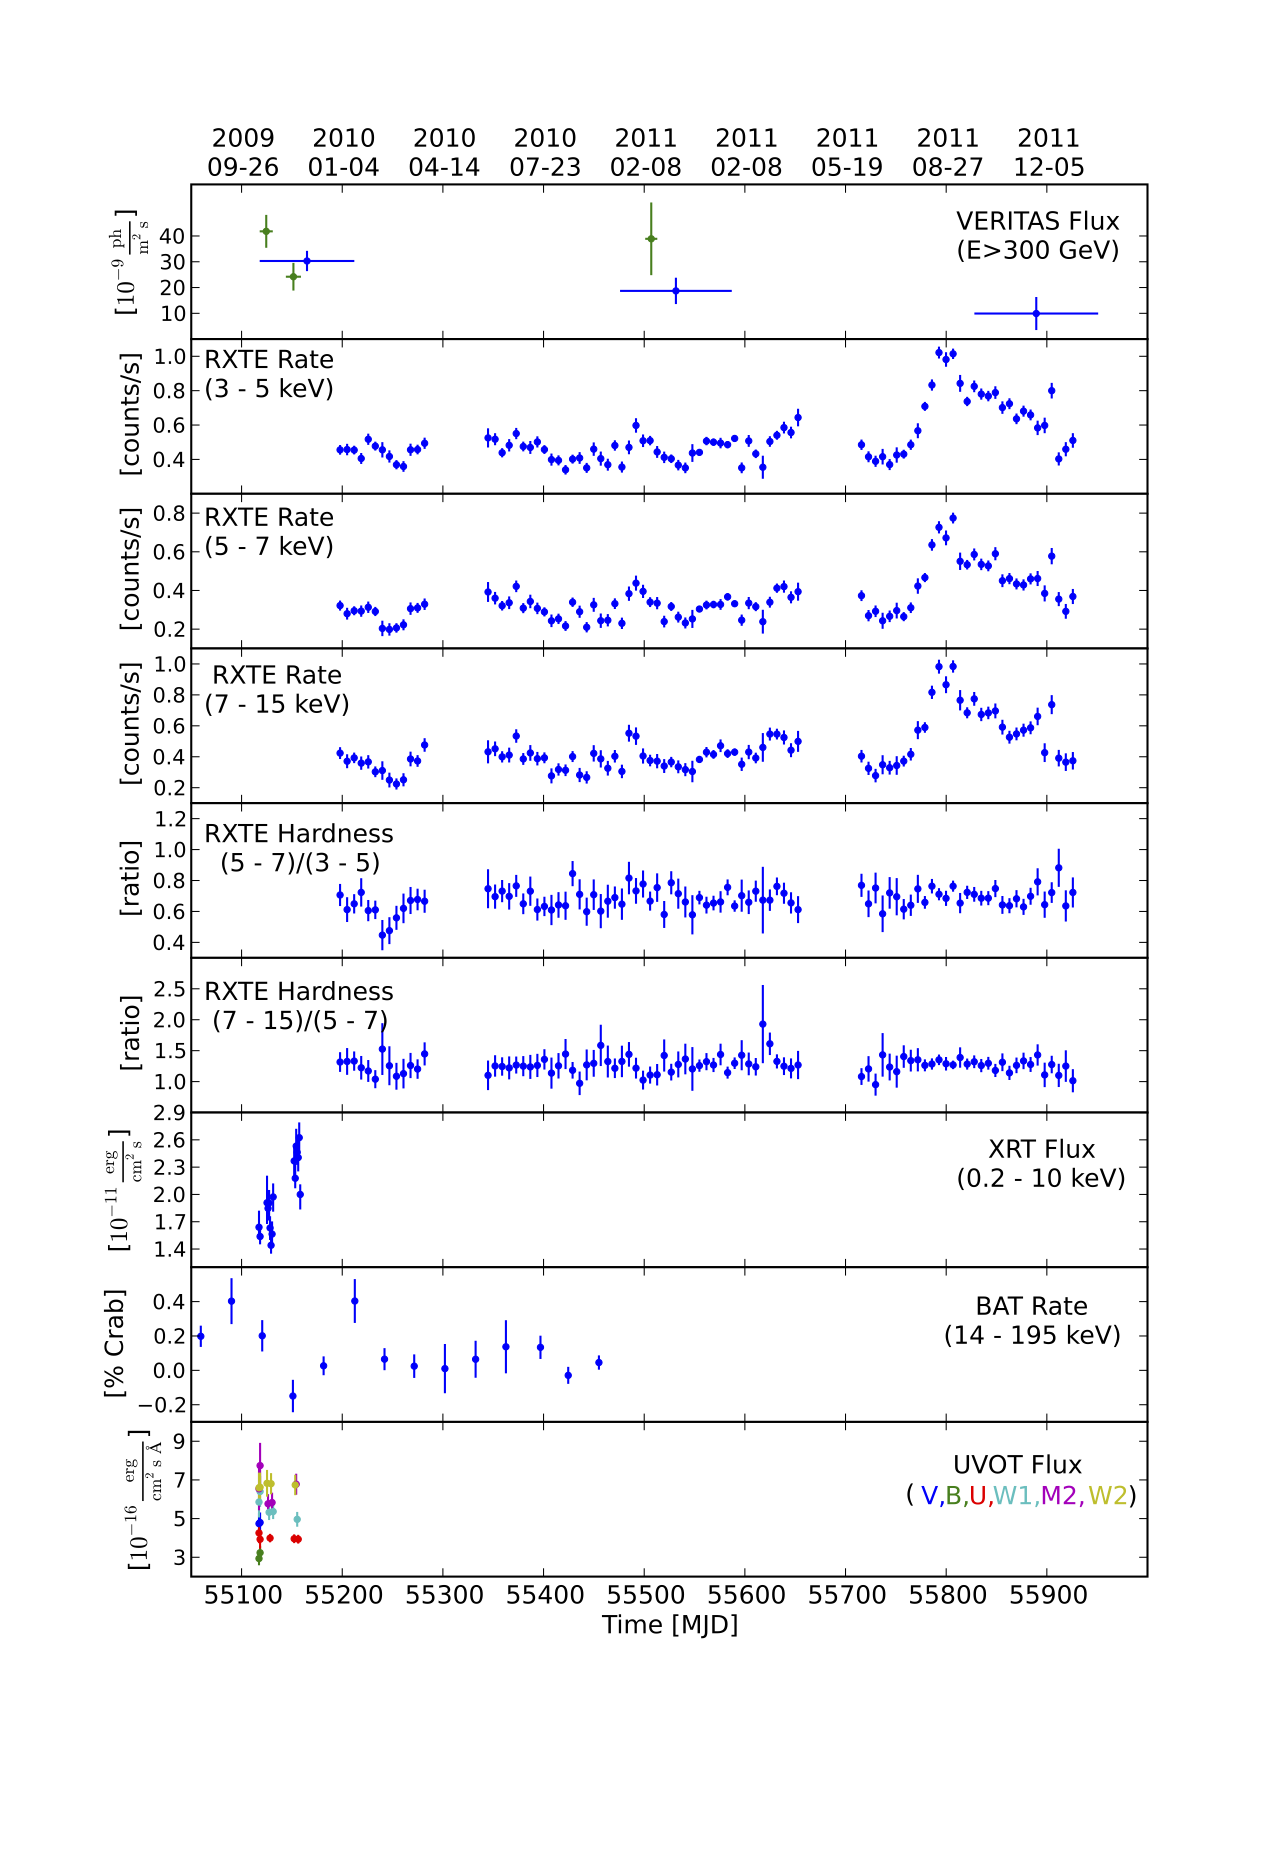
Figure 3: The upper panel shows the VHE flux measured by VERITAS and detailed in Figure 4. The green points are the data binned by observing period. Only points with a significance greater than two standard deviations are shown (the full data set can be found in Table 1). The second through fourth panels show low (3 - 5 keV), mid (5 - 7 keV), and high (7 - 15 keV) energy range count-rate light curves from the RXTE PCA binned by week. The fifth and sixth panels show the hardness ratio from the RXTE PCA (mid energy to low energy bands and high energy to mid energy band, respectively). The seventh panel shows the flux measured by XRT in the 0.2 - 10 keV band and the eighth panel shows the rate in the BAT in the 14 - 195 keV band. The last panel shows the flux measured using the six different UVOT filters (V is blue, B is green, U is red, UVW1 is cyan, UVM2 is magenta and UVW2 is yellow).
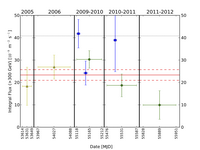
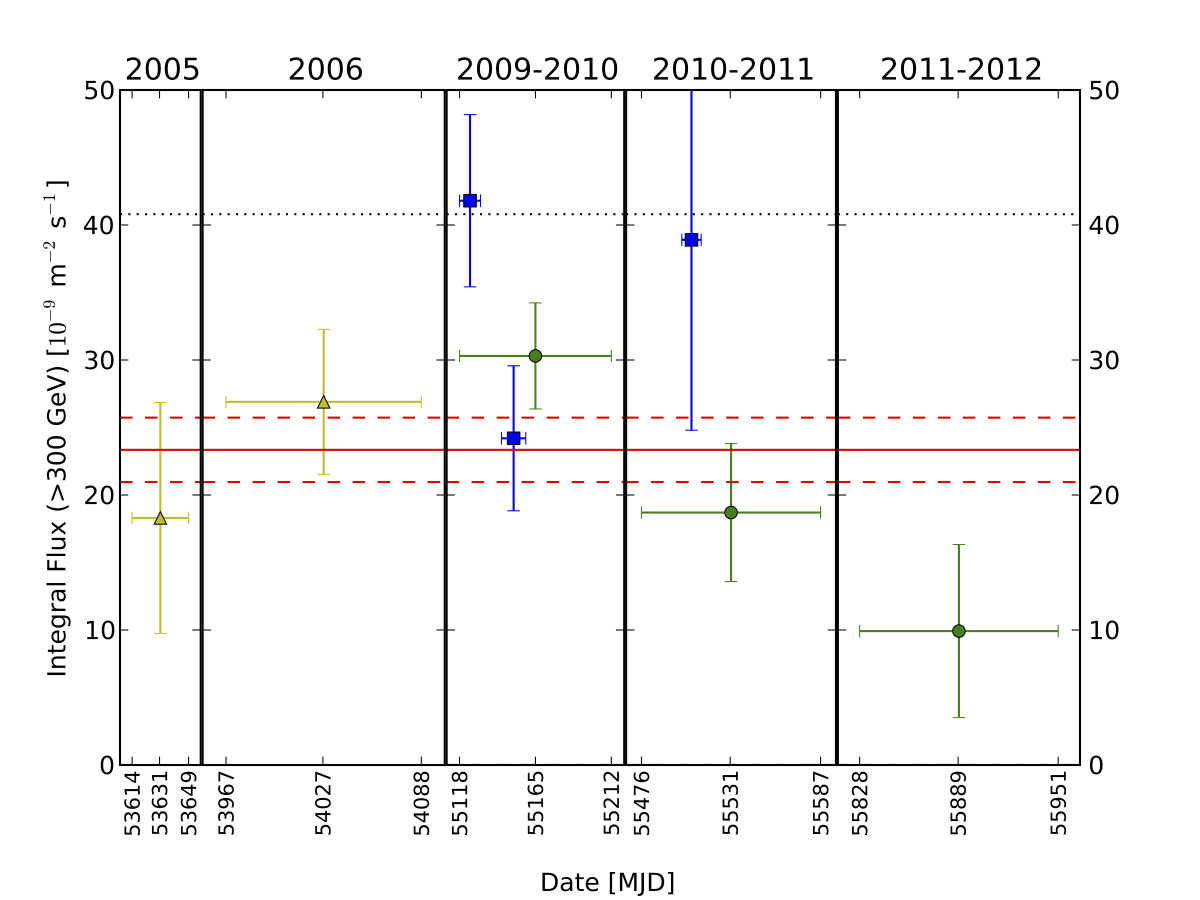
Figure 4: Integral flux above 300 GeV for 1ES 0229+200, binned by observing season (green circles). The vertical black lines also delineate the observing seasons. The yellow triangles in 2005 and 2006 are from the previous H.E.S.S. measurements (Aharonian et al. 2007c), shown for comparison. The blue squares are the data binned by observing period. Only points with a significance greater than two standard deviations are shown (the full data set can be found in Table 1). The horizontal red lines (solid is the value and dashed is the statistical error range) are the fit to the VERITAS yearly data (green circles). The black dotted line shows a 3% Crab Nebula flux for comparison. These data are also shown in context with the other data sets in Figure 3.
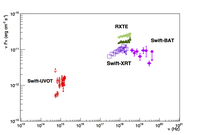
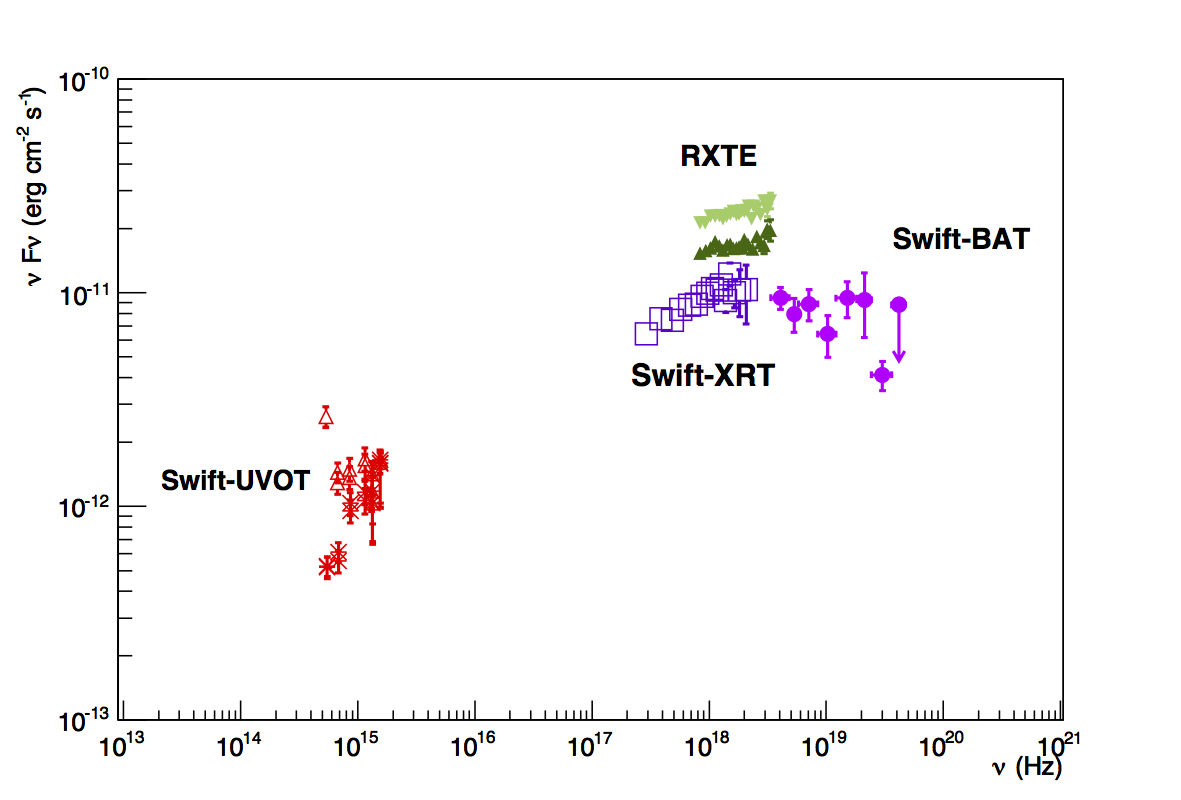
Figure 5: The synchrotron part of the SED of the blazar 1ES 0229+200. The red triangles are the uncorrected Swift-UVOT measurements while the red stars are the absorption and host-galaxy corrected UVOT points. The synchrotron peak is constrained by the Swift-XRT, Swift-BAT and the RXTE measurements in the X-ray. Two RXTE periods are shown, a low state and during the large flare around MJD 55800.
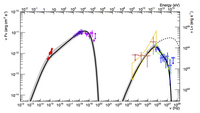
Figure 6: The multi-wavelength SED of the blazar 1ES 0229+200. The red asterisks are the average Swift-UVOT measurements, the open purple squares are the average Swift-XRT measurements and the pink circles are the 70-month average Swift-BAT measurements. The BAT and XRT data straddle the synchrotron peak. At high energies, the Fermi-LAT points are shown as salmon stars (the yellow region indicates the statistical uncertainty on the spectral model) and the VERITAS data are shown as blue crosses (the green region indicates statistical uncertainty on the spectral model). The UVOT data are corrected for absorption and for host-galaxy emission (see the text). The grey region indicates the range of all of the one-zone SSC models which correctly describe the SED. The solid black curve is the SSC model with the lowest Χ 2 value with respect to the data. The dotted black line represents the best-fit SSC model before absorption on the EBL.
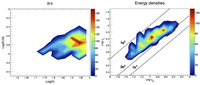
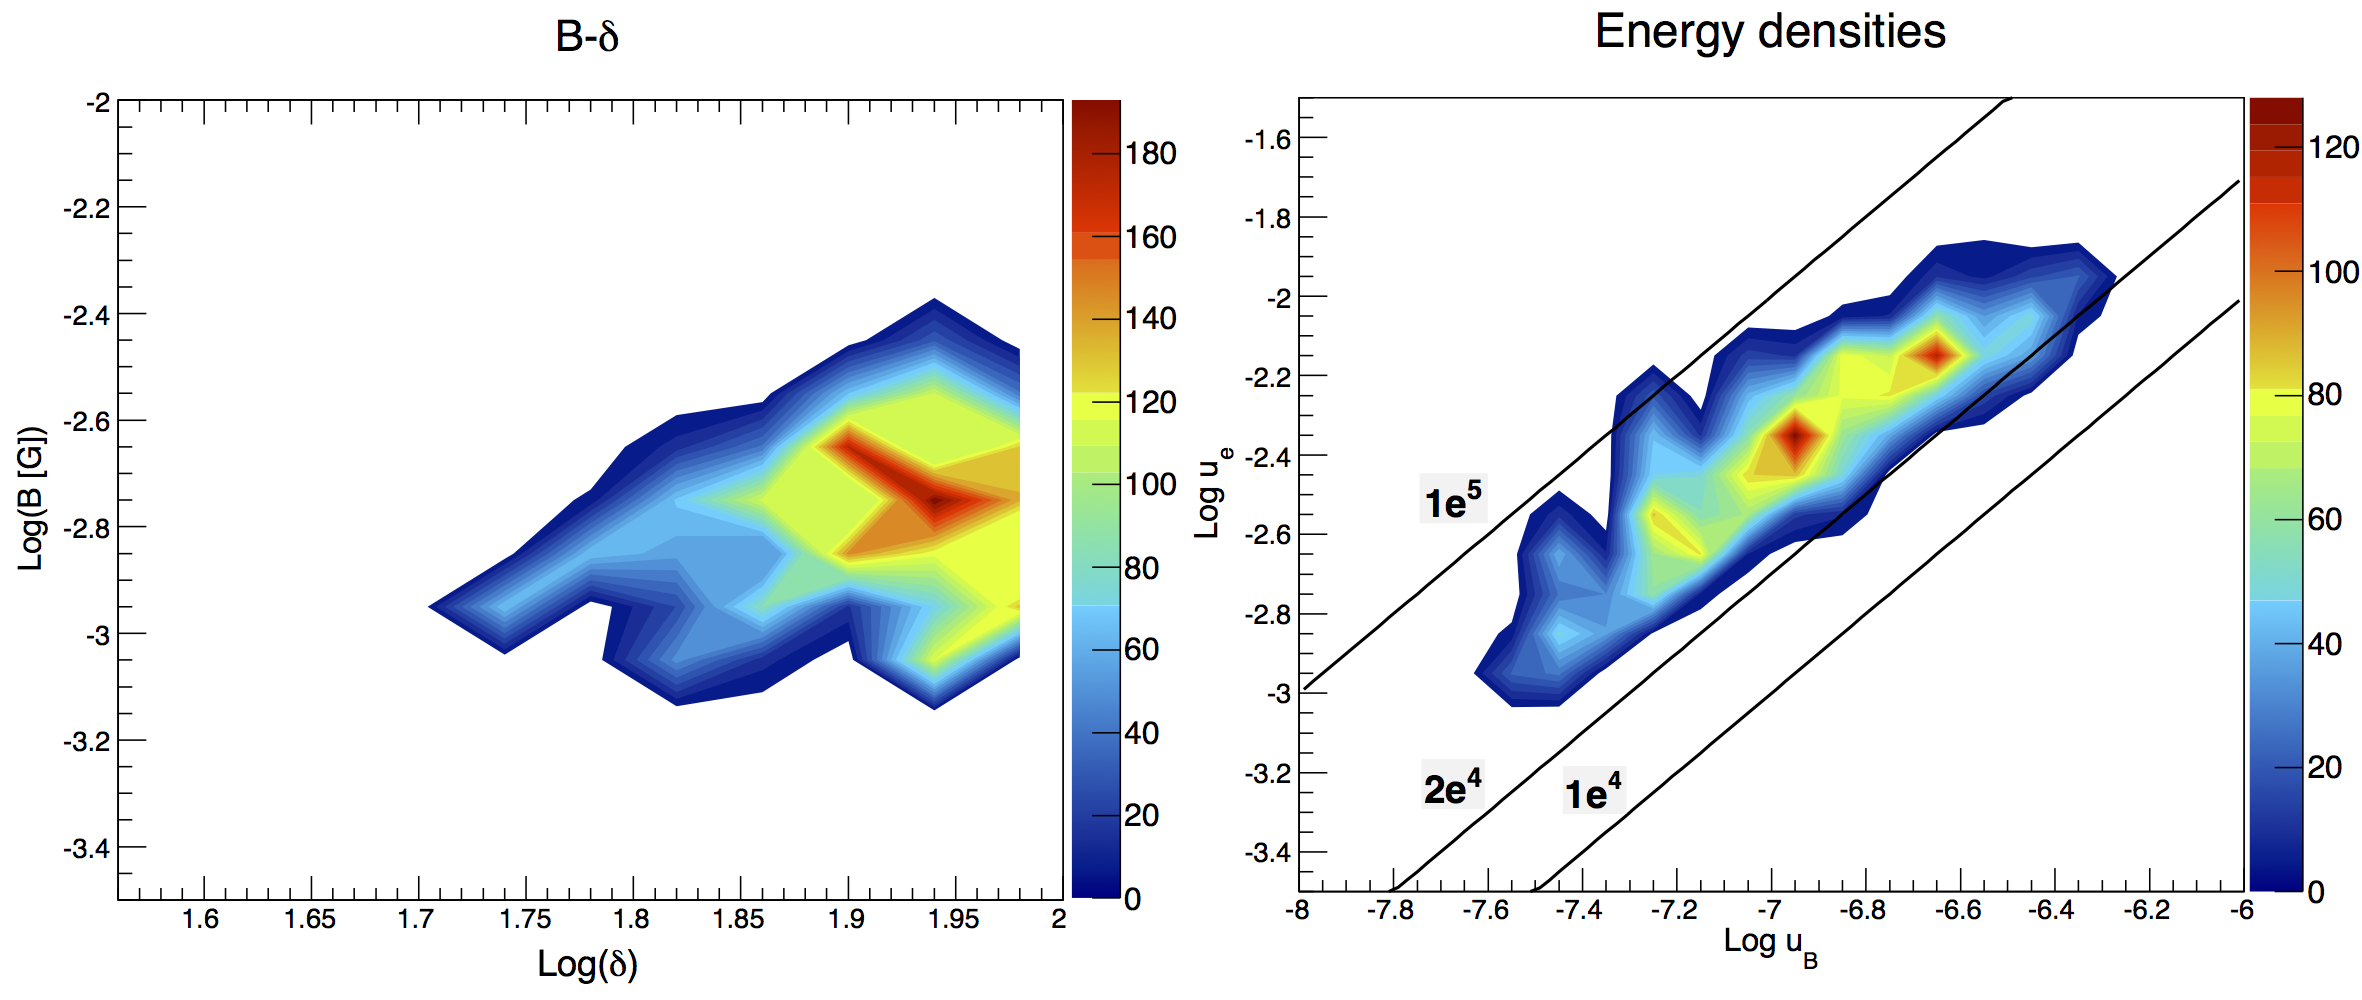
Figure 7: Left: log10 B-log10δ parameter space for the SED shown in Figure 6. The color scale is arbitrary and the most extended contour represents the 1σ region. Values of δ higher than 100 have not been studied. Right: log10 Ue-log10 UB SED parameter space. The color scale is arbitrary and the most extended contour represents the 1σ region. The slanted lines are equipartition contours (Ue/UB).