HESS J0632+057 is the only gamma-ray binary known so far whose position in the sky allows observations with ground-based observatories both in the northern and southern hemispheres. Here we report on long-term observations of HESS J0632+057 conducted with the VERITAS and H.E.S.S. Cherenkov Telescopes and the X-ray Satellite Swift, spanning a time range from 2004 to 2012 and covering most of the system?s orbit. The VHE emission is found to be variable, and is correlated with that at X-ray energies. An orbital period of 315 days is derived from the X-ray data set, which is compatible with previous results, P = (321 ± 5) days. The VHE light curve shows a distinct maximum at orbital phases close to 0.3, or about 100 days after periastron passage, which coincides with the periodic enhancement of the X-ray emission. Furthermore, the analysis of the TeV data shows for the first time a statistically significant (> 6.5?) detection at orbital phases 0.6?0.9. The obtained gamma-ray and X-ray light curves and the correlation of the source emission at these two energy bands are discussed in the context of the recent ephemeris obtained for the system. Our results are compared to those reported for other gamma-ray binaries.
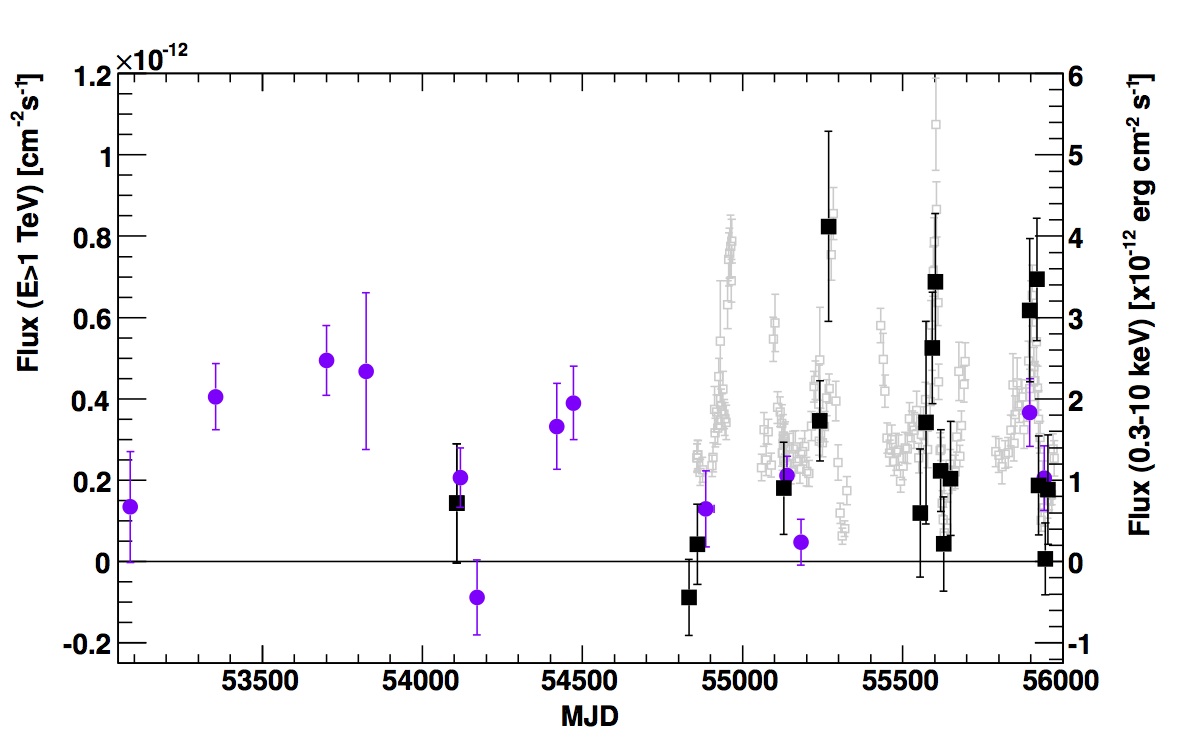
Figure 1: Long-term observations of HESS J0632+057 with H.E.S.S. (round purple markers) and VERITAS (square black markers) at energies > 1 TeV and in X-rays with Swift-XRT (0.3?10 keV; open grey markers) from March 2004 to February 2012.
Figure 2: Z-transformed discrete autocorrelation function (Z-DCF) for the Swift-XRT light curve shown in Fig. 1. The errors bars denote the 1σ sampling errors resulting from a MC-based error calculation as described in the text. The dashed line and the blue band indicate the most likely modulation period of 315 days and the corresponding 68% fiducial interval.
Figure 3: Phase-folded X-ray (0.3?10 keV) light curve assuming an orbital period of 315 days. Different orbital cycles are indicated by markers and colors. Vertical error bars show 1σ statistical uncertainties.
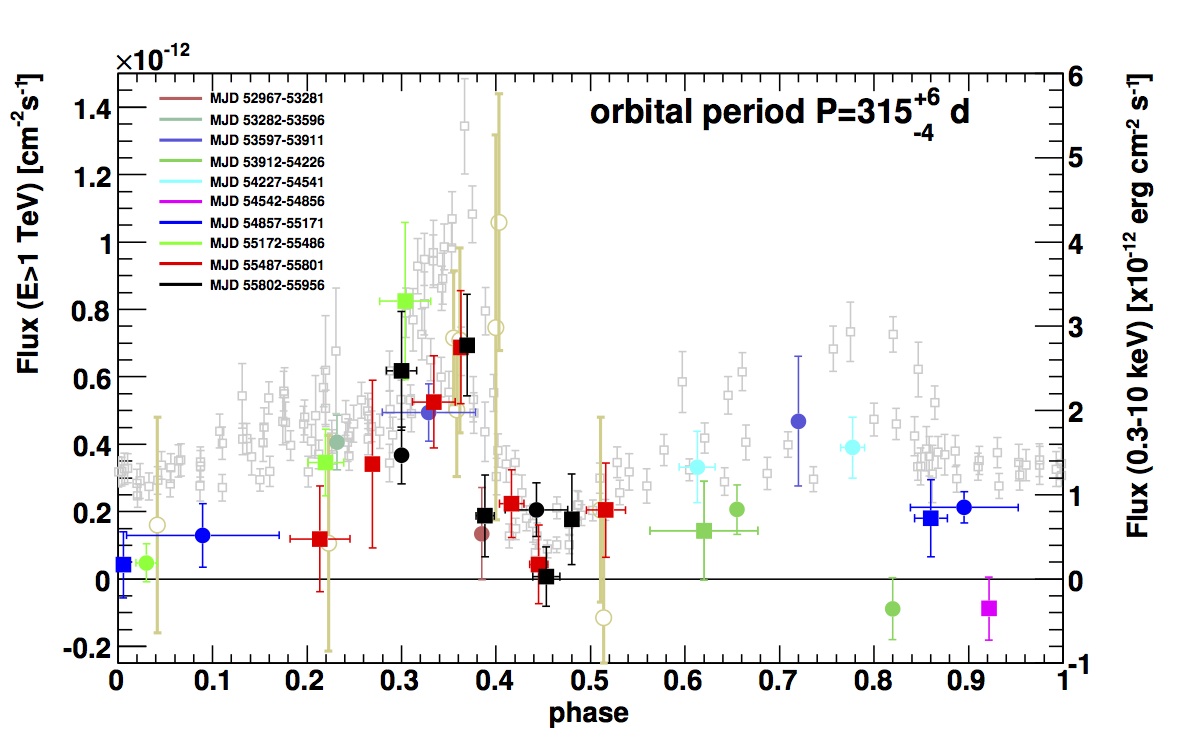
Figure 4: Integral gamma-ray fluxes above 1 TeV (vertical scale on the left) from H.E.S.S. (filled round markers), MAGIC (brown round open markers, scaled to 1 TeV assuming a power law with index Γ=2.6; Aleksic et al. 2012) and VERITAS (filled squared markers). X-ray fluxes (0.3-10 keV) are shown as measured by Swift-XRT (open square grey marker; vertical scale on the right). All measurements are folded with the orbital period of 315 days; the colors indicate different orbits. Vertical error bars show 1σ statistical uncertainties, horizontal error bars indicate the width of the corresponding observing interval
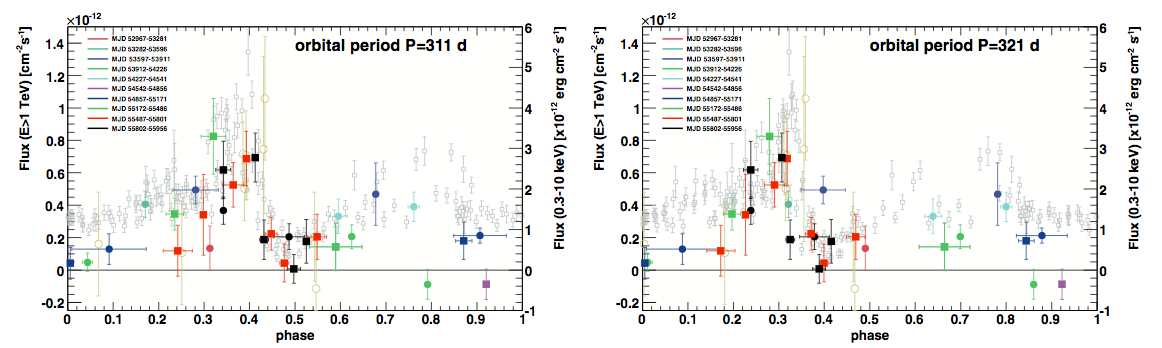
Figure 5: Impact of the 1σ error of the orbital phase on the phase-folded light curves. Phase- folded light curve using an orbital period of 311 (left) and 321 (right) days. The maximum of the X-ray light-curve coincides with that at TeV energies taking both values for the period and occurs at orbital phases ~0.3. Enhanced X-ray emission at phases ~0.6-0.9 is also observed in the two panels, for which most of the corresponding TeV data points leading to the source detection in this phase interval are still included. See Fig. 4 for a description of the figure axes, markers and error bars.
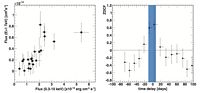
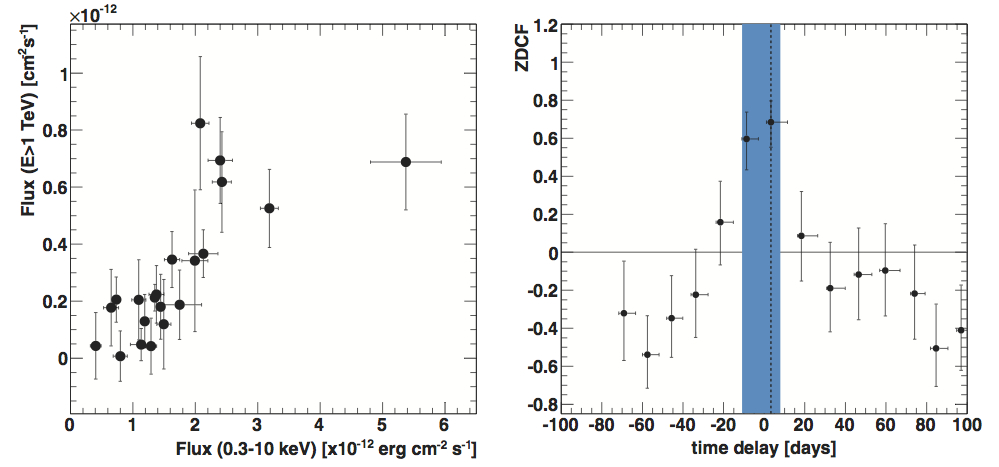
Figure 6: Left: Integral gamma-ray fluxes (> 1 TeV) vs X-ray (0.3-10 keV) fluxes for contemporaneous VHE/X-ray observations. X-ray data were selected in a ±2.5 day interval centered on the VHE observing dates. Right: Z-transformed discrete correlation (Z-DCF) between the Swift-XRT light curve and the combined VERITAS and H.E.S.S. gamma-ray data. The error bars denote the 1σ sampling errors resulting from a MC-based error calculation as described in the text. The dashed line and the blue band indicate the most likely time lag between X-ray and VHE data of 3.3+8.1 days and the corresponding 68% fiducial interval.
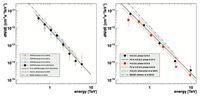
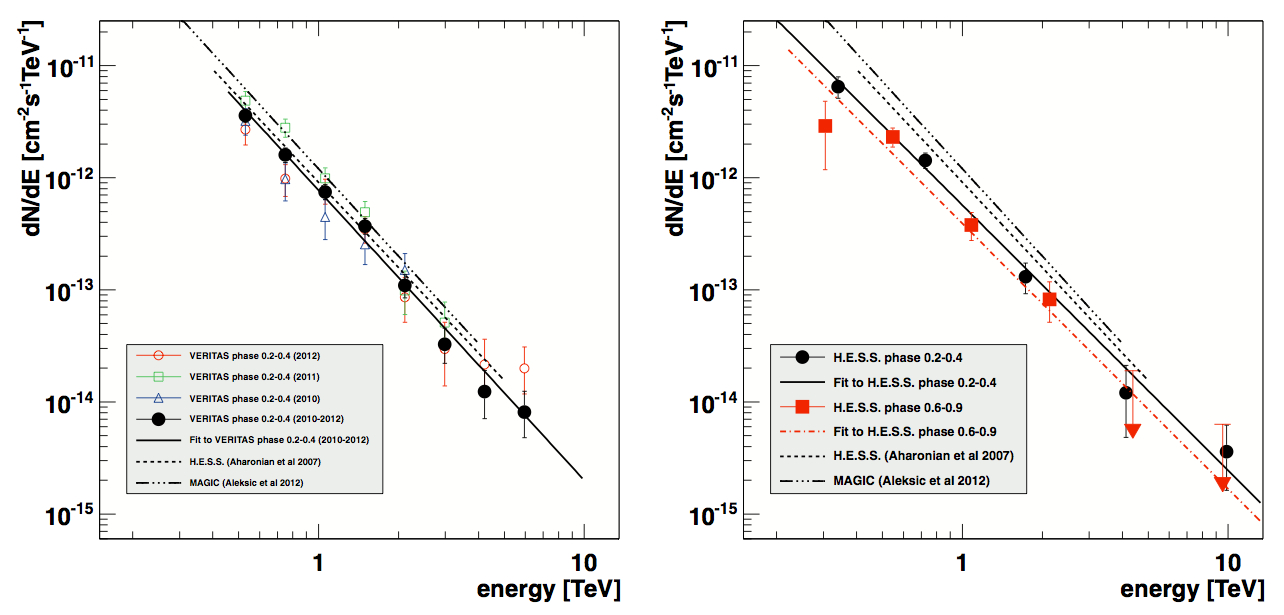
Figure 7: Differential energy spectra of VHE photons for HESS J0632+057 as measured by VERITAS and H.E.S.S. The continuous lines show the results from fits assuming a power- law distribution of the data and a spectral index of -2.5. Fit results can be found in Table 2. Vertical error bars indicate 1σ statistical errors. Left: Differential energy spectrum for orbital phases 0.2 to 0.4 as measured by VERITAS during different orbits. Right: Average differential energy spectrum for orbital phases 0.2 to 0.4 and 0.6 to 0.9 as measured by H.E.S.S. For comparison, although taken at different orbital phases, the energy distributions as published by the H.E.S.S. (Aharonian et al. 2007; measurement in December 2004 and December 2005) and MAGIC Collaborations (Aleksic et al. 2012; measurement in February 2011) are indicated by the dashed and dotted-dashed lines, respectively.
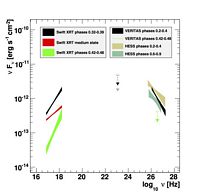
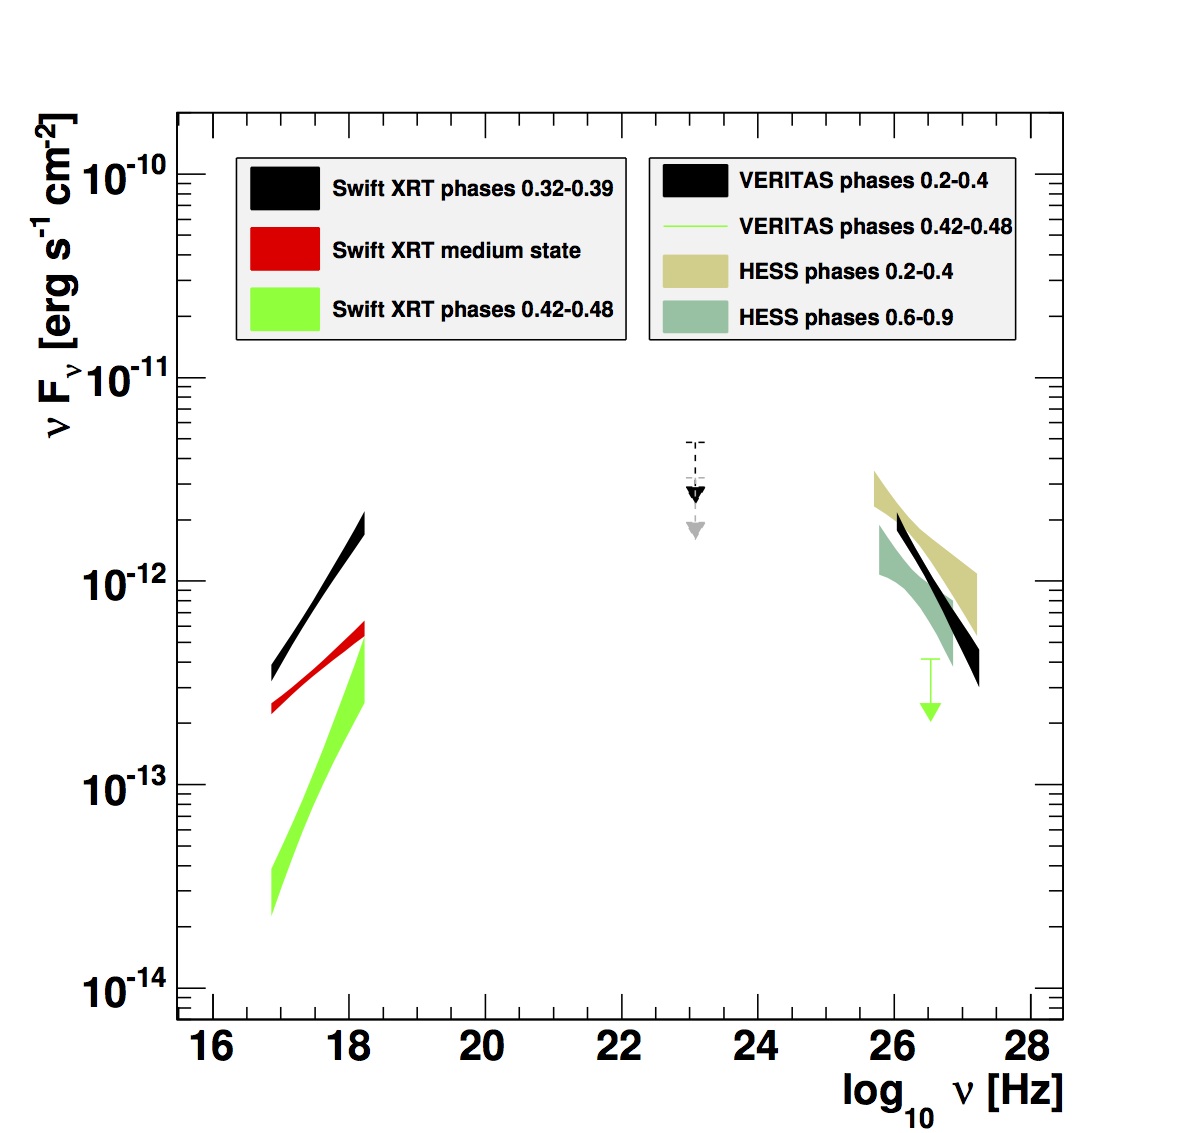
Figure 8:Spectral energy distribution for HESS J0632+057 as measured by VERITAS, H.E.S.S., Swift -XRT, and Fermi -LAT (Caliandro et al. 2012). The downwards pointing arrow at VHE is an upper flux limit at 95% confidence level for phases 0.42-0.48. Details for the high, medium and low state X-ray measurements are given in Table 3. The integral upper limit above 100 MeV measured by Fermi-LAT (confidence level 95%) has been converted to a differential flux value assuming a spectral index Γ = -2. (black dashed arrow) and Γ = -2.5 (grey dashed arrow) and is shown at an energy of 500 MeV. The butterfly plots indicate the 1 sigma statistical errors of the power-law fit to the data points.