Reference: E. Aliu et al. (The VERITAS Collaboration), Astrophysical Journal 750: 94, 2012
Full text version
ArXiv: ArXiV:1204.0865
Contacts: Gunes Senturk, Pascal Fortin, Deirdre Horan
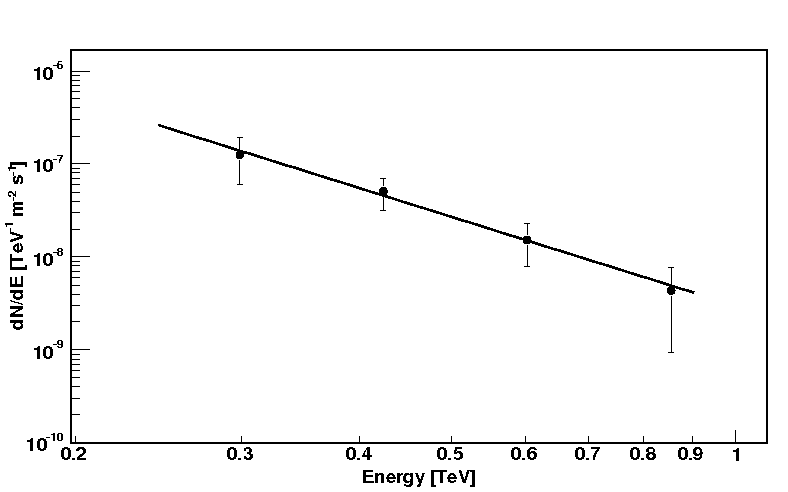
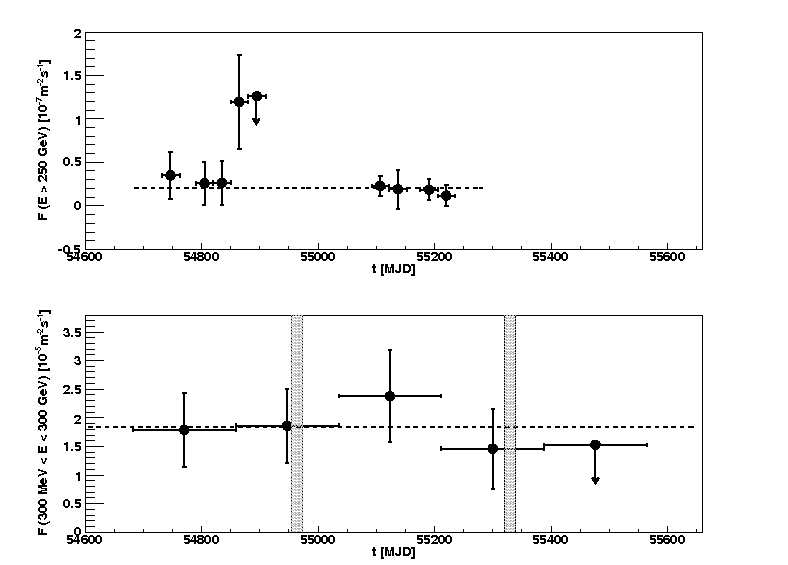
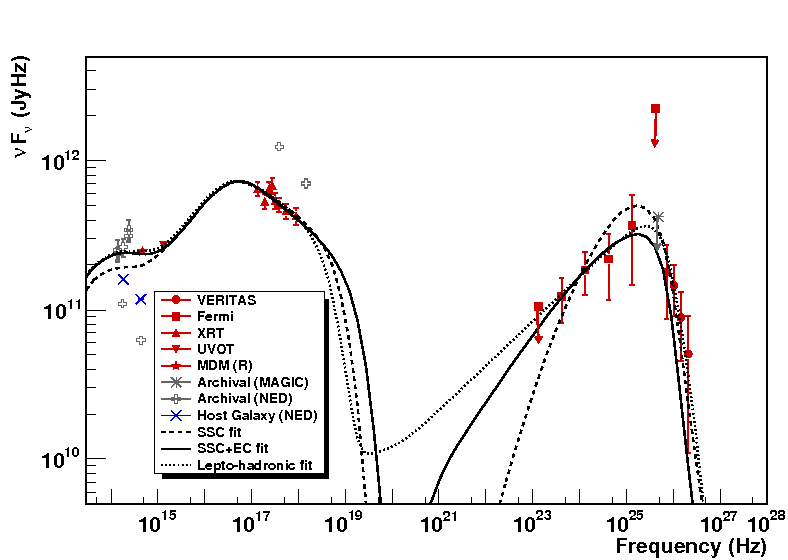
We report on the detection of the blazar RBS 0413 in high-energy (HE; E>100 MeV) and very high-energy (VHE; E>100 GeV) gamma rays with the Fermi Gamma-ray Space Telescope and VERITAS, respectively. RBS 0413 is an active galaxy of the BL Lac class located at a redshift of 0.190. VERITAS, as a ground-based gamma-ray telescope, performs mostly pointed observations, where target selection is crucial. This joint discovery is a case where Fermi provided valuable information for VERITAS observation strategies.
BL Lac objects are natural laboratories where particles in a jet plasma outflowing from a central supermassive black hole are accelerated to ultrarelativistic speeds. Their jet is oriented along the observer’s line of sight, resulting in extreme observational properties such as boosted apparent luminosity and minute-scale variabilities accompanying giant flares that are among nature’s most powerful energy releases. The outstanding question about these objects is which physical mechanisms are responsible for the observed emission. In this work, we analyzed multiwavelength spectral data extending from the optical band to VHE gamma rays and looked for temporal variabilities in HE and VHE bands to investigate this question.
Tar file containing tables from paper and FITS files of results
Figures from paper (click to get full size image):