The giant radio galaxy M87 with its proximity (16 Mpc), famous jet, and very massive black hole provides a unique opportunity to investigate the origin of very high energy (VHE; E>100 GeV) gamma-ray emission generated in relativistic outflows and the surroundings of super-massive black holes. During a joint 2010 VHE monitoring campaign by VERITAS, MAGIC and H.E.S.S. a strong VHE flare was detected from M87 triggering further observations at VHE, X-rays (Chandra), and radio (43 GHz VLBA). The excellent sampling of the VHE gamma-ray light curve enables one to derive a precise temporal characterization of the flare.
43 GHz VLBA radio observations of the inner jet regions indicate no enhanced flux in 2010 in contrast to observations made following a VHE flare in 2008, where an increase of the radio flux of the innermost core regions coincided with a VHE flare. On the other hand, Chandra X-ray observations taken 3 days after the peak of the 2010 VHE gamma-ray emission reveal an enhanced flux from the core (flux increased by factor 2; variability timescale < 2 days). The long-term (2001-2010) multi-wavelength (MWL) light curve of M87, spanning from radio to VHE and including data from HST, LT, VLA and EVN, is used to further investigate the origin of the VHE gamma-ray emission.
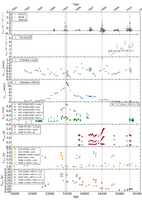
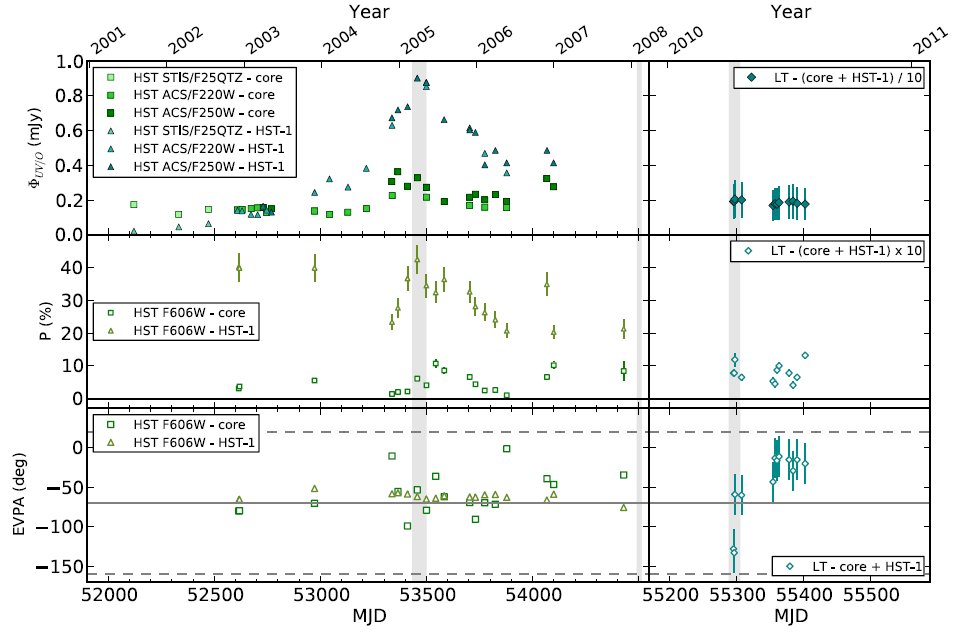
Figure 1: Multi-wavelength light curve of M87 from 2001 to 2011. The VHE γ-ray flux (top panel) is calculated above an energy threshold of 350 GeV (see text). Separate fluxes for the core and HST-1 are shown in cases where the instrument resolution is sufficient to separate the two components. Gray vertical bands mark the times of increased VHE activity in 2005, 2008, and 2010 (see Fig. 2). The dashed line and the gray horizontal band in the 2nd panel marks the average flux with 1 s.d. error measured by Fermi-LAT. The radio flux of HST-1 at di fferent frequencies has been normalized to the 5 GHz flux assuming a spectrum Sν ˜ ν-α with α = 0.6. All flux errors shown are the 1 s.d. statistical errors except for the LT data where the uncertainty on the contribution from the galaxy is included in the error bars. For details on the data, the data analysis, and references see text. Flaring, low-state and daily upper limits are shown superimposed on the Swift XRT light curve (Evans et al. 2007). The extent of the daily upper limit horizontal bars represents the approximate time interval during which the VERITAS observations were taken.
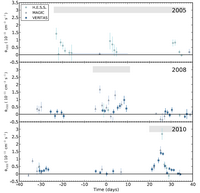
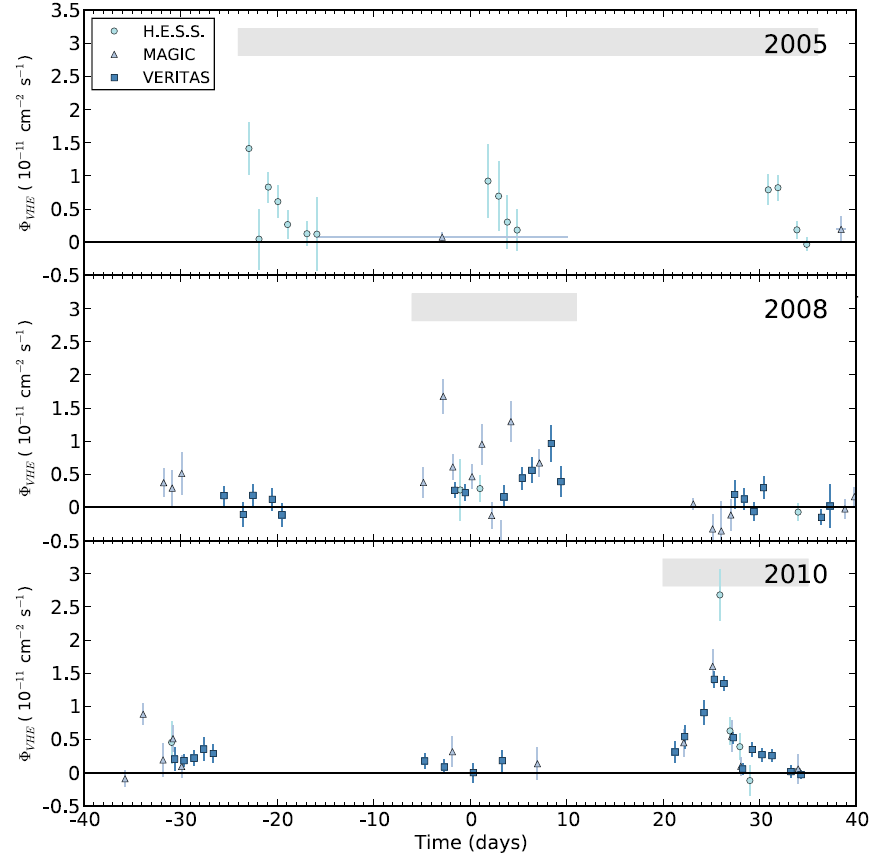
Figure 2: VHE light curve ofM87 of the flaring episodes in 2005 (top), 2008 (middle), and 2010 (bottom). Integral fluxes are given above an energy of 350 GeV. The lengths of the gray bars correspond to the length of the gray shaded areas in Fig. 1. A time of 0 days corresponds to MJD 53460, MJD54500, and MJD 55270 for 2005, 2008, and 2010, respectively. Flux error bars denote the 1 s.d. statistical error. Horizontal error bars denote the time span the flux has been averaged over. Note that in the case of time spans longer than one night the coverage is not continuous.
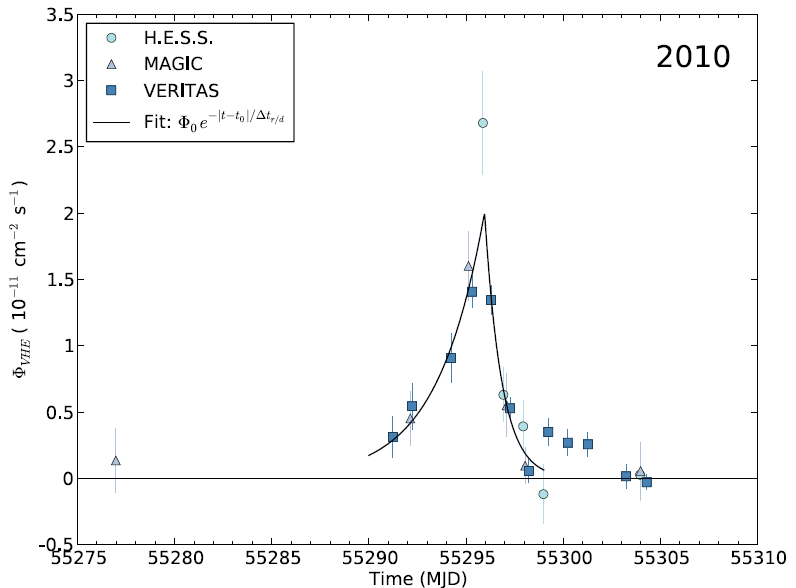
Figure 3: VHE light curve of M87 zoomed on the 2010 flare. Also shown are the results of the fit of an exponential function to the data. Error bars denote the 1 s.d. statistical error. The results of the fit to the data are summarized in Table 2. Further details can be found in the text.
Figure 4: Optical polarization for di erent components of the M87 jet as measured by HST and LT. The LT polarization measurement of the core + HST-1 complex is scaled up by a factor of 10 to compensate for the host galaxy emission in the measurements (see Sect. 2.4 for details). The horizontal gray solid line in the lower panel marks the jet direction (-69.5o) while the horizontal gray dashed lines are located at -69.5o ± 90o (180o distance).
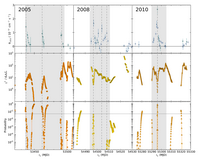
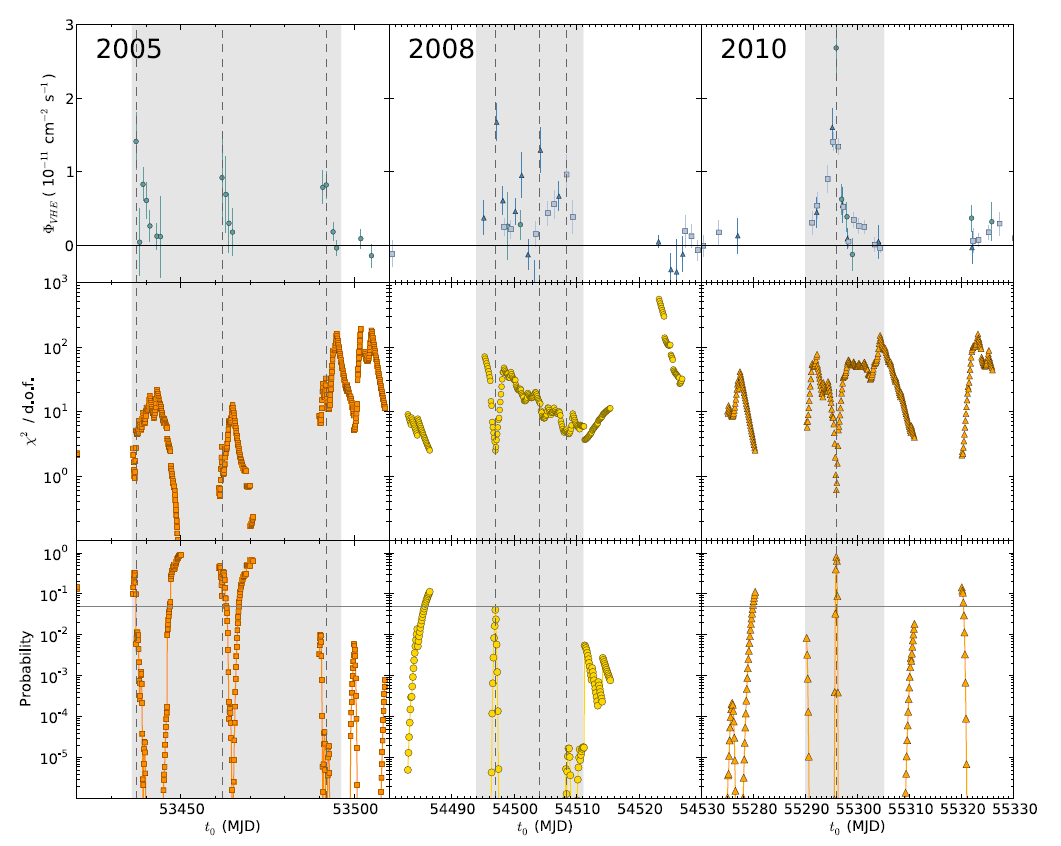
Figure 5: VHE light curve (top), reduced chi-square 2=d.o.f. (degree of freedom) (middle), and probability (bottom) vs the position of the peak t0 of the best fit function to the 2010 VHE data for the 2005 (left), 2008 (middle), and 2010 VHE data (right). Values are calculated for data points inside a time-span of t0-7 < tdata < t0+2. The gray bands mark the same time period as in Fig. 1 and 2, denoting periods of increased VHE activity. Dashed vertical lines mark the positions of VHE flares. The horizontal line in the bottom panels marks a probability of 5%.