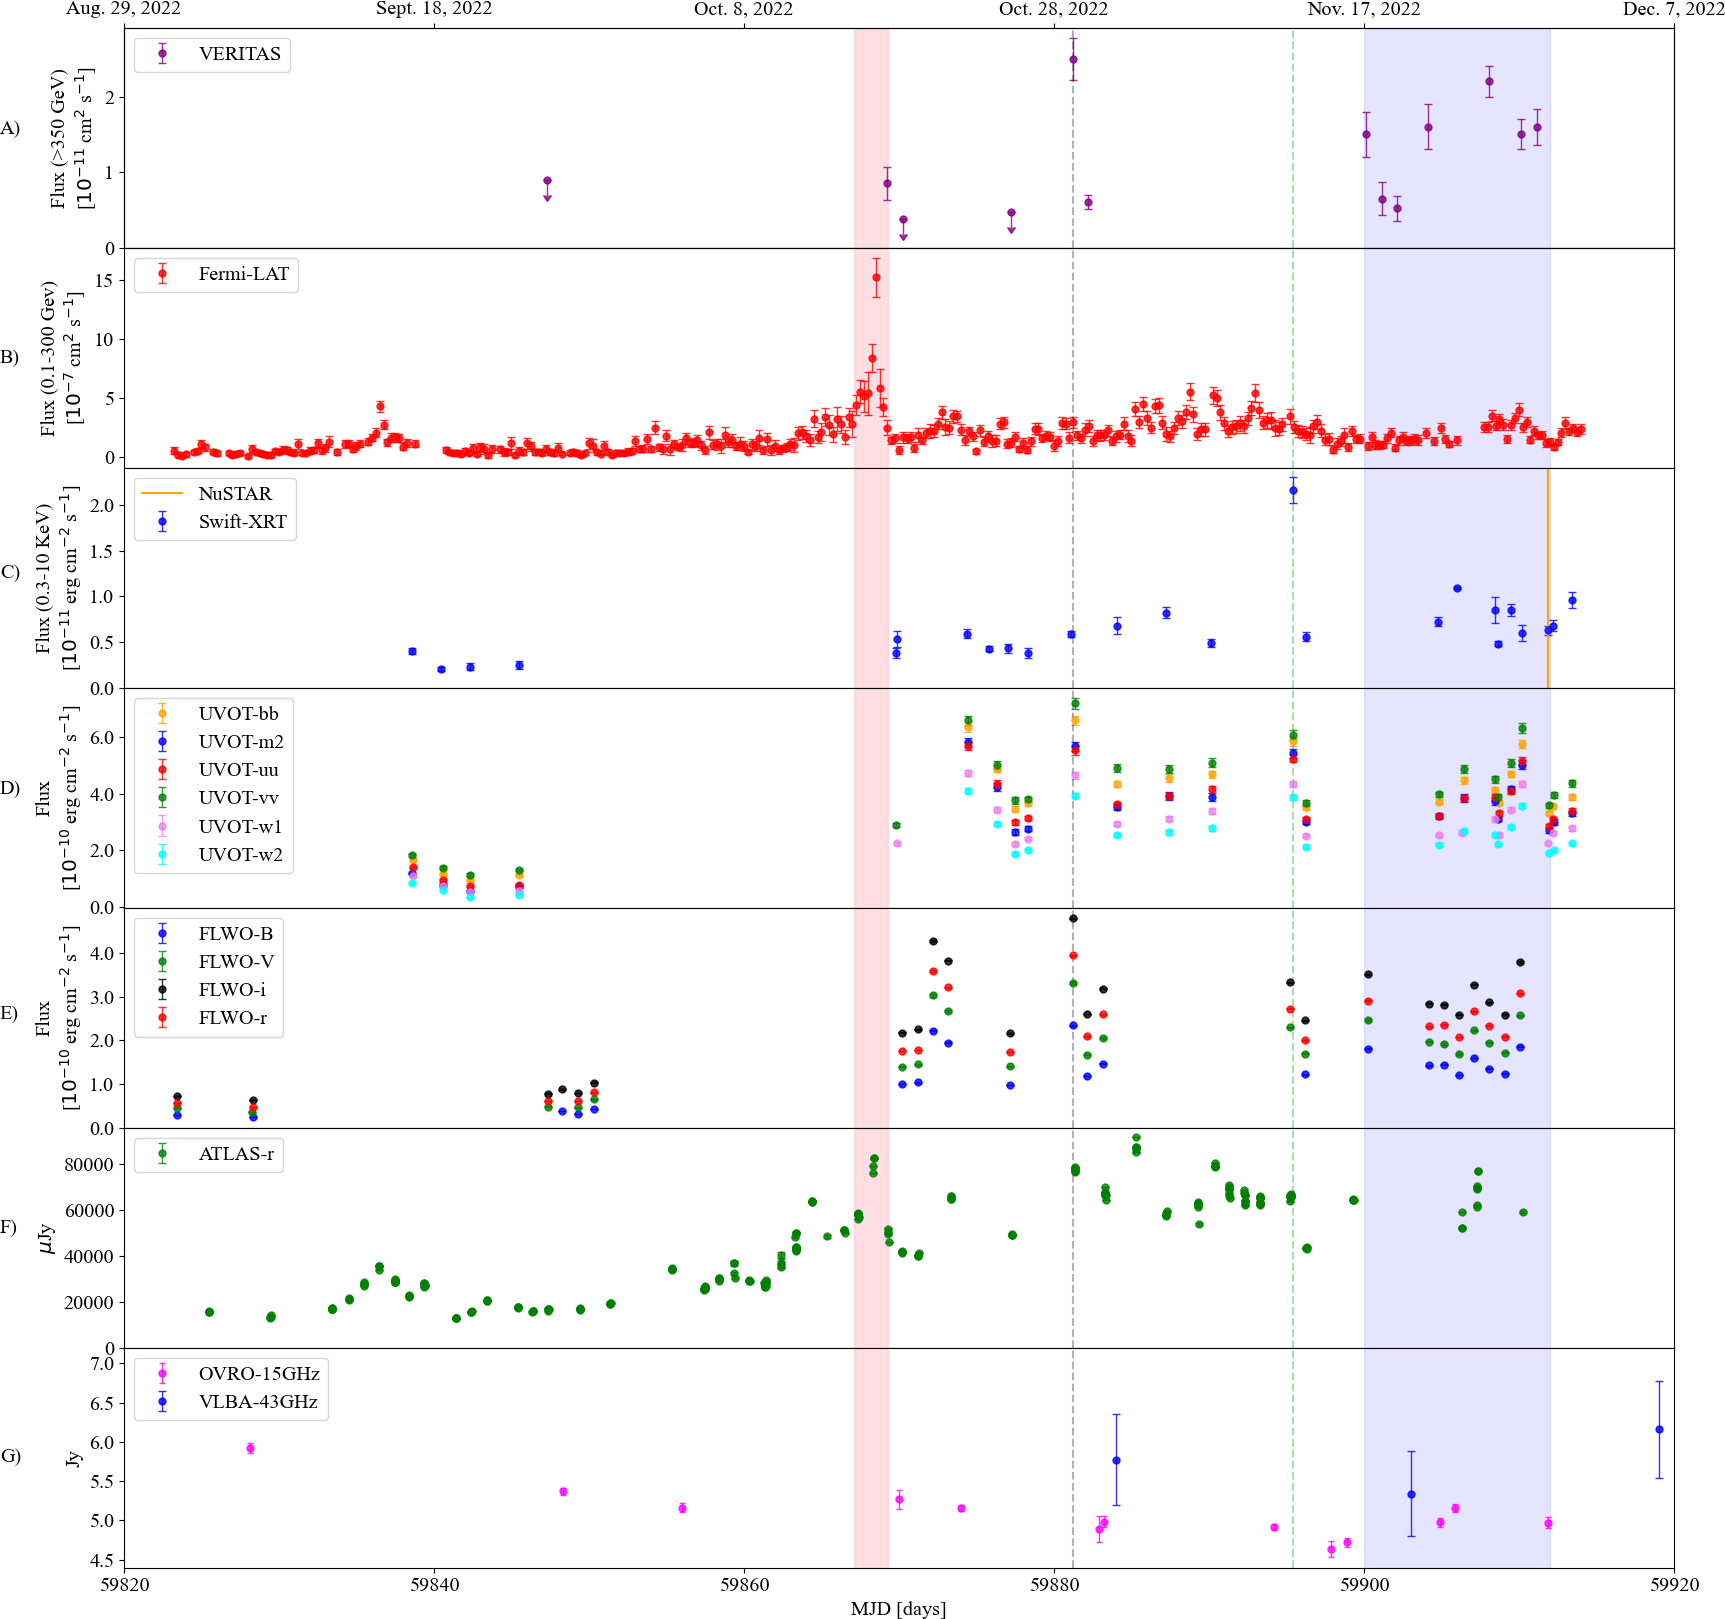
Multiwavelength observations of BL Lacertae between MJD 59823 and MJD 59914 (September 1, 2022- December 1, 2022). See Figure 2 below for more details.
Reference: A. Acharyya et al. (The VERITAS Collaboration and others); ApJ 1008, 176 (2026)
We report the first observations of a long-duration very-high-energy (VHE; E>100 GeV) flare from BLLacertae (VER J2202+422), taken with the Very Energetic Radiation Imaging Telescope Array System (VERITAS). On October 15, 2022, the Fermi-Large Area Telescope (LAT) detected elevated GeV activity originating from this blazar. This triggered a multiwavelength campaign, which includes observations from VERITAS, Swift, NuSTAR, and select optical and radio observatories. VERITAS observed the source for a total of ∼9.8 hours between September 1, 2022 and December 1, 2022. An analysis of these data yields a ∼28σ detection of the source. While previously observed VHE flares from BL Lacertae have lasted on time-scales of minutes to days, VERITAS continued to detect flaring activity from the source for over a month (∼40 days) after the original flaring activity was detected with Fermi-LAT. Broadband spectral modeling shows that a synchrotron self-Compton (SSC) model with an external inverse-Compton (EC) component is preferred over a one-zone SSC model.
FITS files: N/A
Figures from paper (click to get full size image):
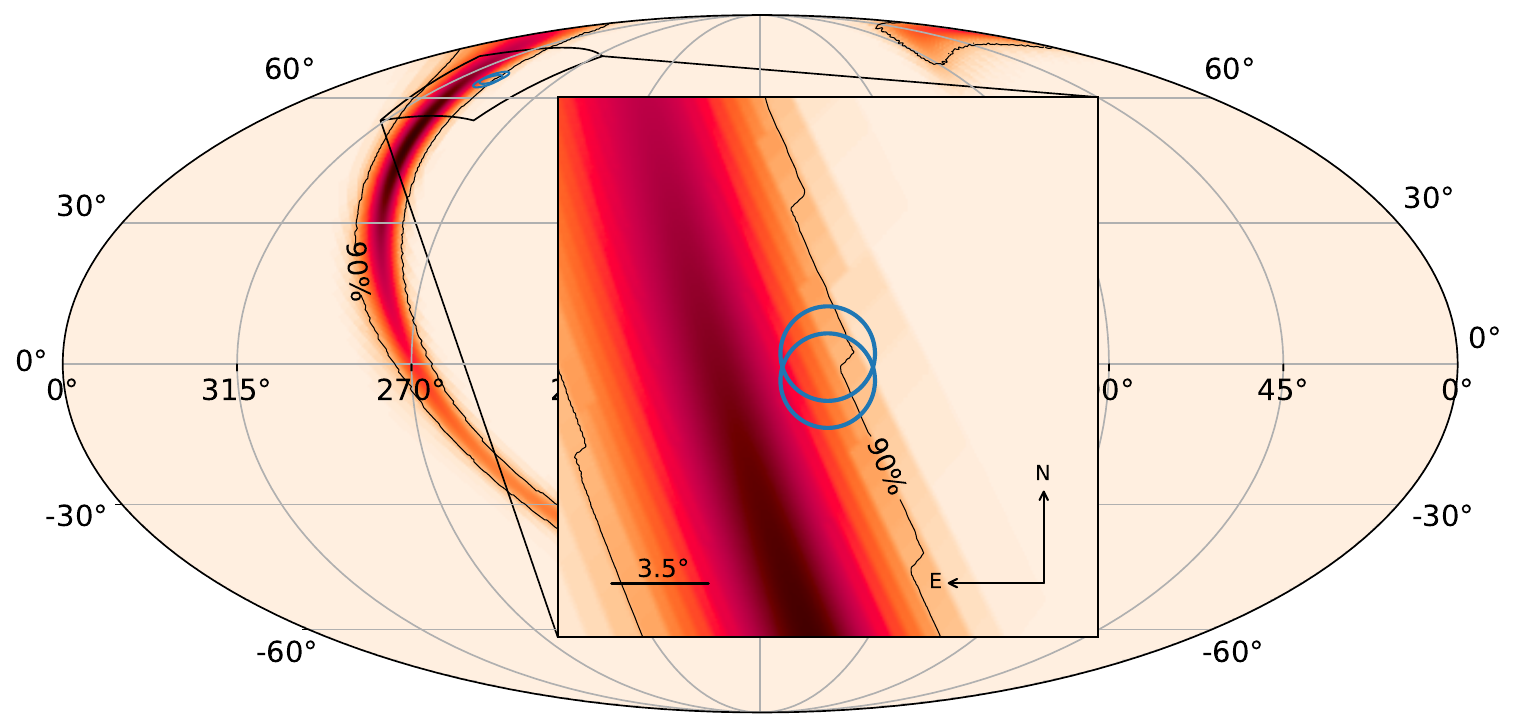
Figure 1: Left: Skymap of the significance observed by VERITAS during the epoch of interest (September 1, 2022 UTC December 1, 2022 UTC; 59823- 59914 MJD inclusive) from the direction of BL Lacertae. The extent of the VHE source is consistent with the VERITAS point-spread function (PSF). The PSF in this analysis is reduced from prior publications due to the use of the Image Template Method γ-ray reconstruction (Christiansen 2017). The PSF reference size is indicated by the white ring located in the bottom left corner of the map. Right: The VHE photon spectrum of BLLacertae observed by VERITAS (red points). The best-fit power-law function is indicated by the solid blue line, and shaded blue region corresponding to a 1σ bounds. The best-fit log-parabola function is indicated by the dashed green line, and shaded green region corresponding to a 1σ bounds.
Figure 2: Multiwavelength observations of BL Lacertae between MJD 59823 and MJD 59914 (September 1, 2022- December 1, 2022). The pink and purple narrow bands correspond to the GeV flare epoch and the elevated VHE activity epoch respectively. Vertical dashed grey line indicates October 29, 2022, associated with short-term elevated VHE activity. Vertical dashed green line indicated November 12, 2022, associated with enhanced X-ray activity. (A) VHE lightcurve for VERITAS observations above an energy threshold of 350 GeV binned per day. Upper limits at 99% confidence level are quoted for observations with a significance lower than 5σ. (B) Fermi-LAT lightcurve in 6 hour bins in the 0.1–300 GeV band. Gaps correspond to a significance less than 2σ. (C) Swift-XRT absorption-corrected flux observations in the 0.3–10 keV band. The timing of the NuSTAR observation is indicated by the orange vertical line. (D) Swift-UVOT flux observations in the w1, w2, m2, uu, bb, and vv band filters. (E) Optical lightcurve in r, i, V, and B filters using data from the 48” optical telescope at the FLWO. The errors plotted are statistical uncertainties only. (F) Optical flux observations with ATLAS in the r-band. (G) Radio flux observations at 15 GHz with OVRO and 43 GHz with VLBA.
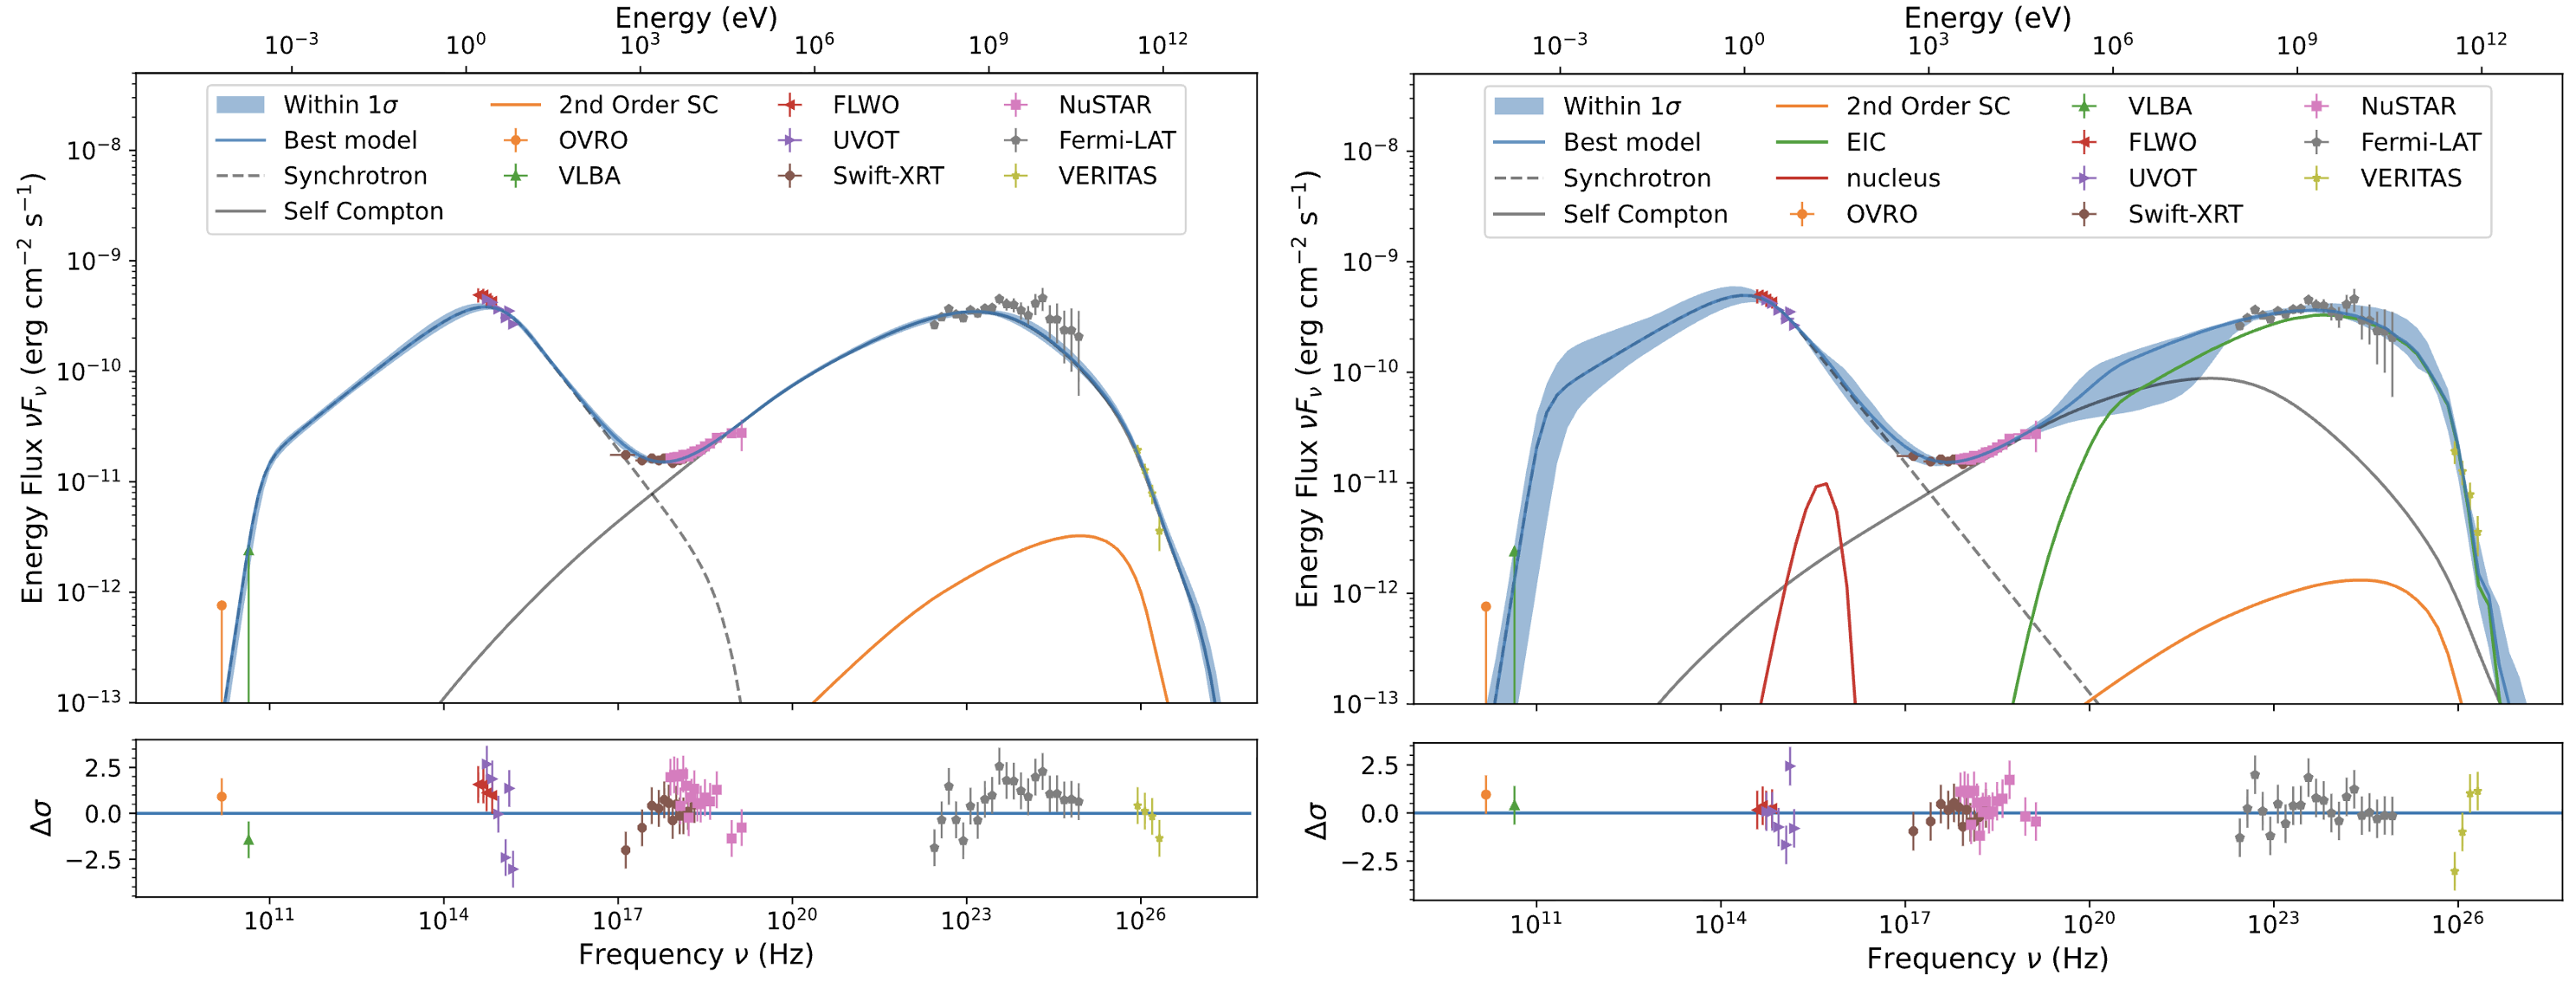
Figure 3: Left: Broadband SED for BL Lacertae during the VERITAS elevated VHE activity epoch. The radio SED points from OVRO and VLBA are treated as upper limits for modeling purposes due to a larger integration region, potentially contaminated by extended jet emission. This SED is fit to a single-zone SSC model. Right: The same SED is fit to an SSC model with an additional external inverse-Compton component.