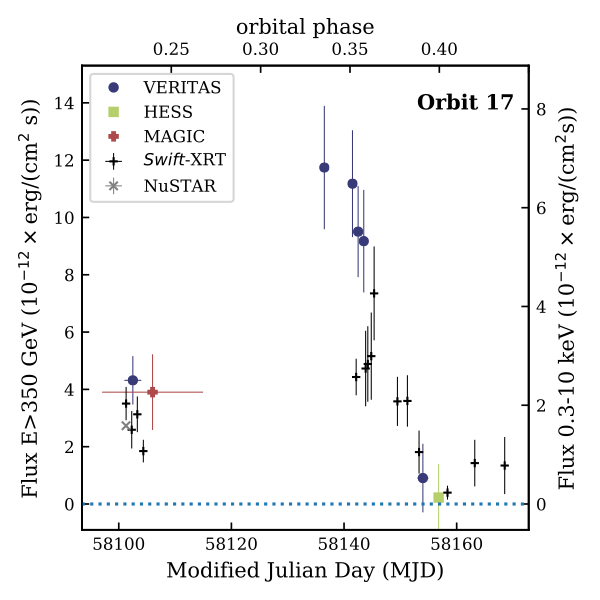
The radio galaxy NGC 1275 is the Brightest Cluster Galaxy in the Perseus cluster. It is well-studied across all wavebands, including Very High Energy (VHE; E>100GeV) gamma-rays, and with radio observations over the last 20 years tracking an unusual radio component, "C3". NGC 1275 was observed in an exceptional VHE flaring state between 2016 December 31 and 2017 January 3. The flare peak reached ~1.5 Crab units as measured by the MAGIC observatory. We report on the observations of NGC1275 conducted by VERITAS and multi-wavelength data collected during this flaring state, and for context, data taken between 2009 and 2017 inclusive. VERITAS detected the declining state of the flare on 2017 January 2 (MJD 57755) and 3 (MJD 57756) at an average flux state of 0.5 Crab units. VERITAS spectra show an overall long-term trend of harder-when-brighter. During the flare, the gamma-ray spectrum obtained from the combined Fermi-LAT, MAGIC, and VERITAS observations, changes from a power law with an exponential cut-off on January 1 to a log-parabola on January 2. To study the evolution of the flare in more detail, multi-band spectral energy distributions (SEDs) were constructed for the nights of 2017 January 1 and 2 corresponding to the shift from the peak to the decline of the flare. A blob-in-jet modeling of the SEDs results in support for a two-component model with a jet angle of 10 degrees to the line of sight and the gamma-ray emission zone located in the vicinity of the C3 radio component.
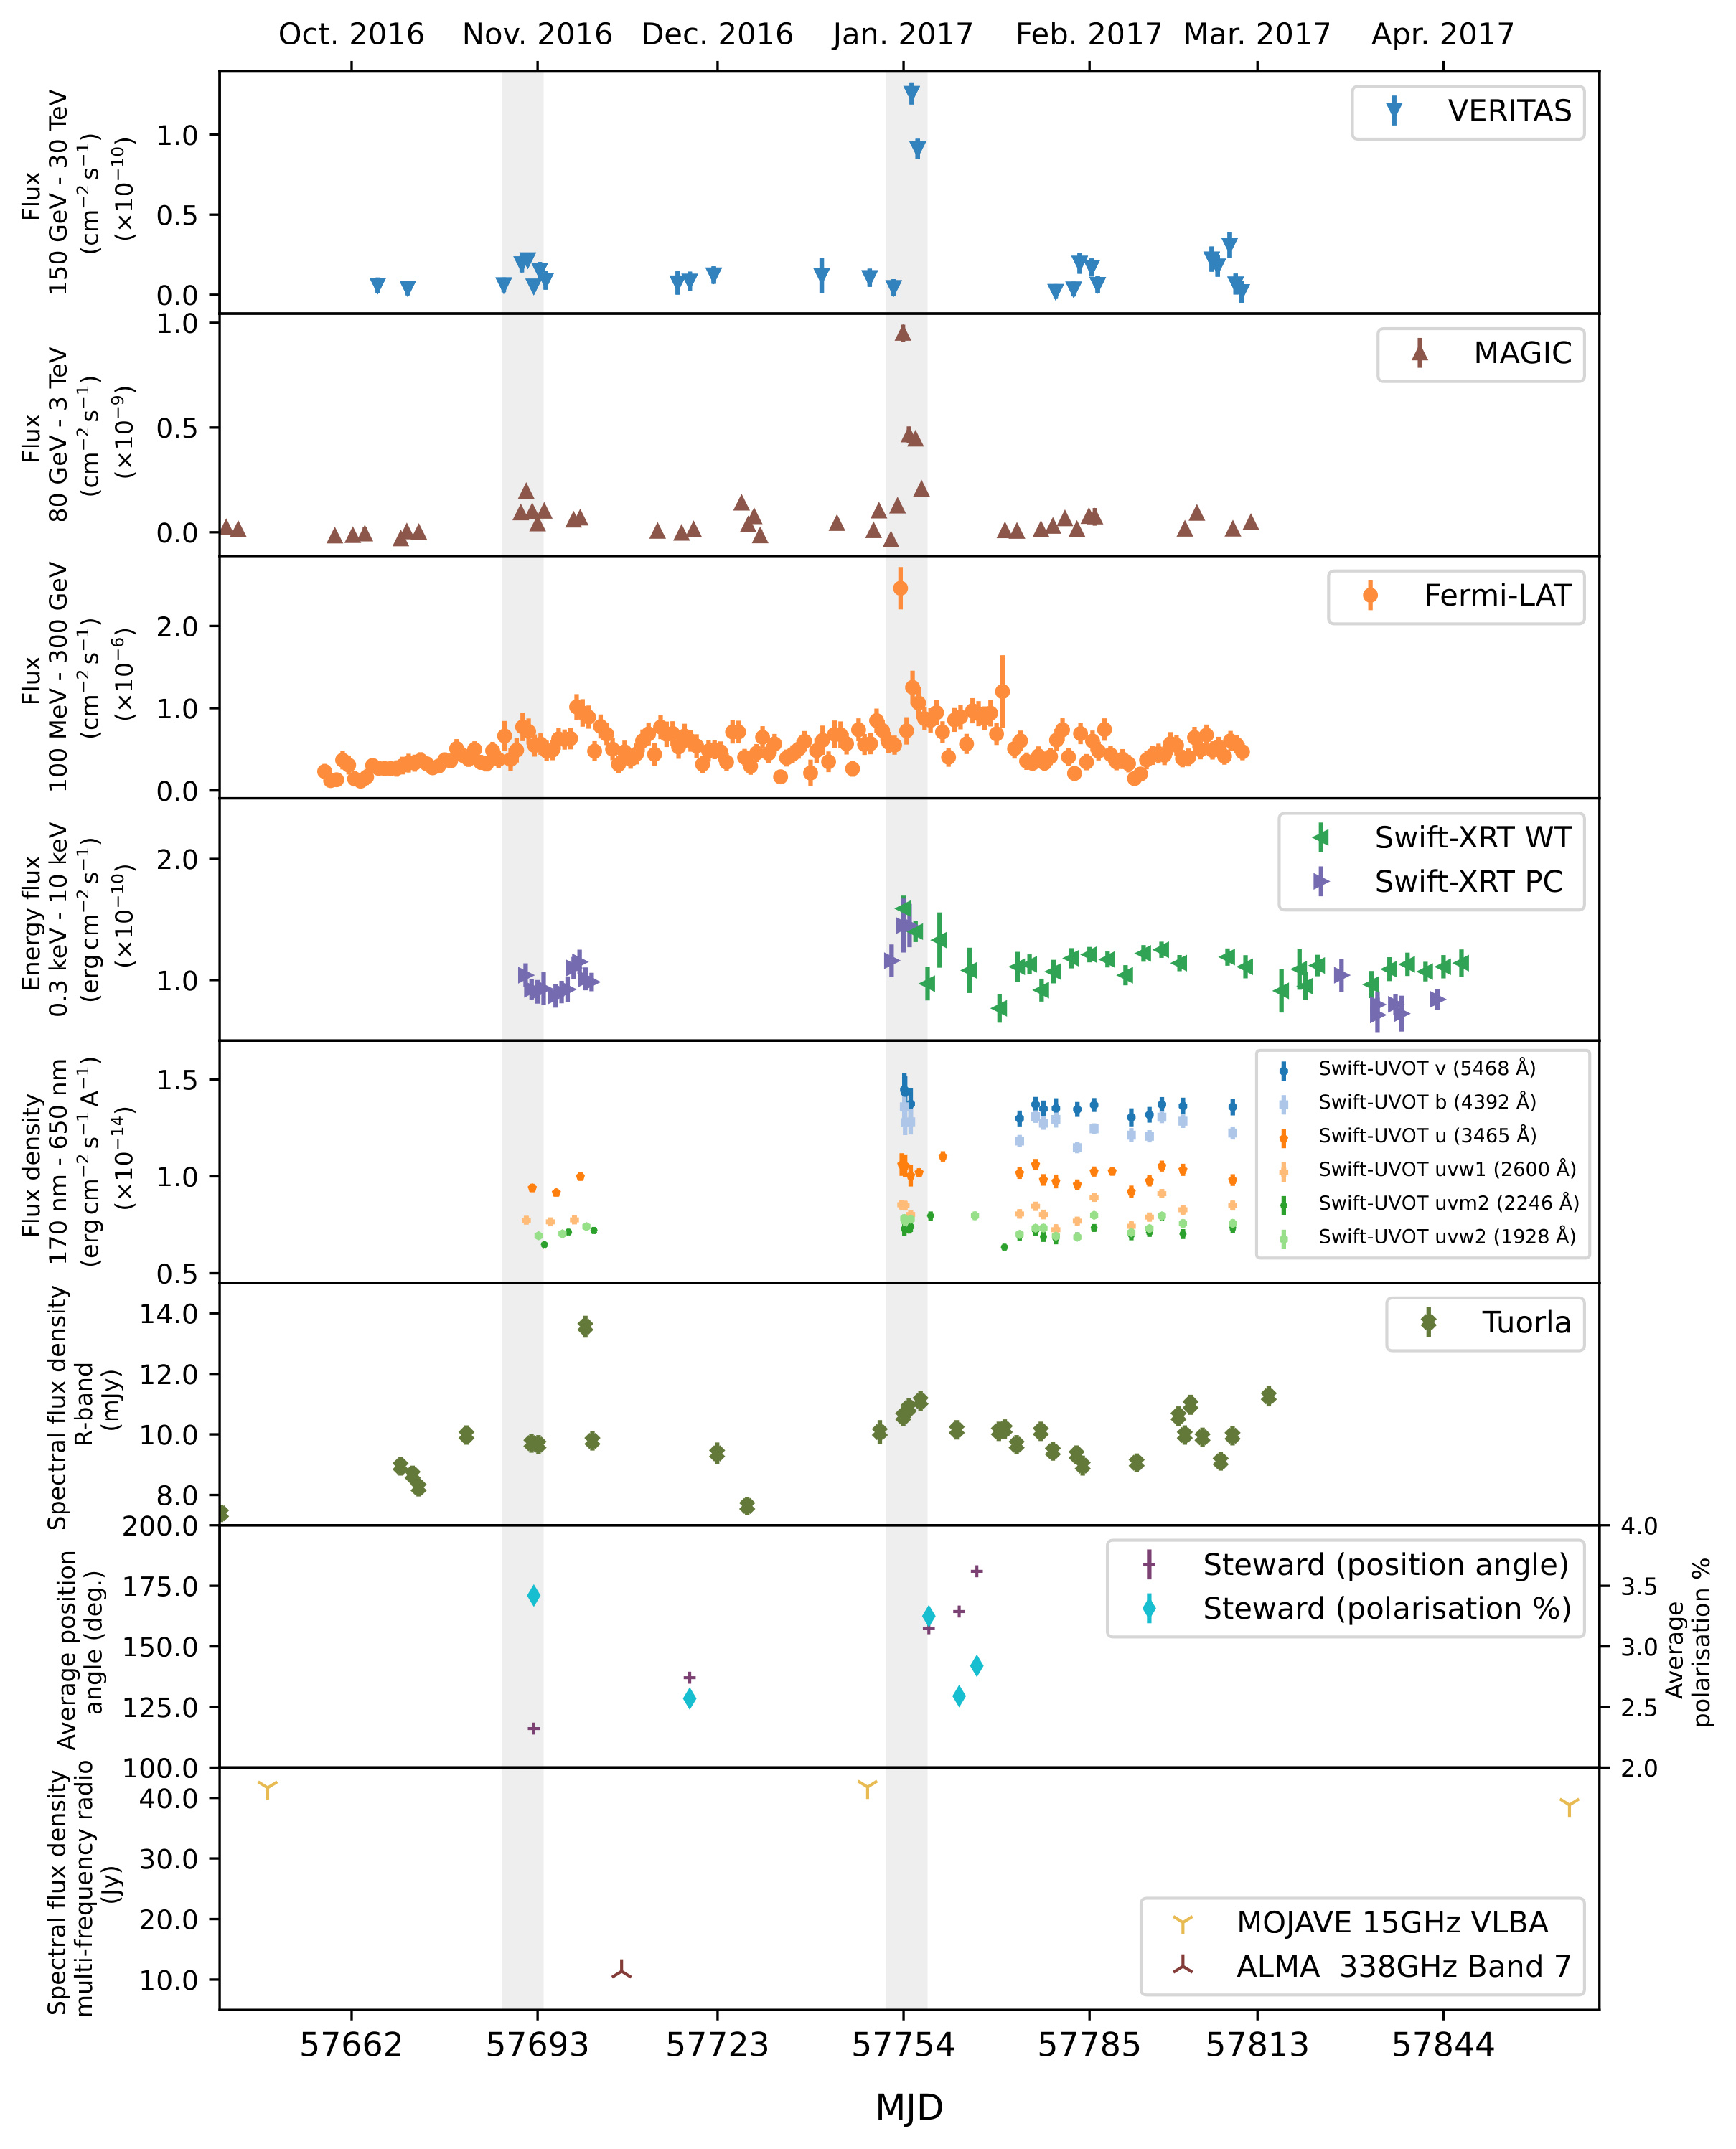
Figure 1: The daily-binned multiwavelength light curve of NGC1275 for the VERITAS observing season 2016/17. The light curves include data recorded with VERITAS (first/top panel), MAGIC [MAGIC Collaboration et al. 2018] (second panel), Fermi-LAT (third panel), Swift-XRT(fourth panel), Swift-UVOT (fifth panel), Tuorla [MAGIC Collaboration et al. 2018] (sixth panel), Steward Optical Polarization percentage and Position Angle (seventh panel), and finally MOJAVE [Lister et al. 2018] and ALMA (eighth/bottom panel). The Swift-XRT data includes observations for both the Windowed Timing mode (green points) and the Photon Counting mode (purple points). The gray vertical bands each highlight a 7-day period centered on 2016 October 29 and 2017 January 1 respectively.
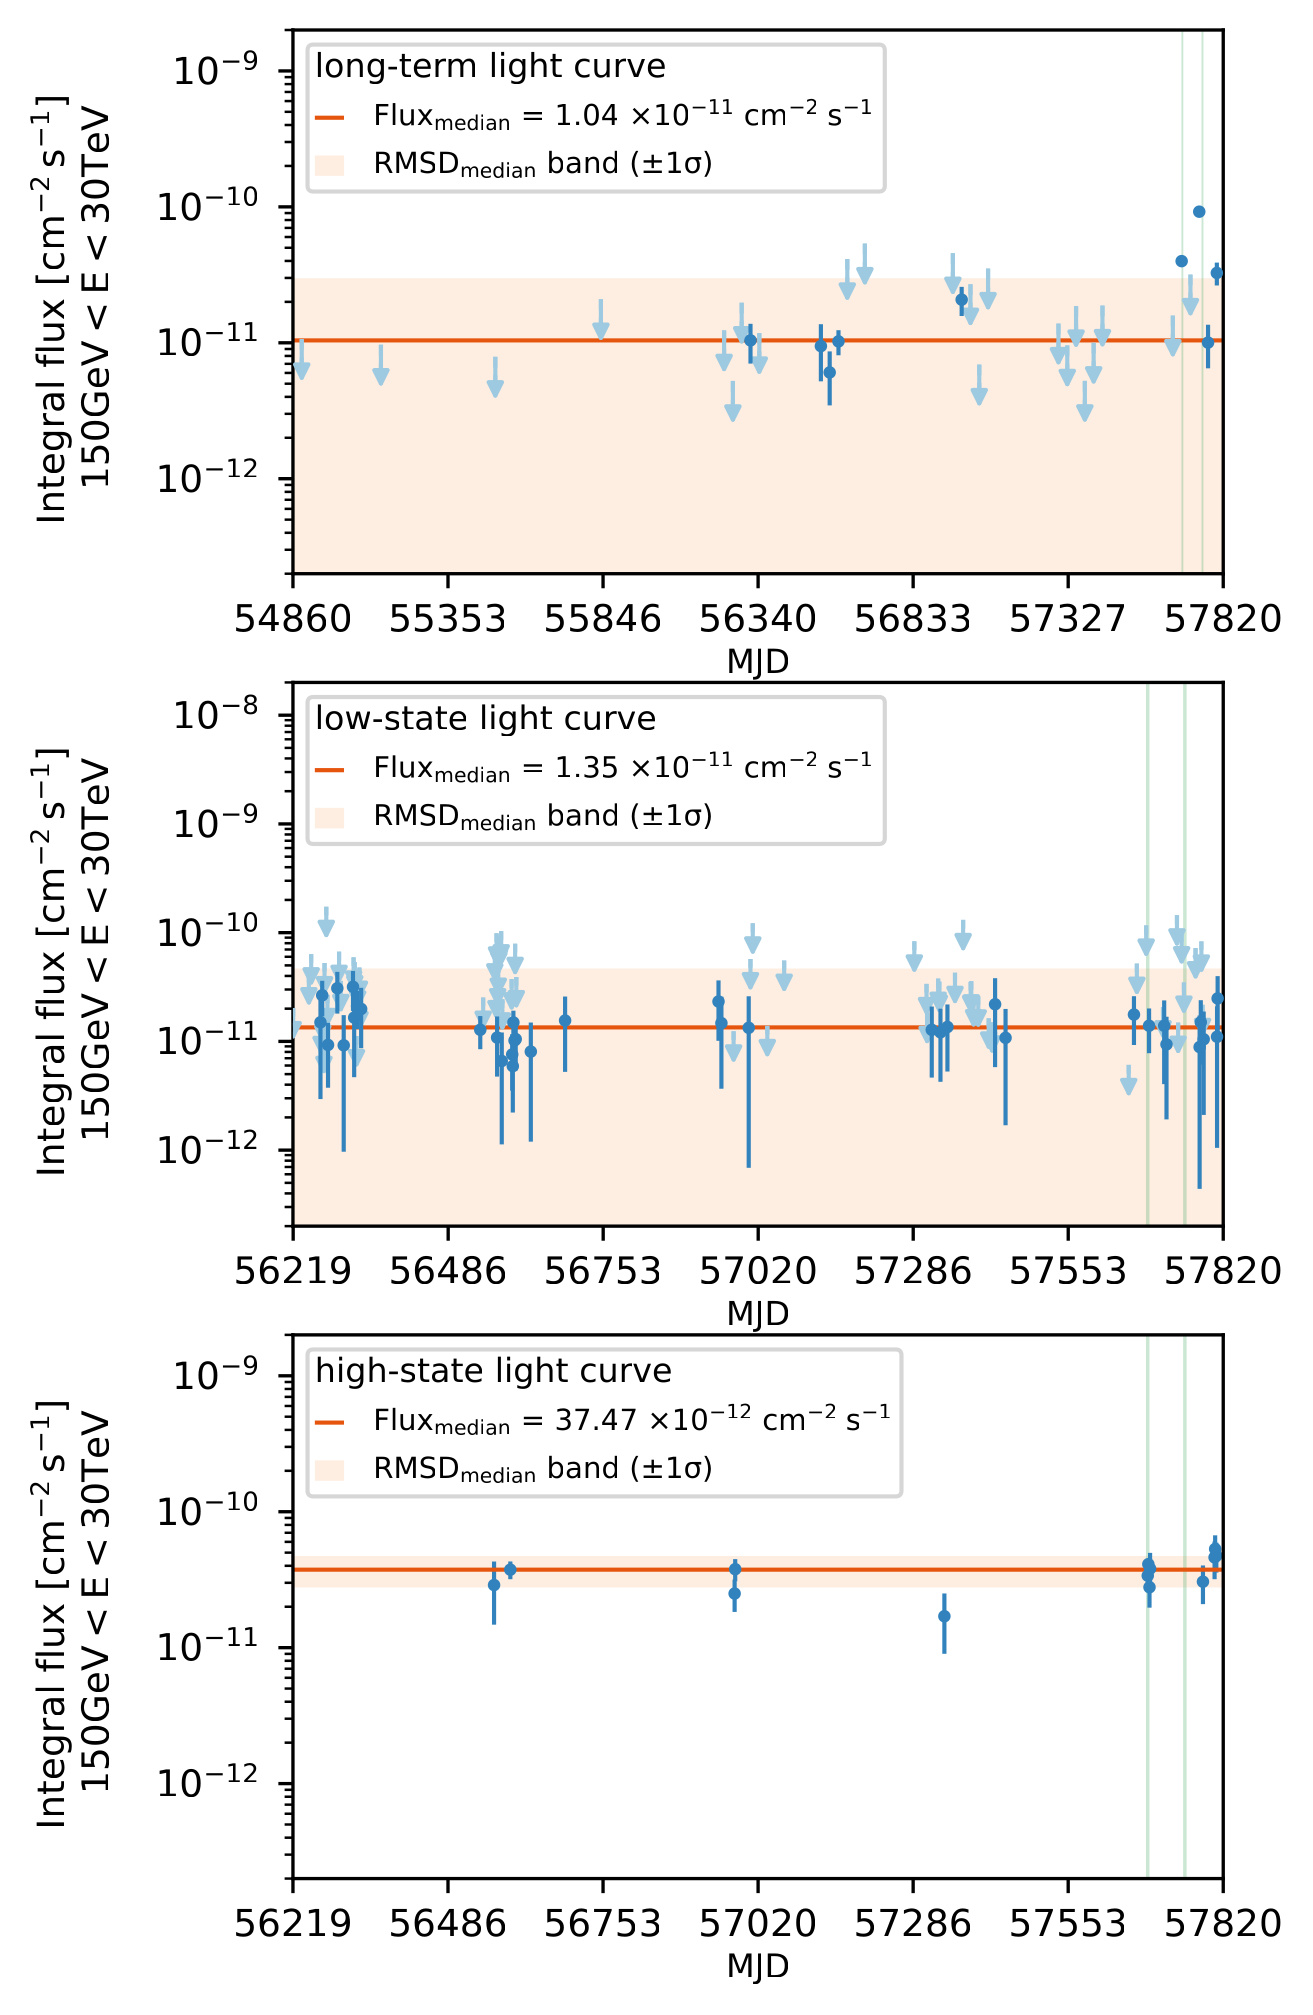
Figure 2: Top panel: long-term VERITAS TeV light curve for all 4-telescope observations of radio galaxy NGC 1275 for the energy range 0.15 TeV ⩽ E ⩽ 30 TeV, spanning more than 8-years (2009-2017) and binned in 28-day intervals. The median flux (solid orange line) and 1σ root mean squared deviation (RMSD; orange band) are shown, with 95% confidence-level upper limits plotted for flux points < 2σ. Center panel: average low-state light curve calculated for NGC 1275 during 2012 October to 2017 June, with median flux and 1σ RMSD as above; here 95% confidence-level upper limits are shown for flux points < 1σ. Bottom panel: average high-state light curve calculated for NGC 1275 during 2012 September to 2017 June, with median flux and 1σ RMSD. The two vertical green lines mark the 2016 October 31 and 2017 January 1 flares respectively.
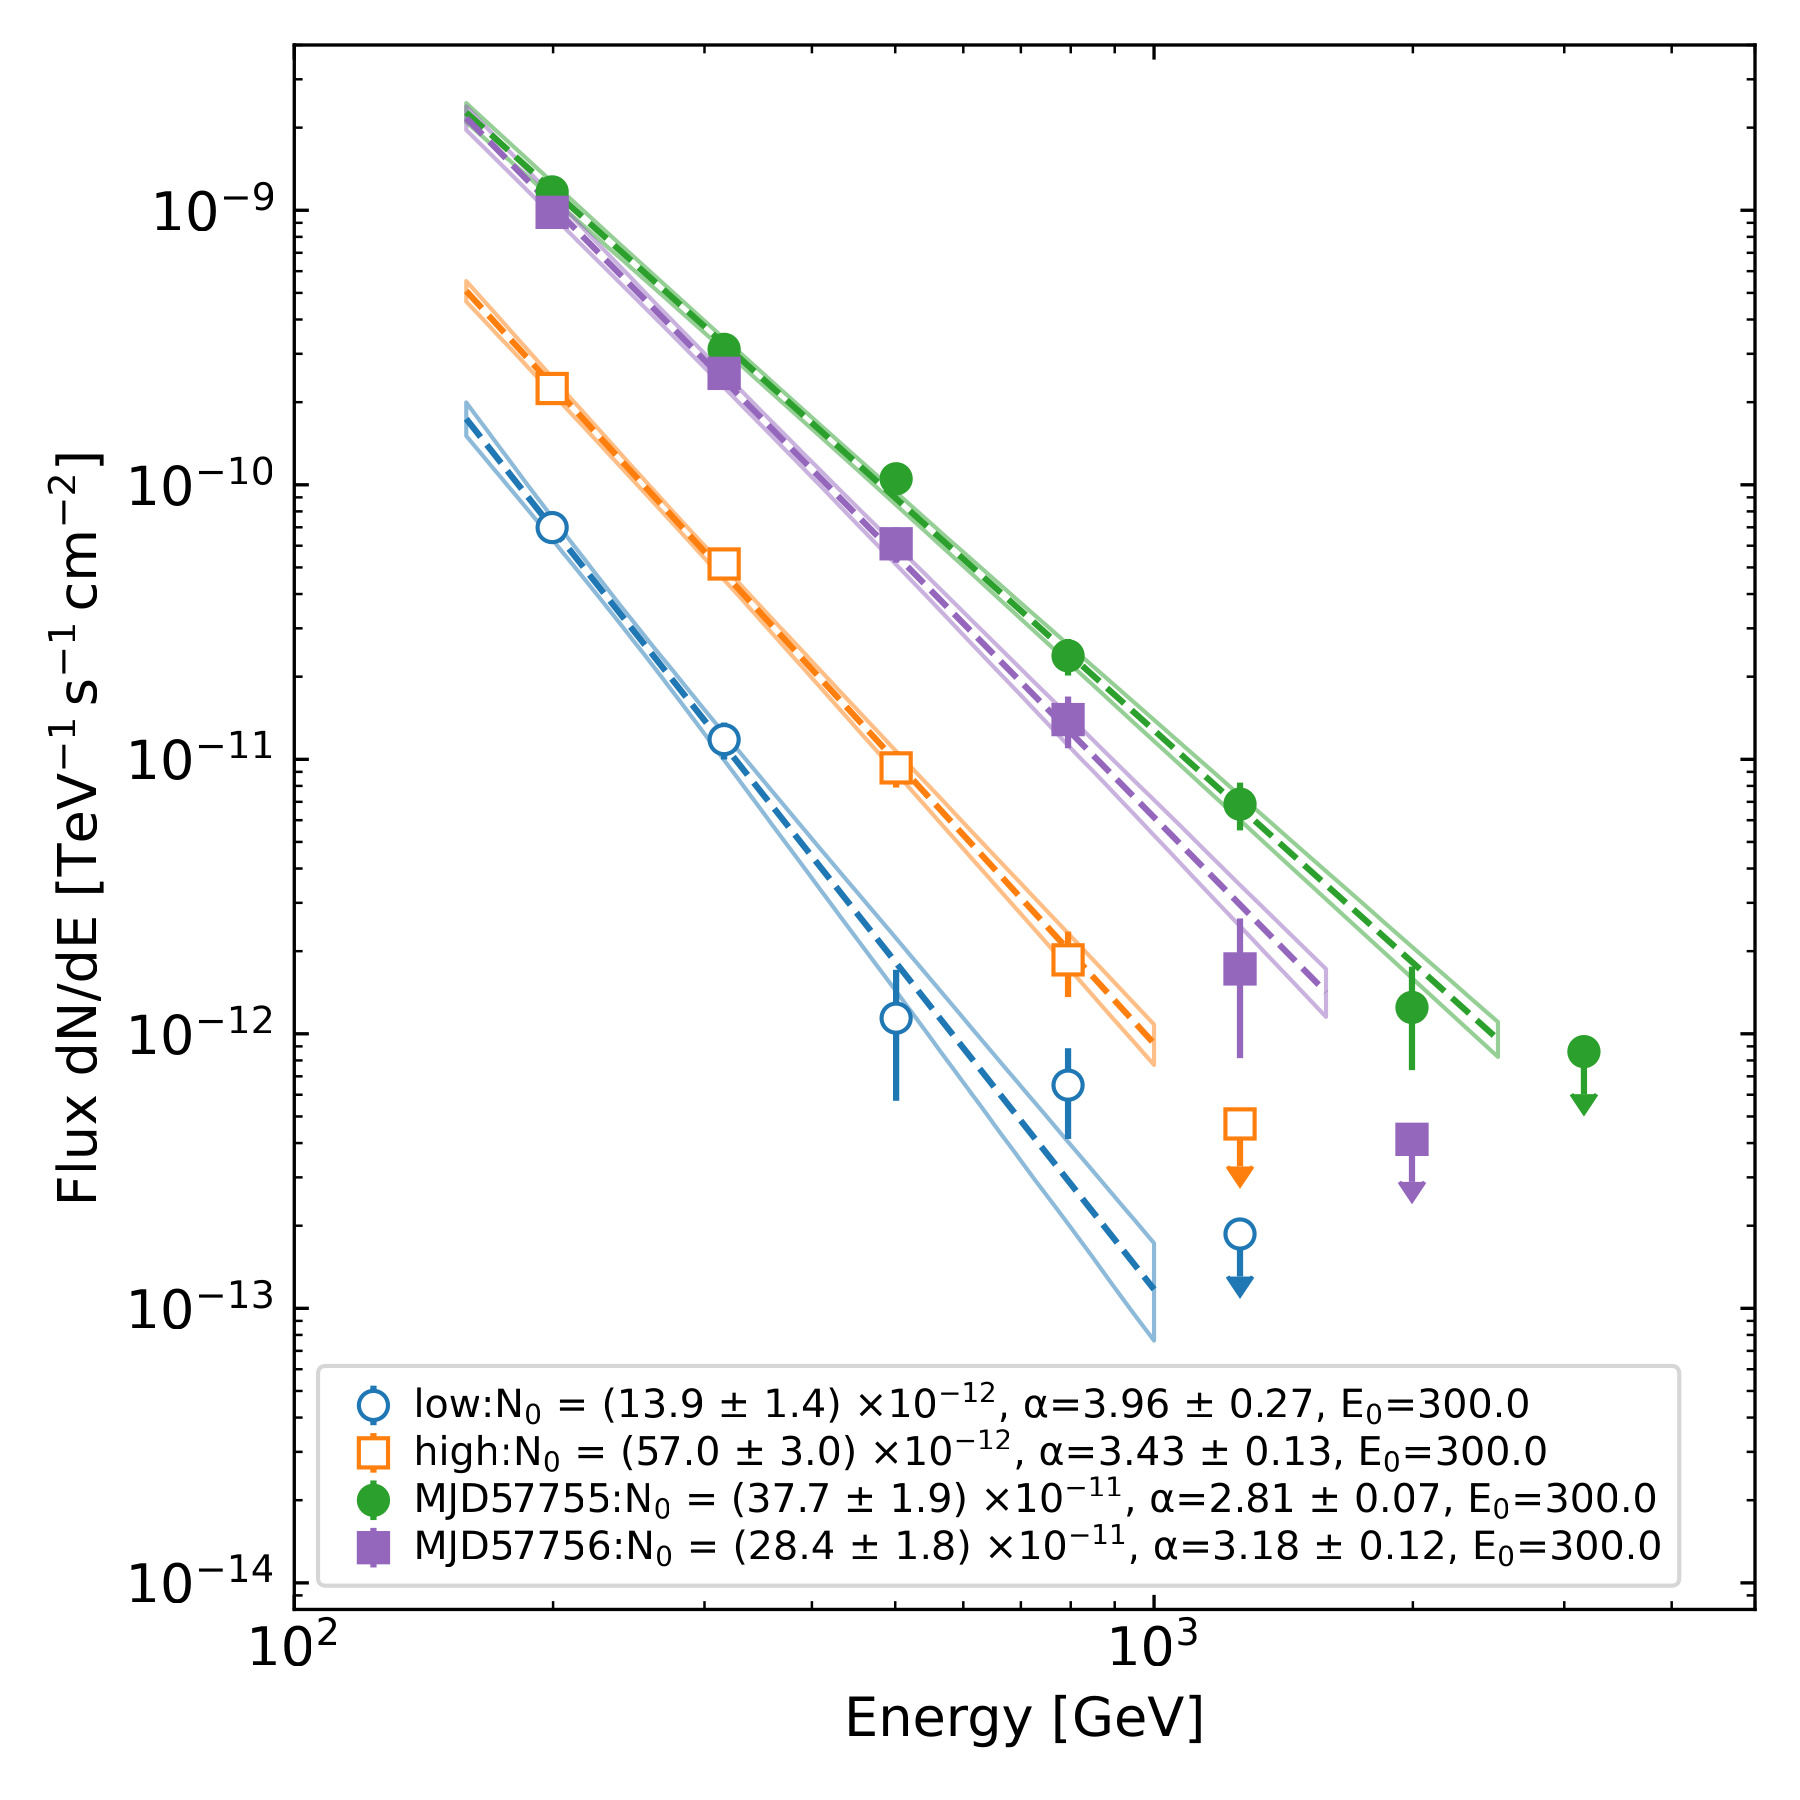
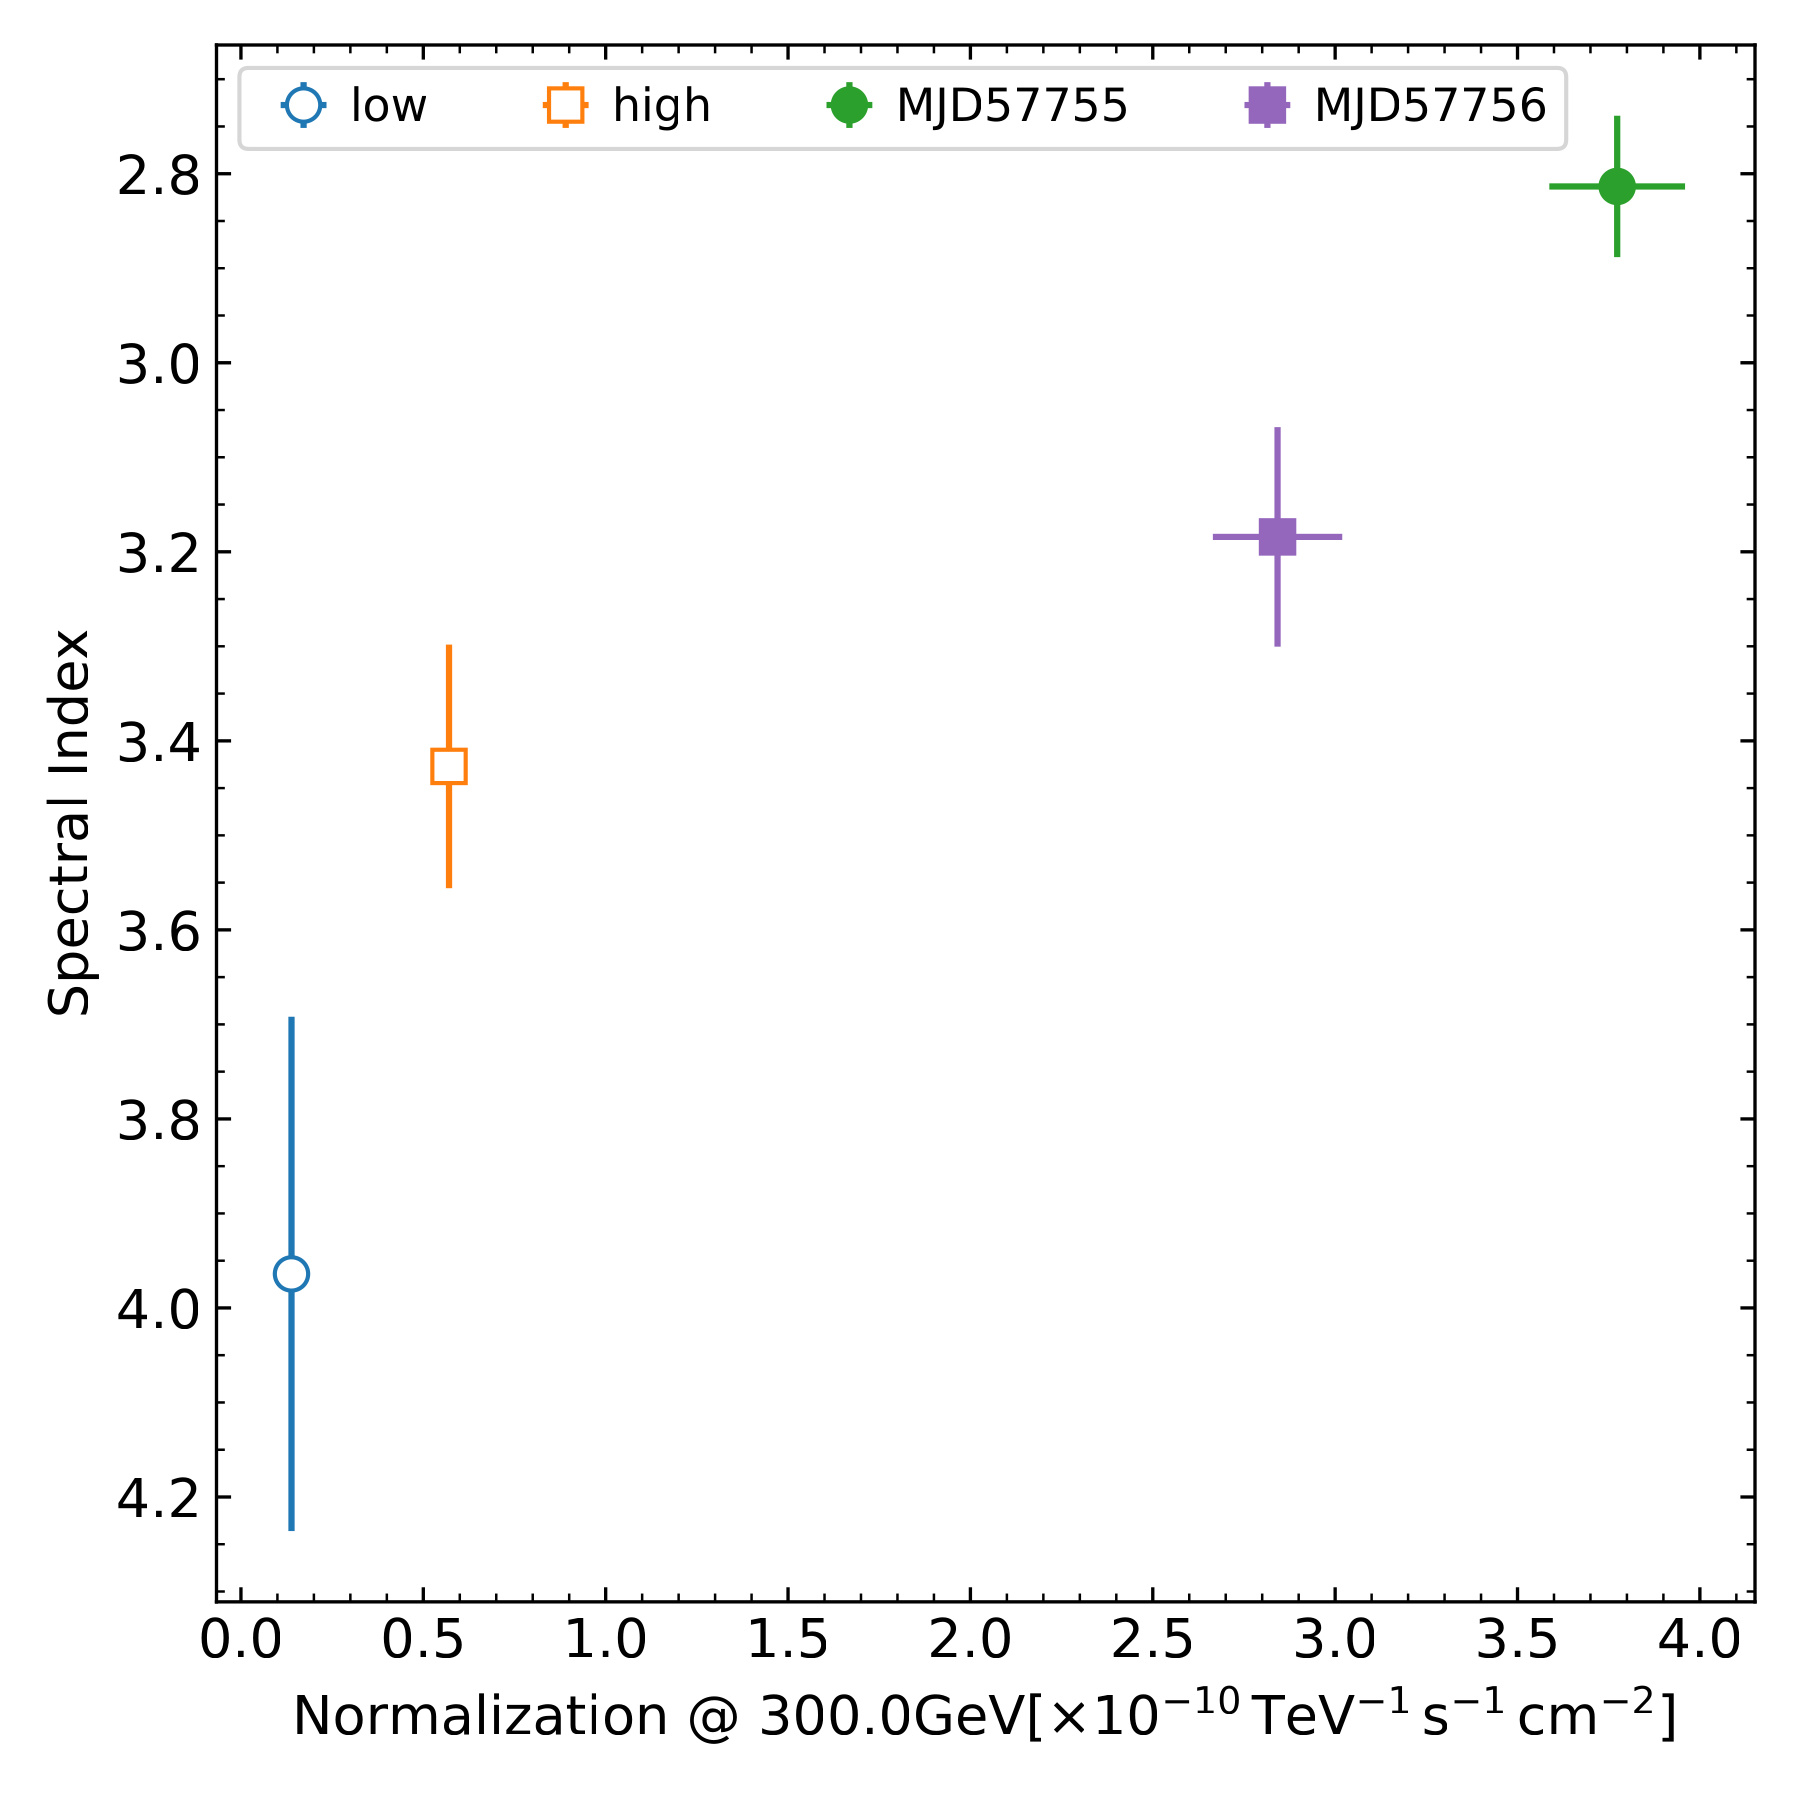
Figure 3: The spectra calculated for the average lowstate (open blue circles), the average high-state (open orange squares) and for the extreme-high-state flares that occurred on MJD57755 (green-filled circles) and MJD57756 (purple-filled squares). For each of these states, the VHE γ-ray emission falls according to a power law spectrum. As NGC 1275 increases in flux brightness the spectral indices get harder and detected spectra extend to higher energies.
Figure 4: The spectral index of the fitted power laws for each state hardens as the recorded flux brightness increases from low-state (open blue circle) to high-state (open orange square) and even during the two flares of extreme-high-state: MJD57755 (green-filled circle) and MJD57756 (purple-filled square). Note that the direction of the y-axis is inverted.
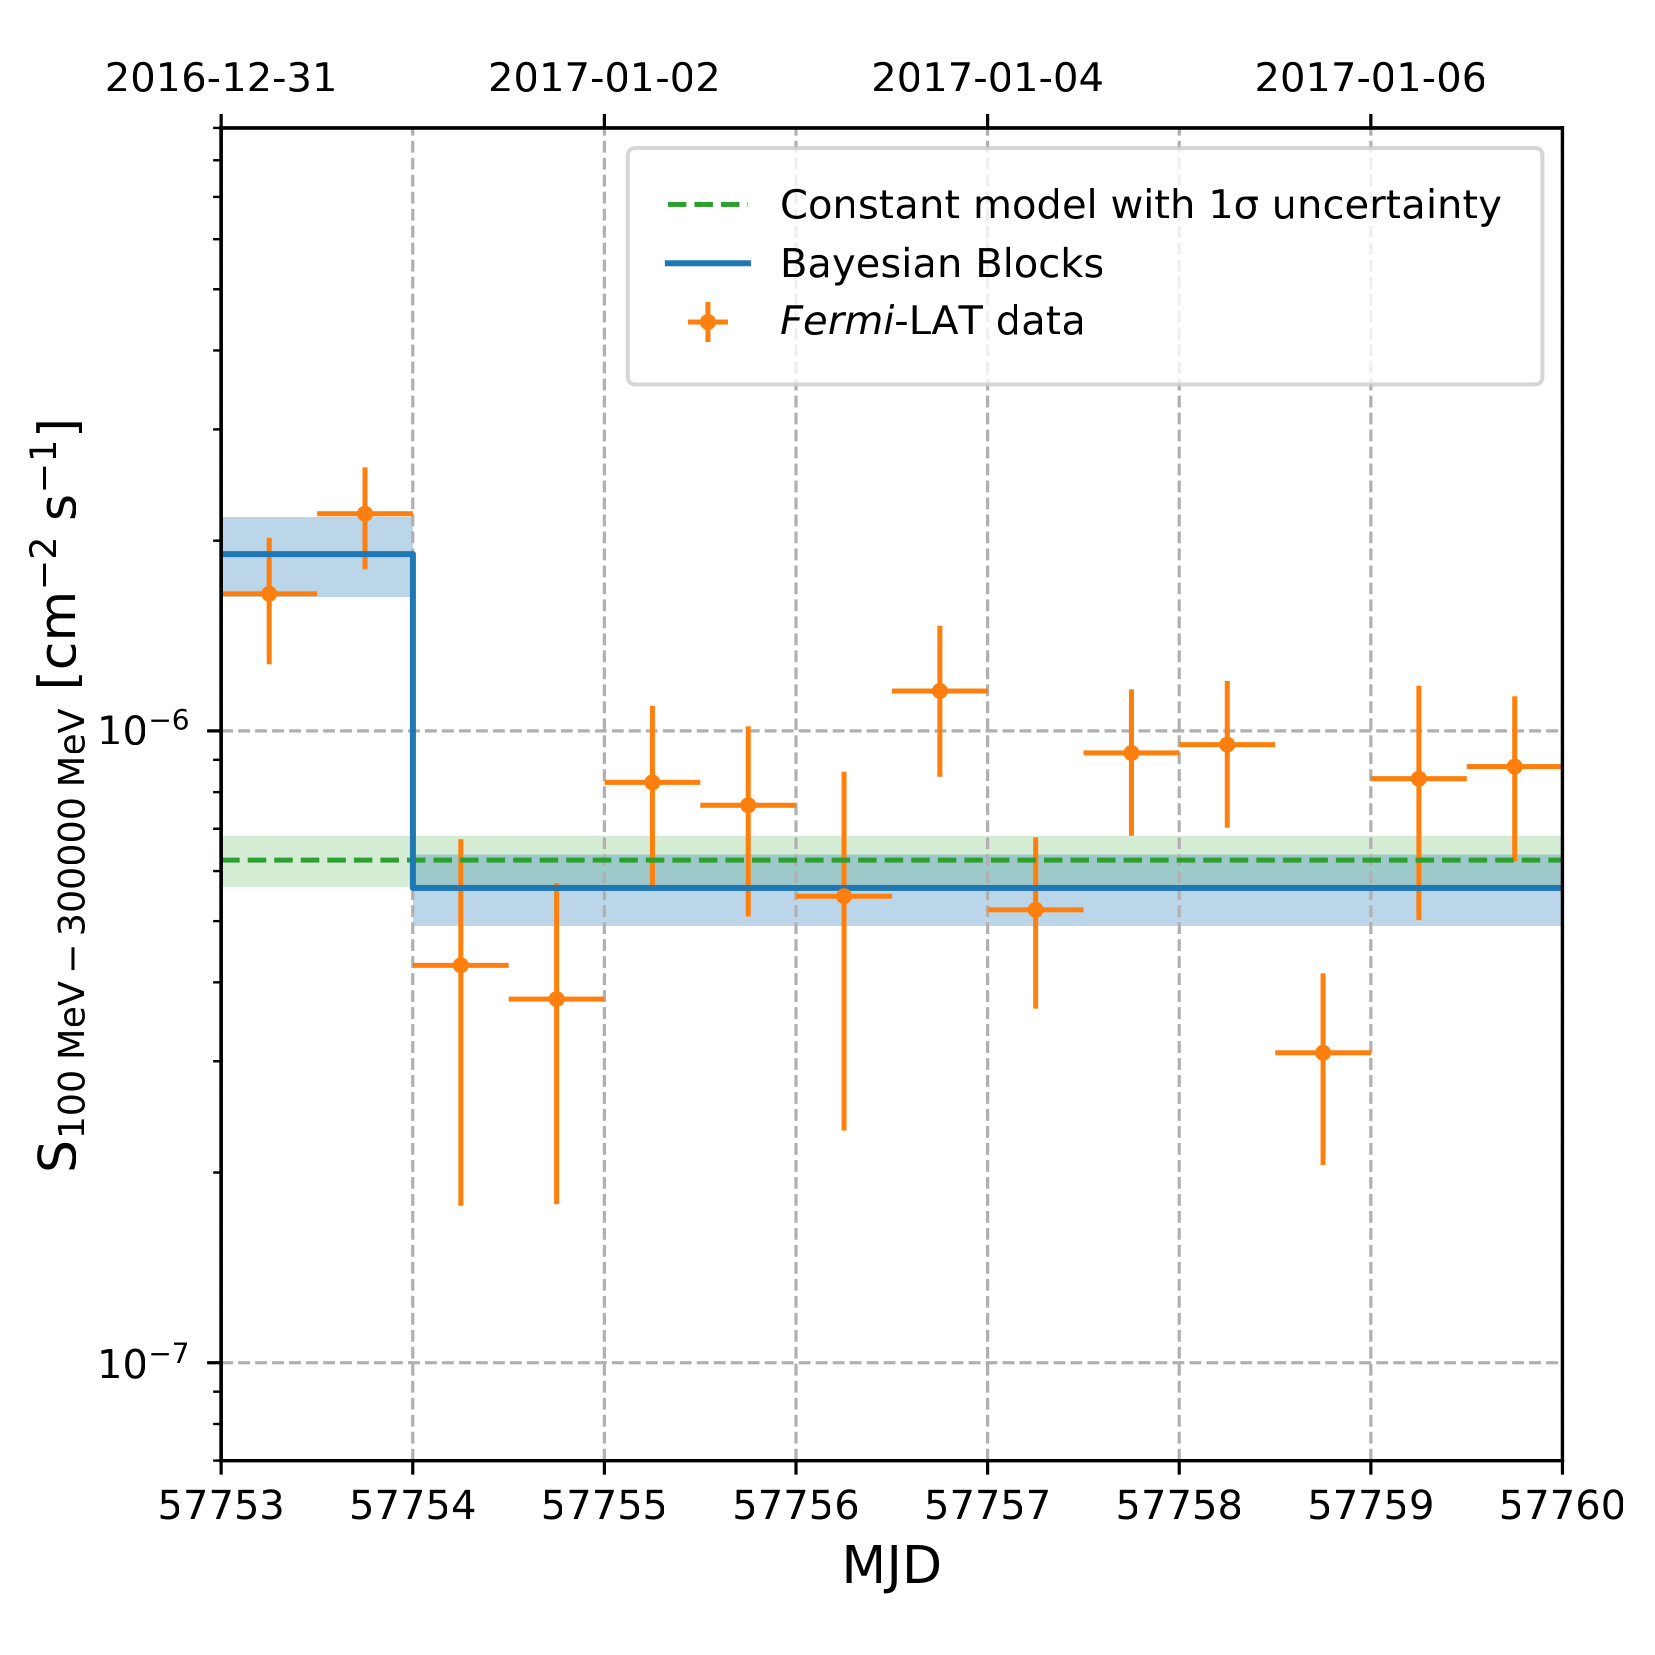
Figure 5: The Fermi-LAT NGC 1275 flux versus time for the period MJD 57753 – MJD 57760 spanning the 2017 flare detected at VHE energies. The orange points show the 12-hour binned light curve data and the solid blue line the mean flux for optimal Bayesian block binning including uncertainty (blue shaded band). For reference we also show a constant model (dashed green line) fitted to the data including the 68% confidence bound of this fit (green shaded band). The reduced chi-squared statistic for this fit was 3.32.
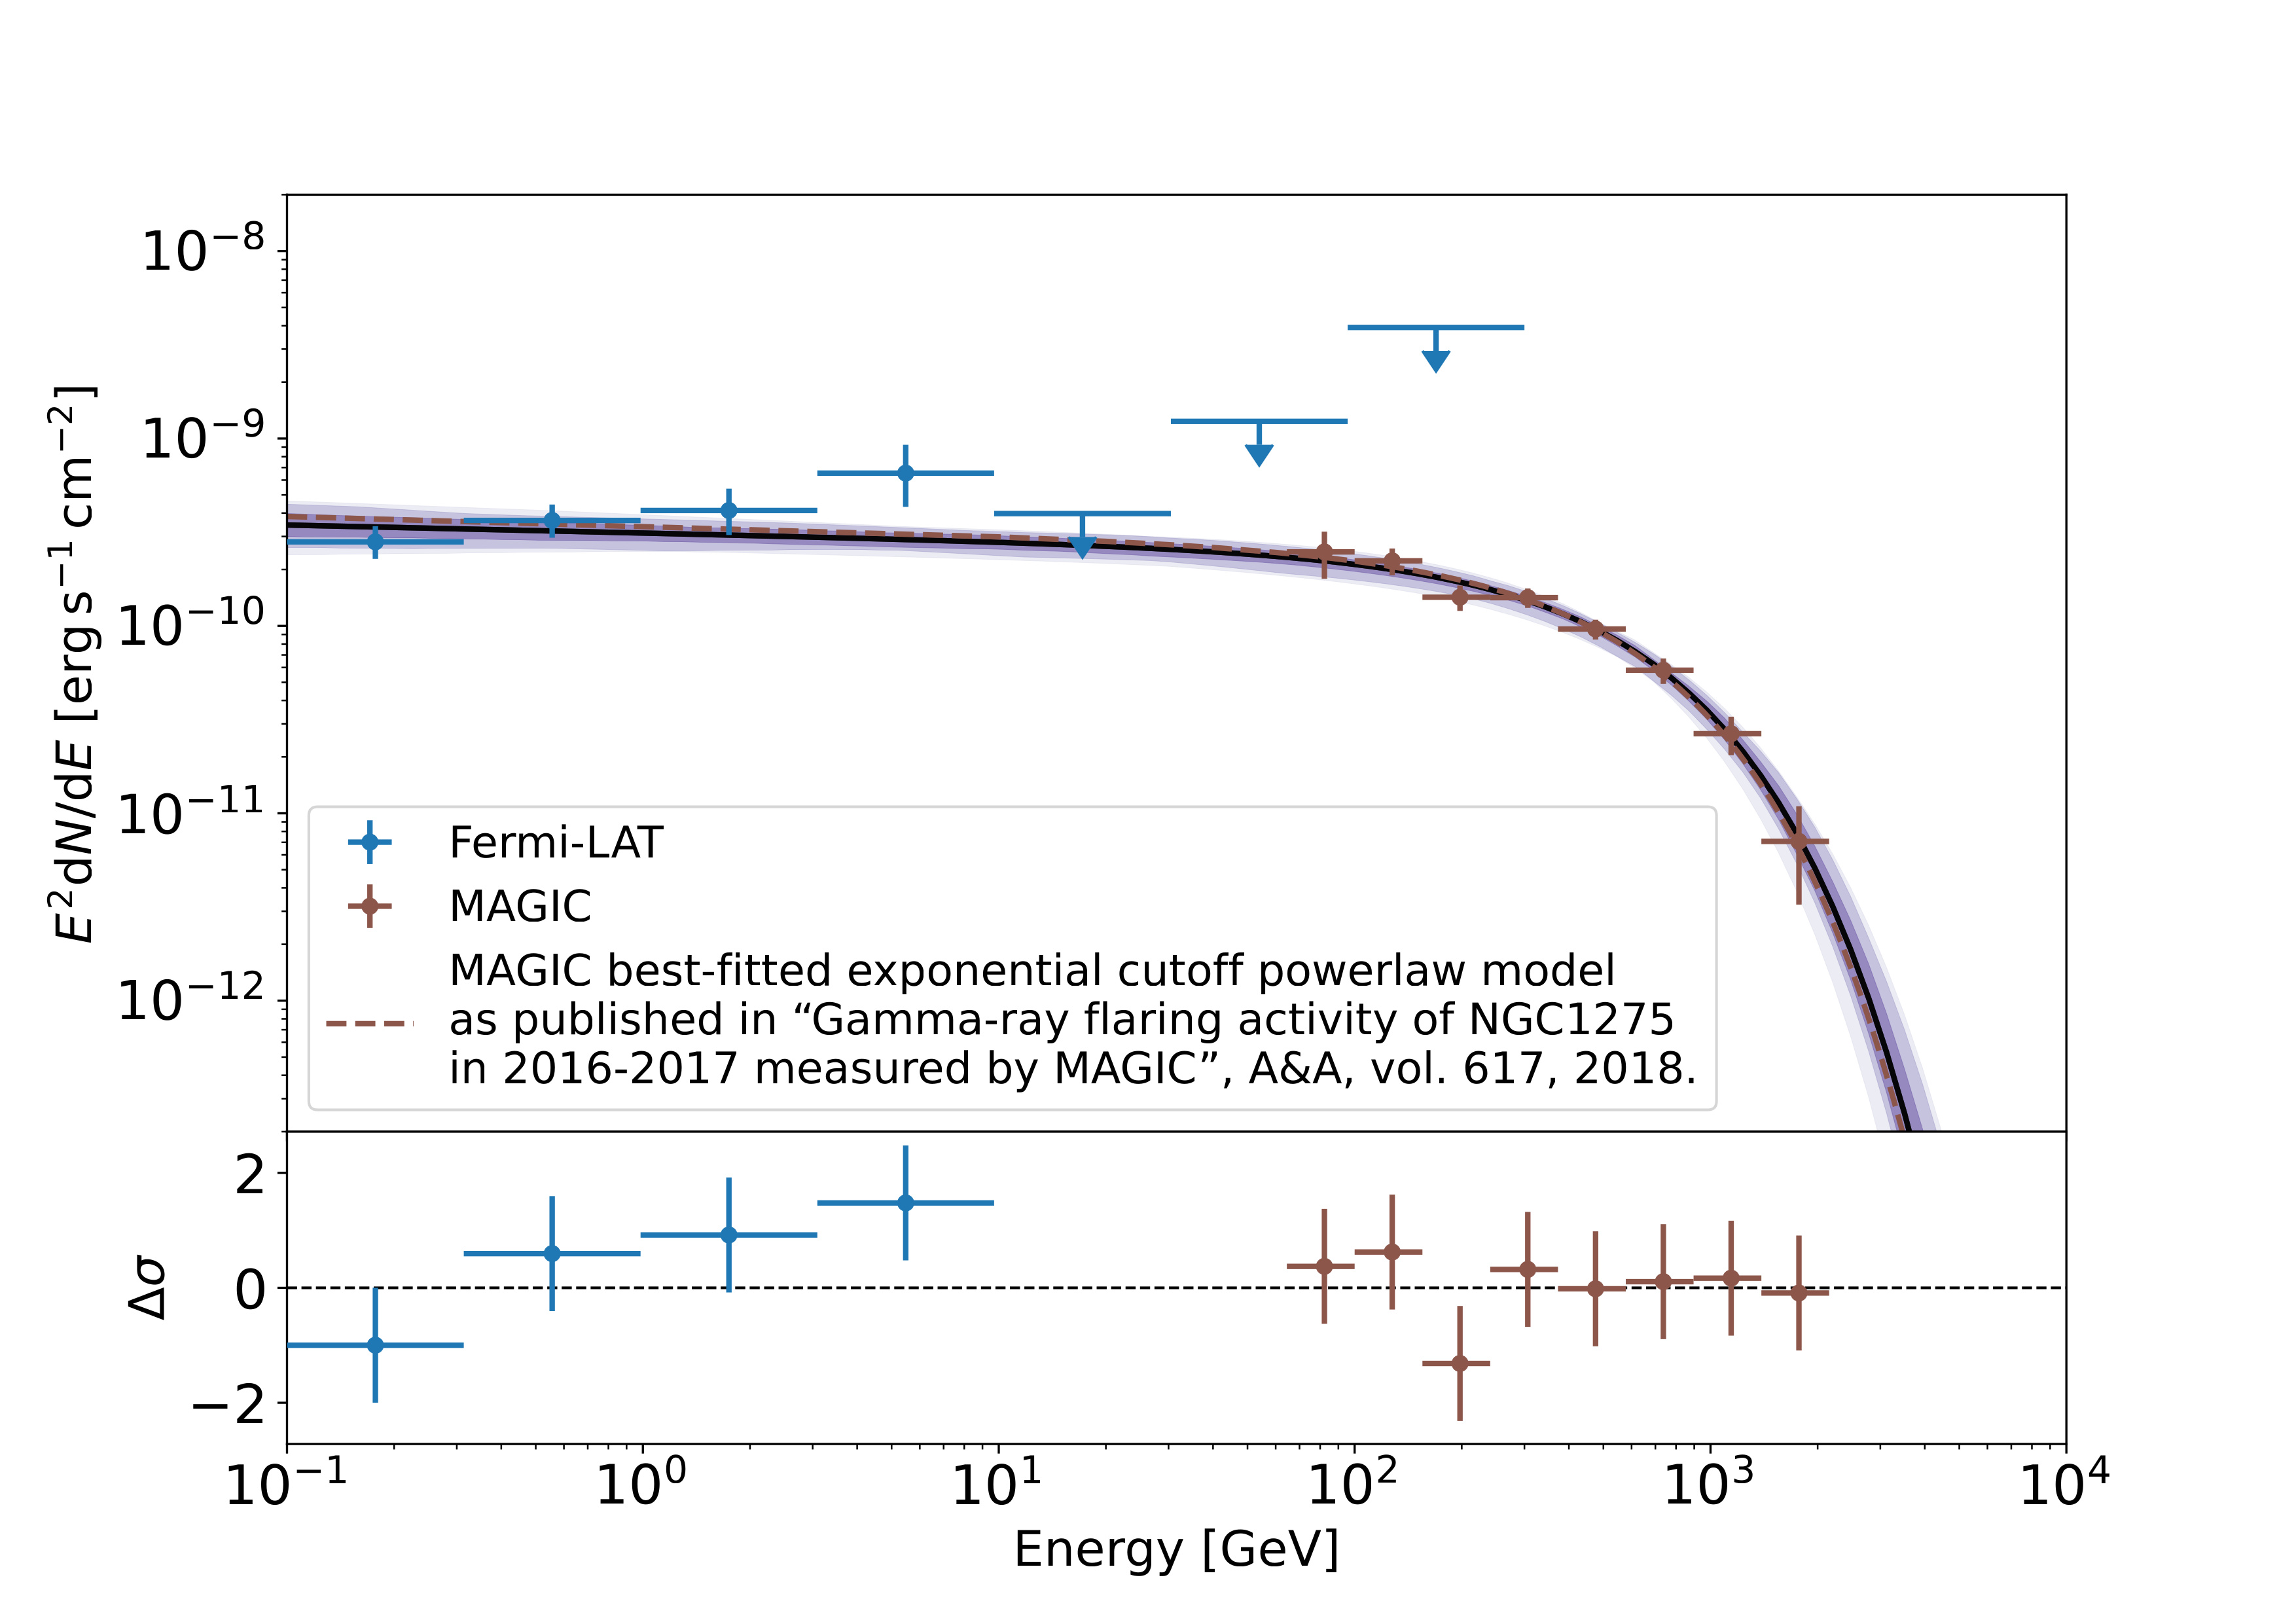
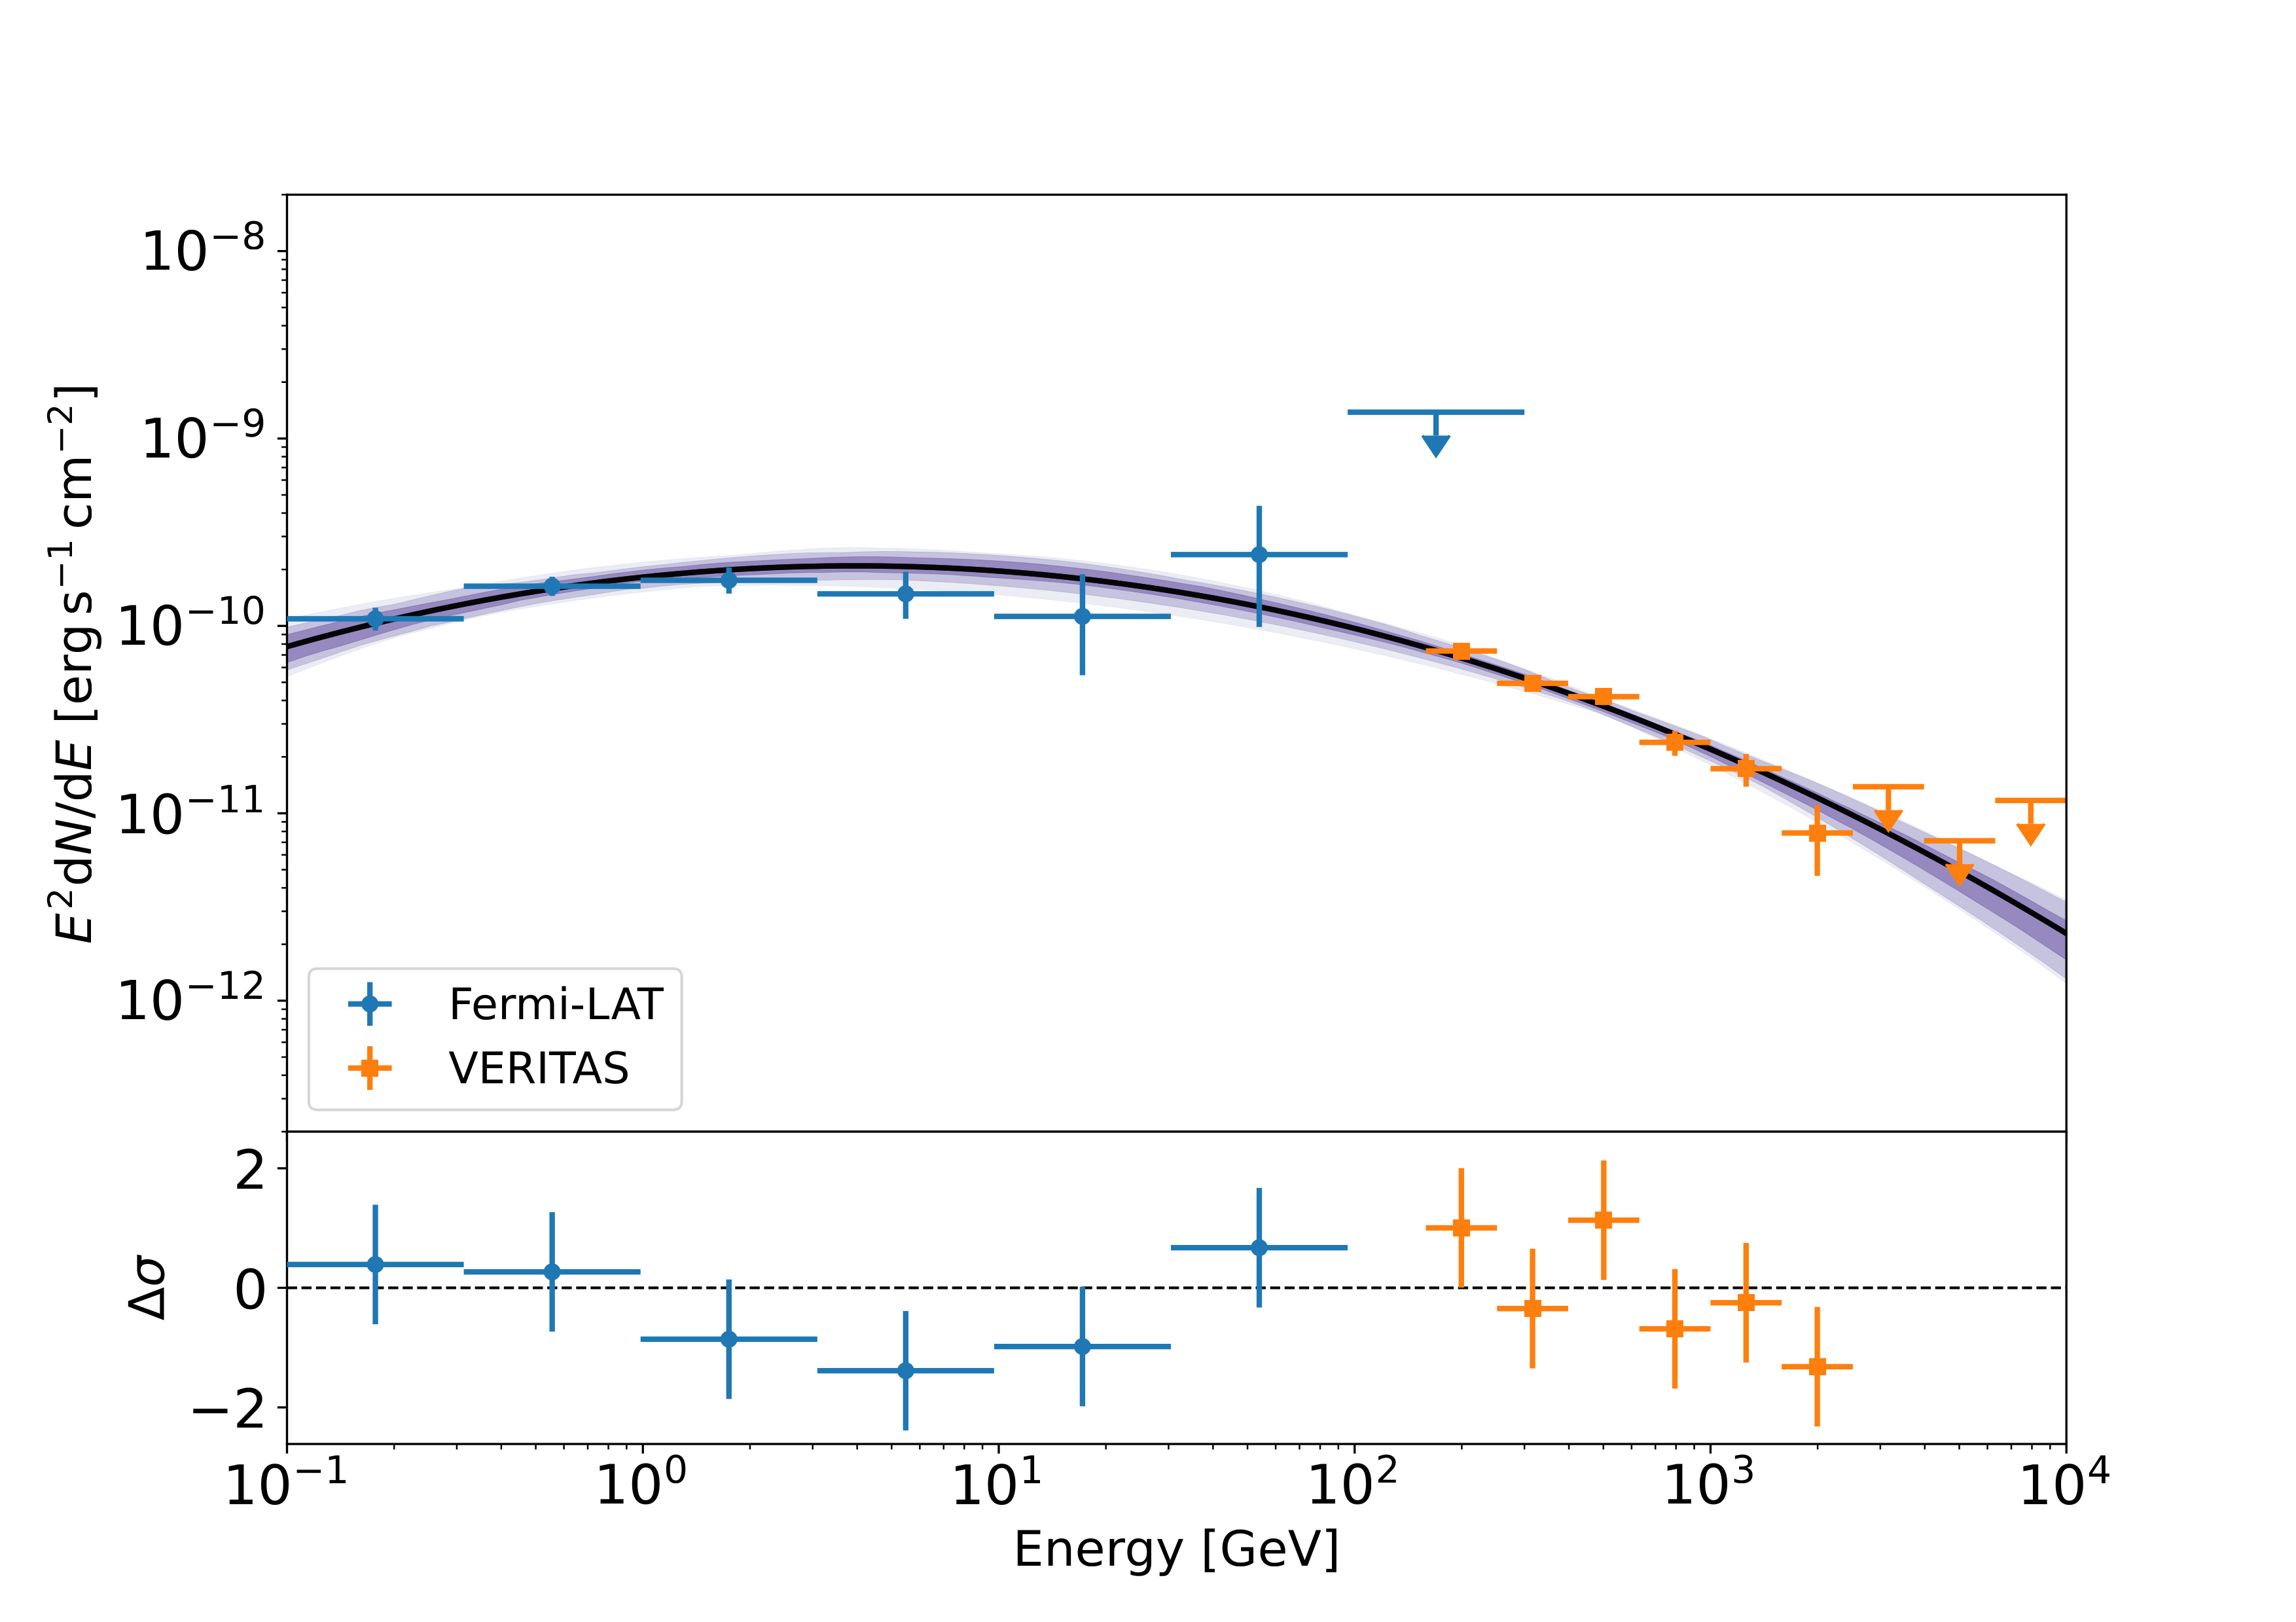
Figure 6: Shown here are the best fitted spectral models (including residuals) to the combined Fermi-LAT (blue filled circles) and MAGIC (brown filled circles) data for 2016 December 31/2017 January 1 (top panel), and the combined Fermi-LAT (blue filled circles) and VERITAS (orange filled squares) data for 2017 January 2 (bottom panel). Also shown in the top panel is the best-fitted spectral model (brown dashed line) published by MAGIC [MAGIC Collaboration et al. 2018]. For 2016 December 31/2017 January 1 the combined data is best described by a power law with exponential cutoff model (solid black line), whereas on 2017 January 2 the combined data is best described by a log parabola model (solid black line). The purple bands highlight the 1σ, 2σ and 3σ confidence intervals, respectively. These best-fitted spectral models highlight the stark evolution of the Compton peak shape between 2017 January 1 and 2017 January 2. Details of the fits can be found in Table 4.
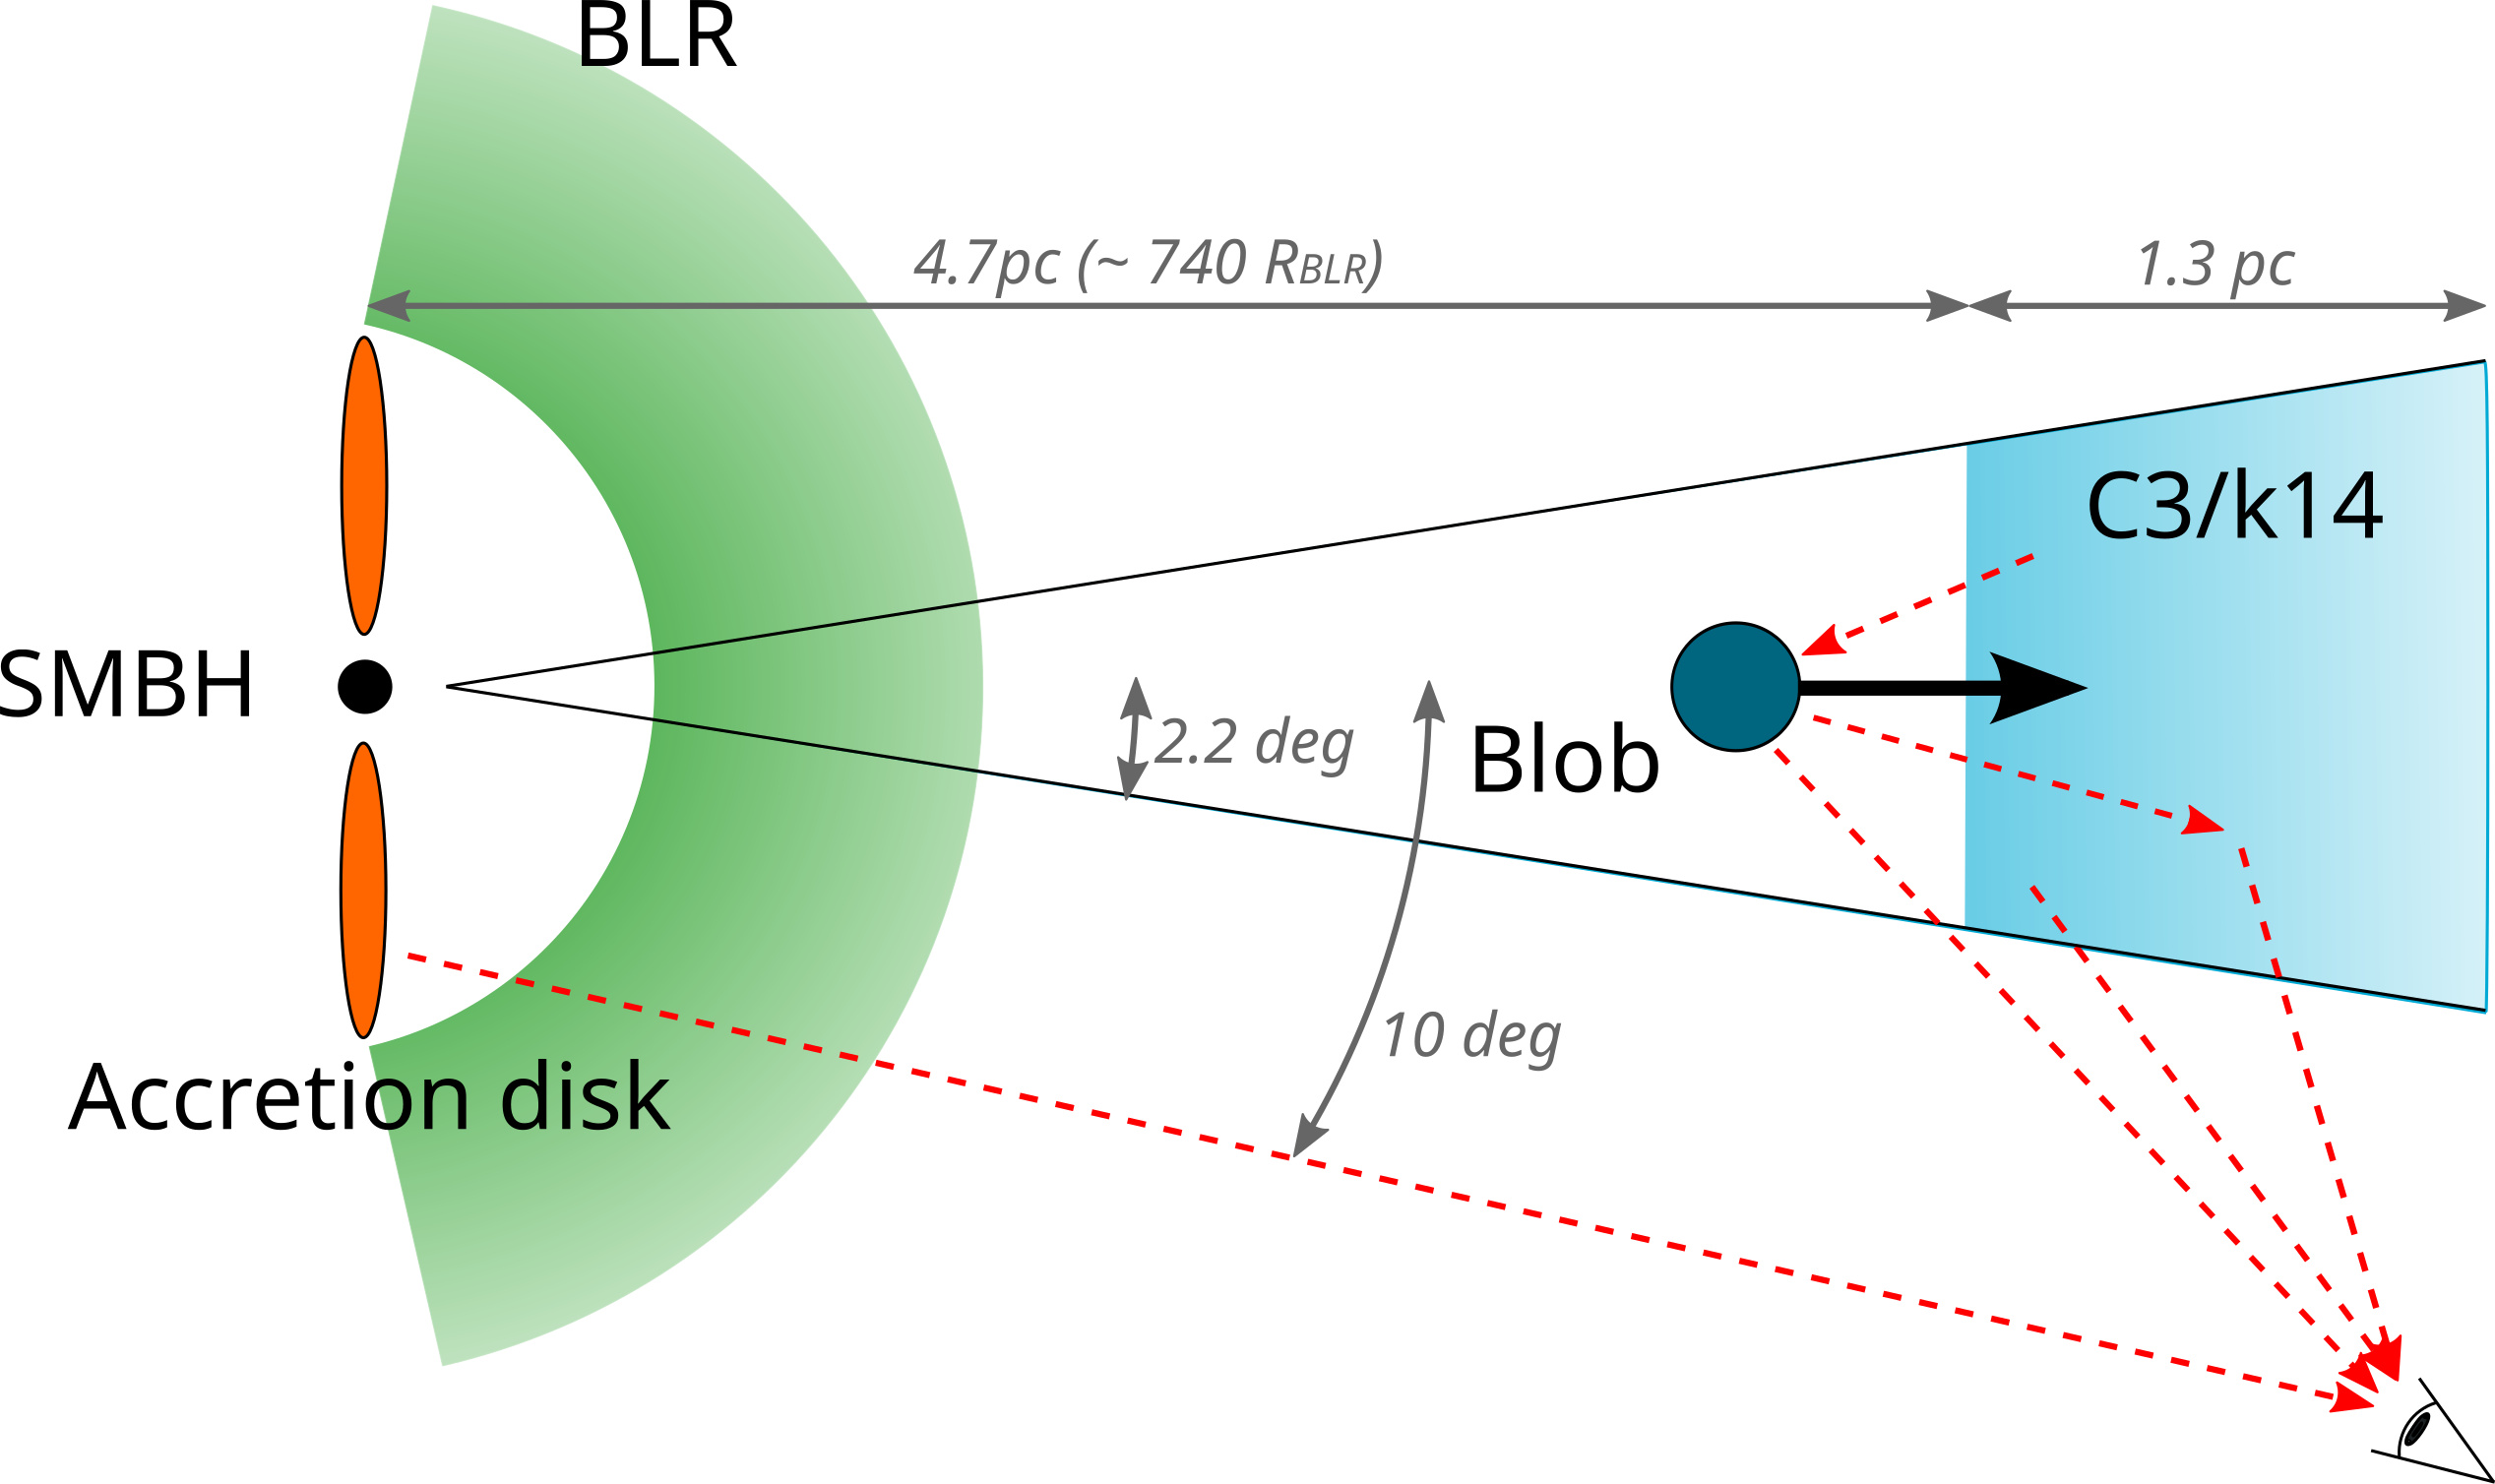
Figure 7: Geometrical scheme of radiative components considered for the broadband SED modeling of NGC 1275 (not to scale). The red-dashed lines represent the multiple radiative transfers taken into account. In our code, the accretion disk is considered as a point-like source. With 5.4pc as the deprojected distance to the middle of C3, we take 4.7pc as the deprojected distance to the edge of C3.
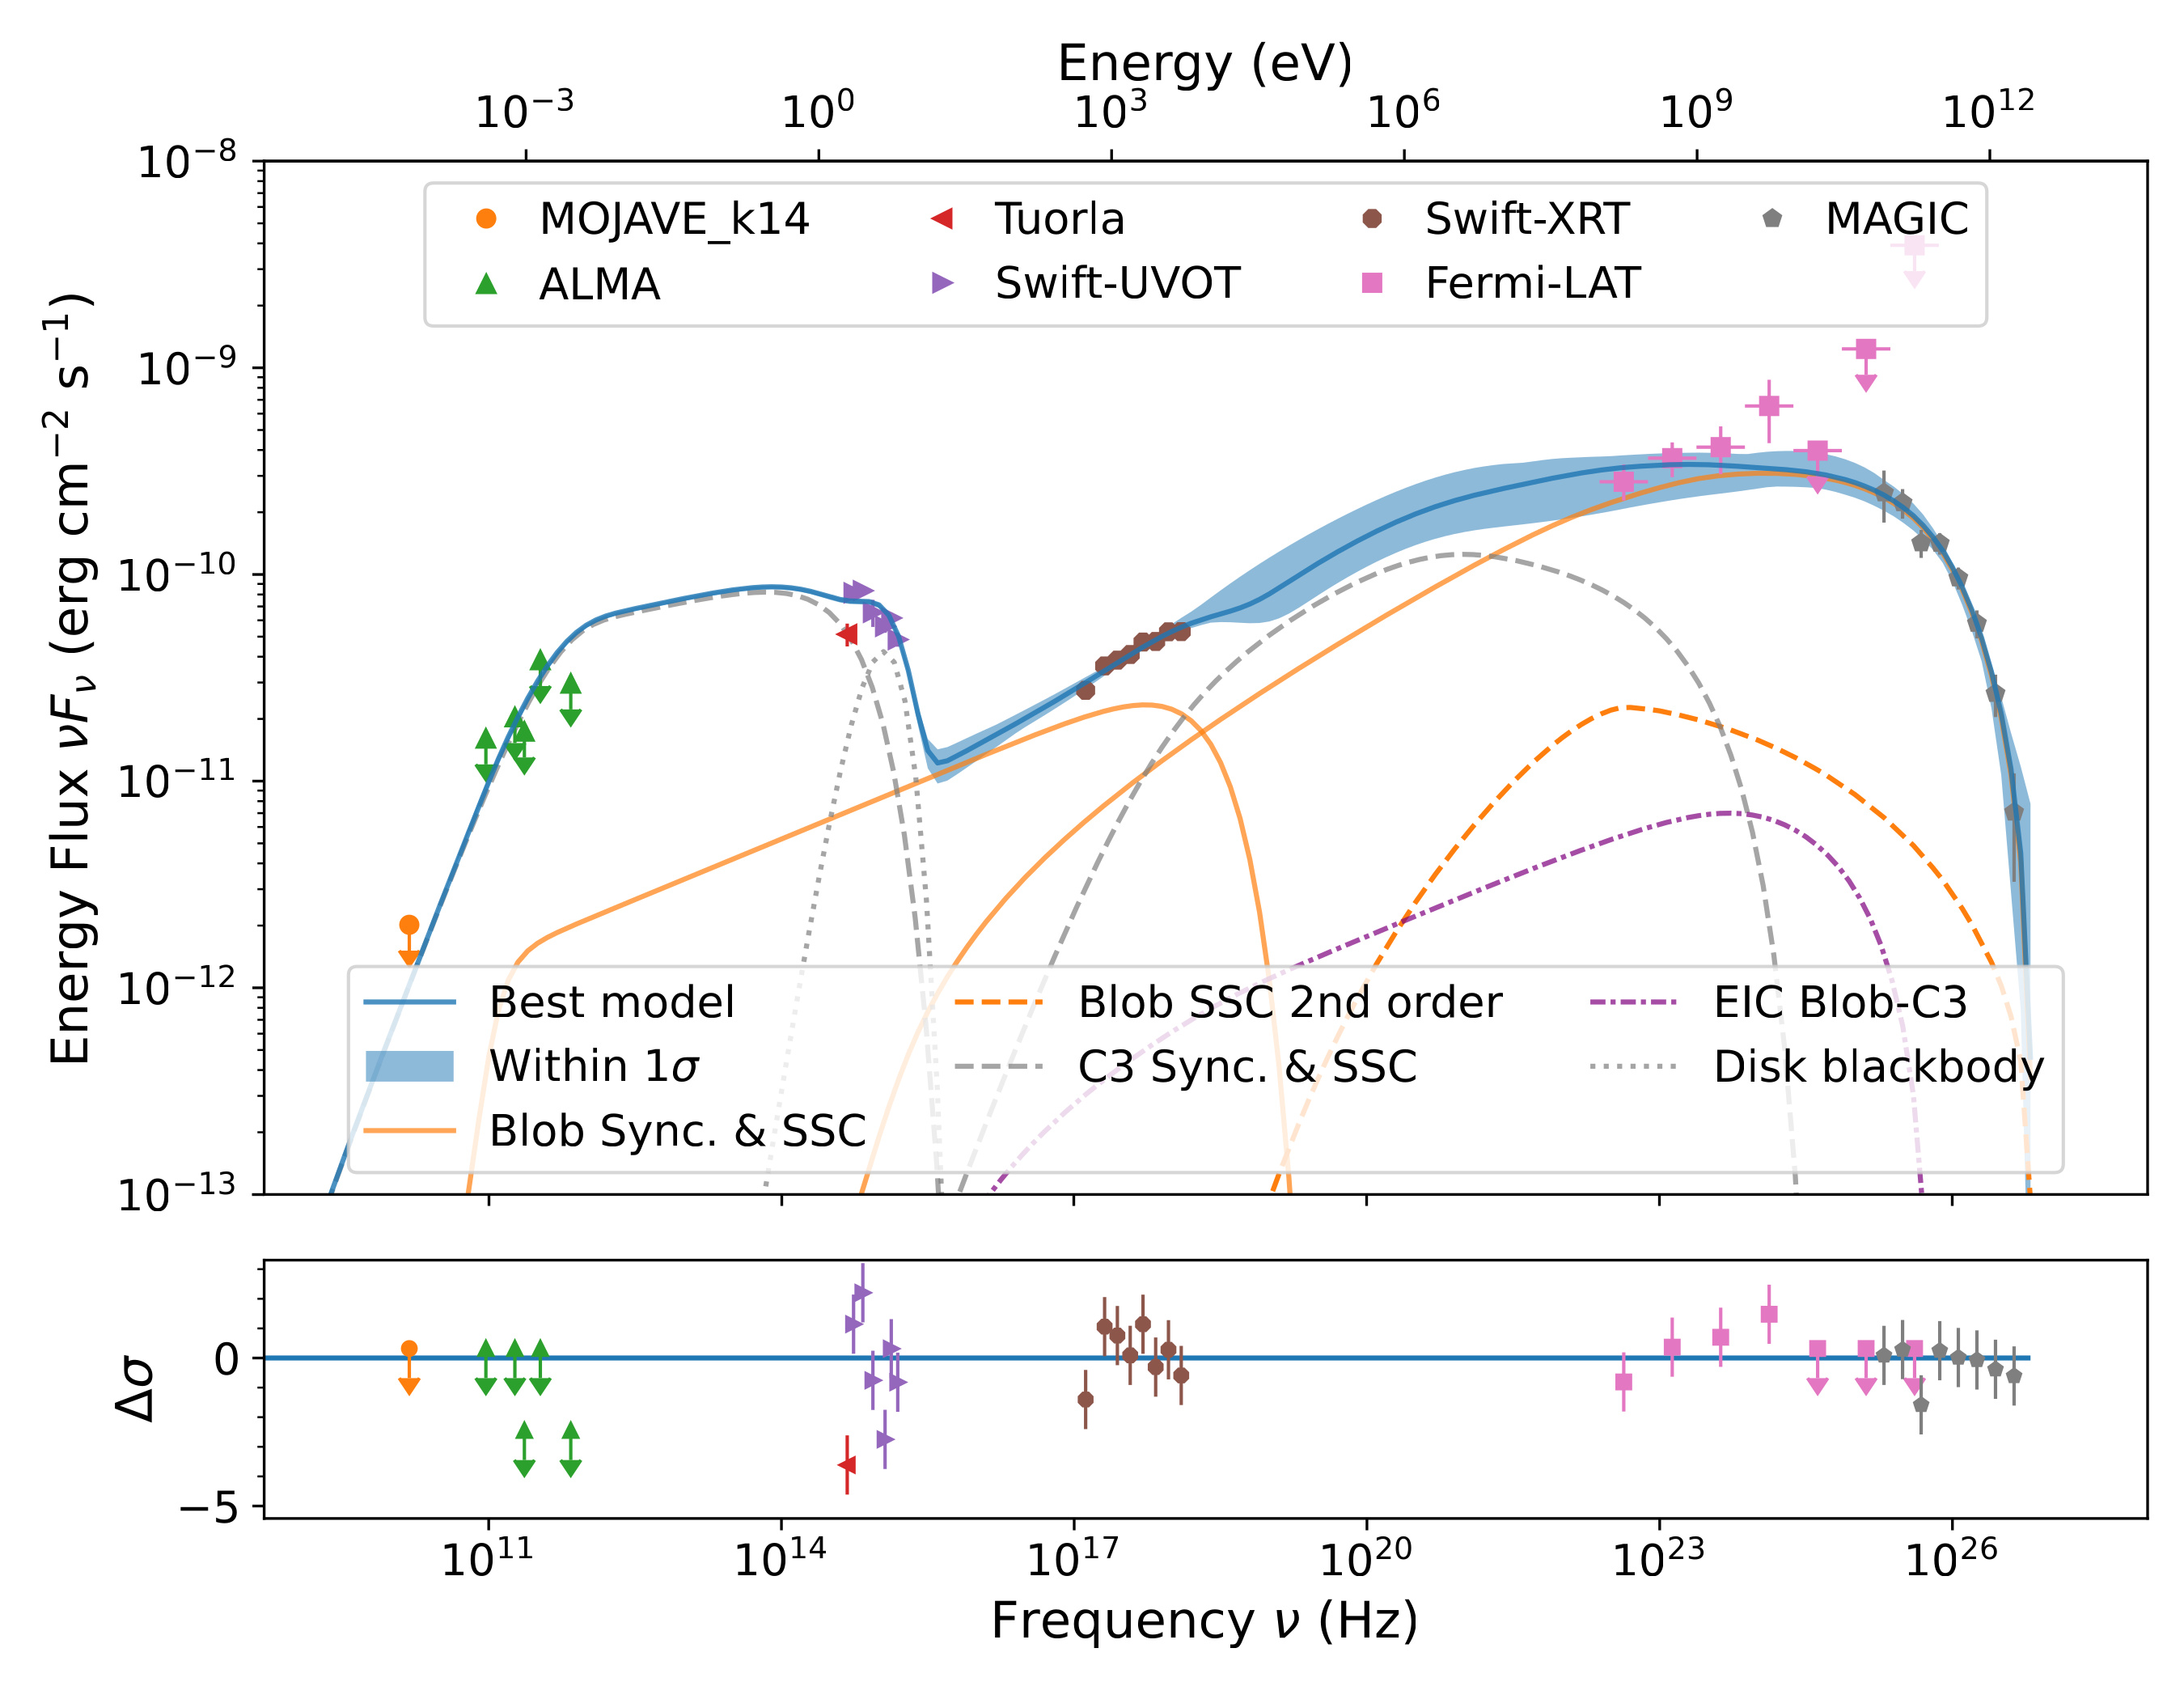
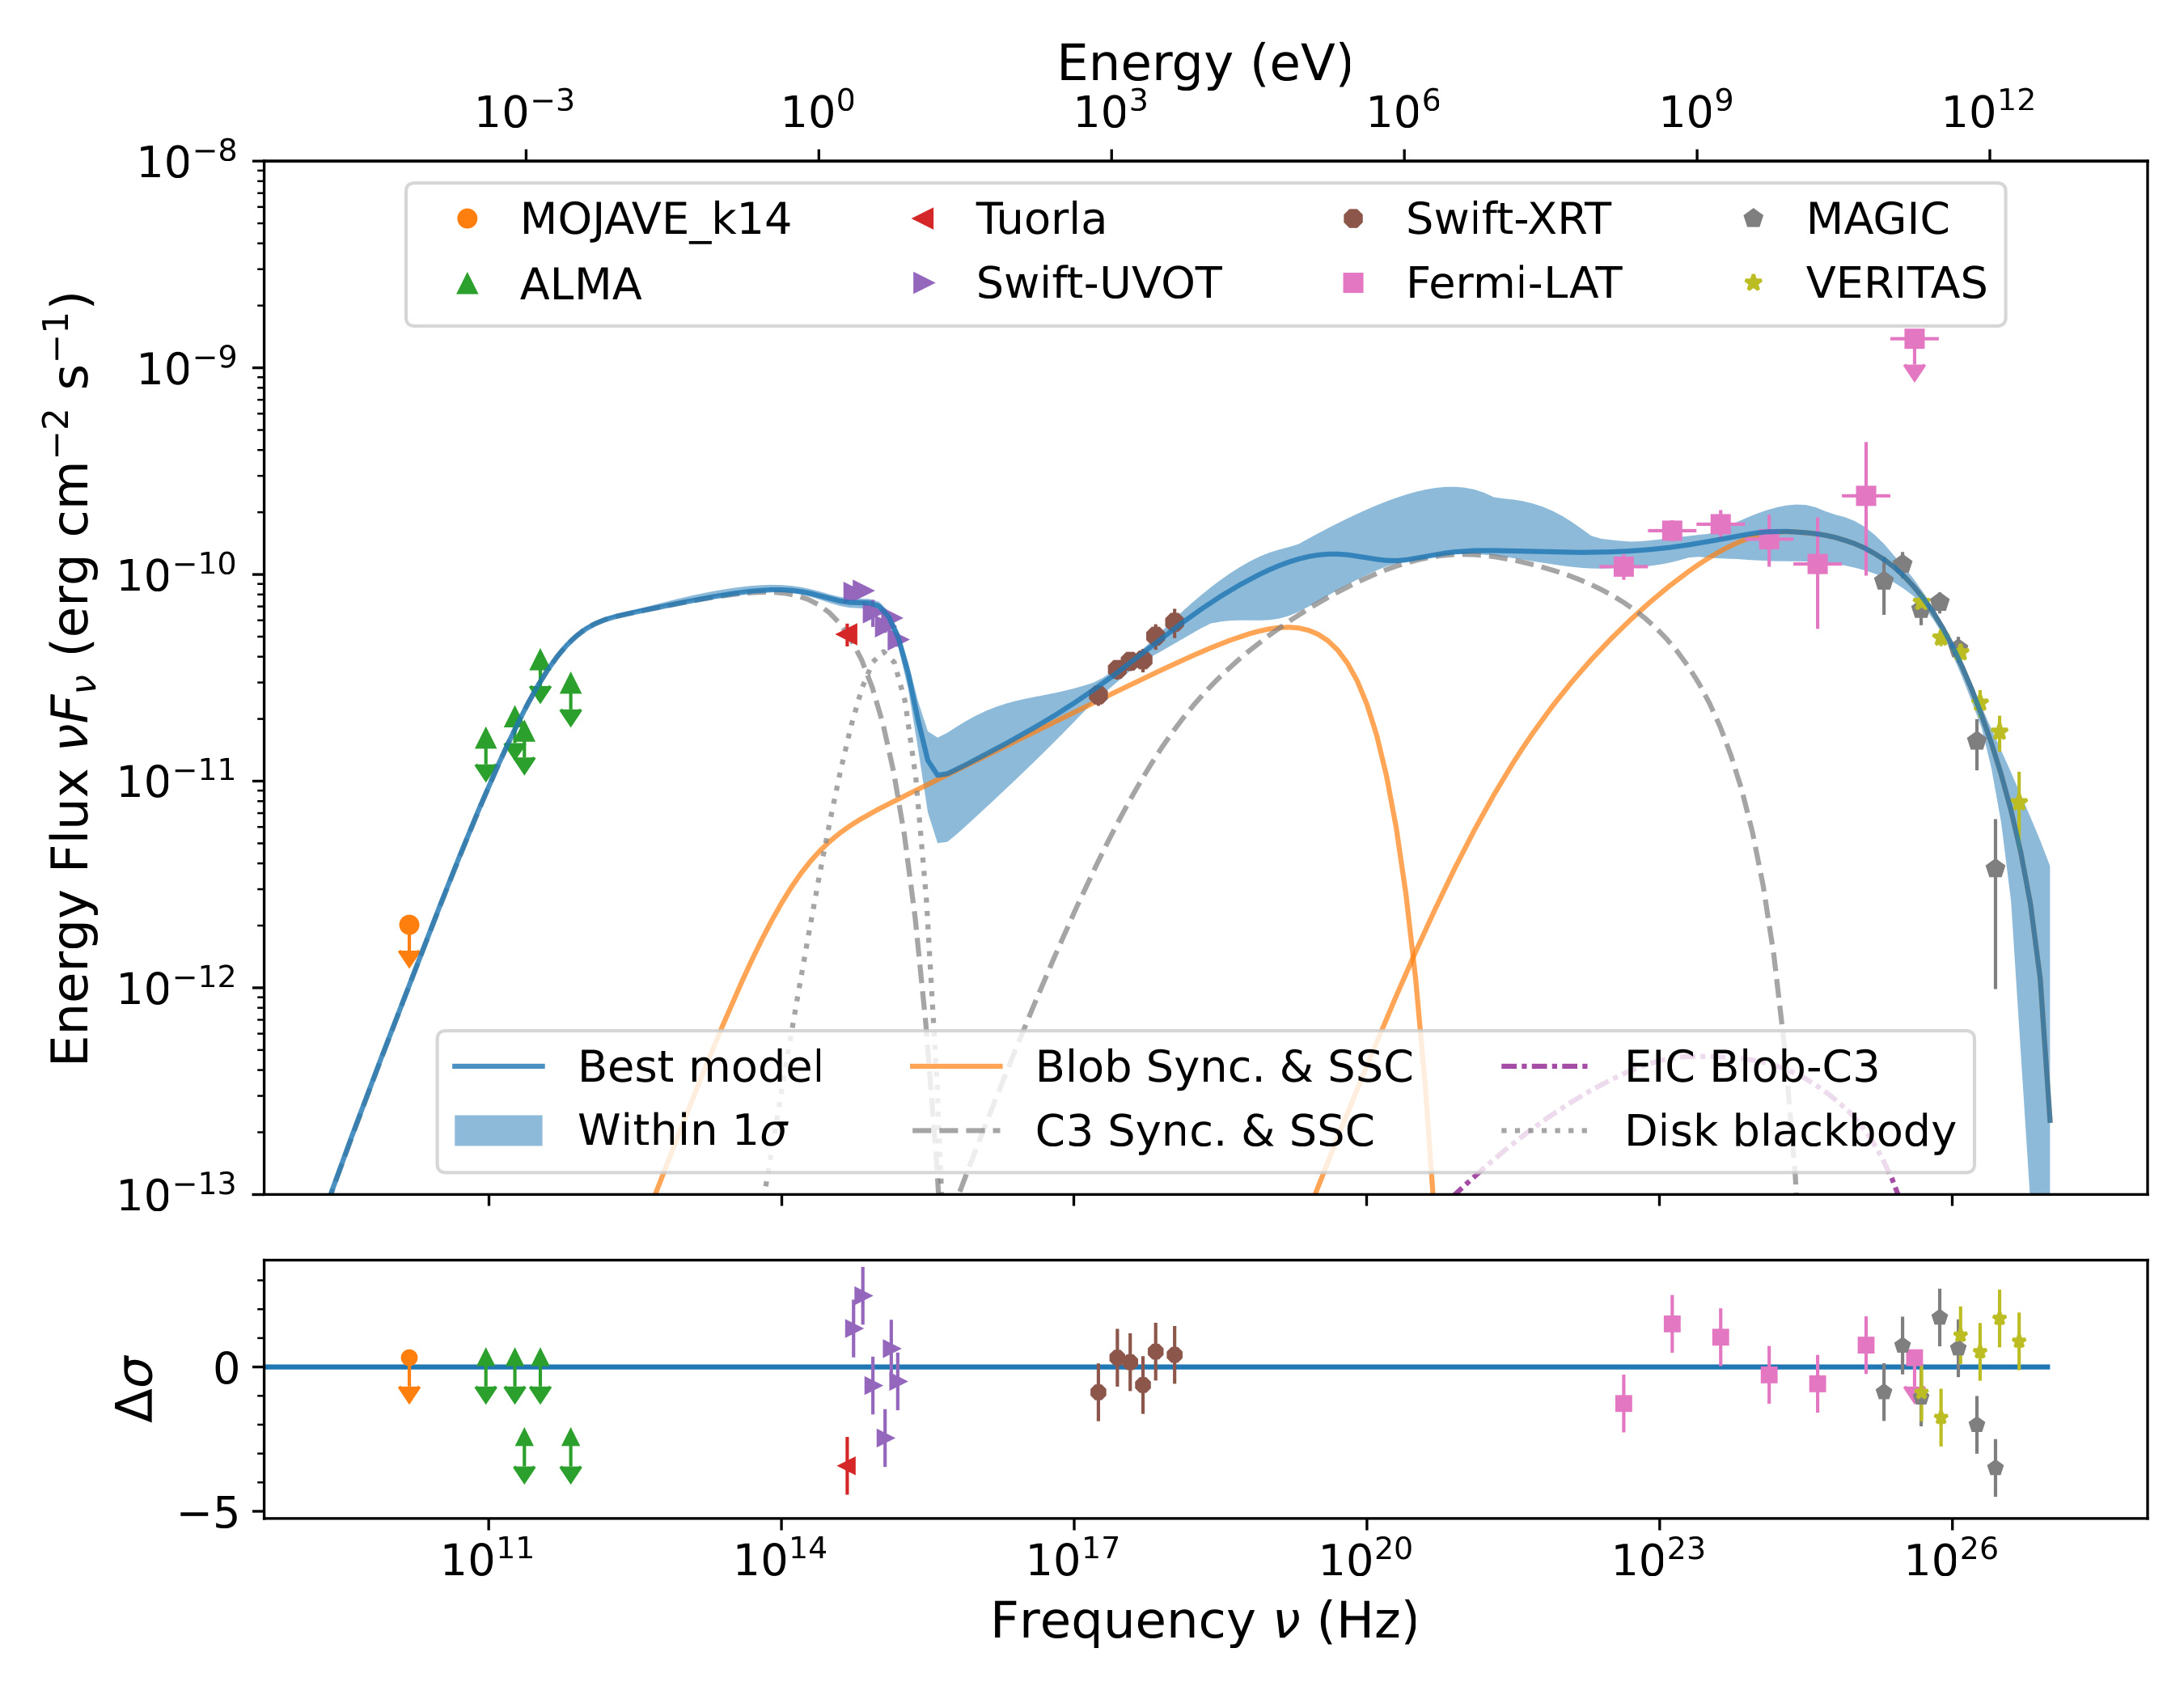
Figure 8: Multiwavelength SEDs with models and residuals of NGC 1275 during the 2017 VHE flare (left) and one day after (right). Gray lines are for components considered steady over the two days: the C3 synchrotron and SSC emission (dashed), and the thermal emission from the accretion disk (dotted). These two components are fitted by eye and constrained from optical and radio data. Colored lines are linked to the blob emission that varies between the two states, fitted to the data with Bjet MCMC: the blob synchrotron and SSC contribution (plain orange), the second-order SSC emission (dashed orange), and the combined EIC emission of both the blob’s particles on C3 photons and C3 particles on blob’s photons (dotted-dashed purple). The sum of all components and associated 1σ contours are shown in blue. The γ-ray emission is absorbed by the EBL following the model of Franceschini & Rodighiero [2017].