We present an analysis of new multi-wavelength observations of the TeV gamma-ray binary HESS J0632+057, conducted using SALT, Swift, NuSTAR, and VERITAS in 2023–2024. By combining these new data with archival observations, we confirm previous suggestions of orbital variability in the source’s X-ray spectrum, including increased X-ray absorption at the orbital phase interval of ϕ ≈0.3–0.4. The source’s X-ray flux within this phase interval seems to have exhibited a significant change on an orbital timescale. Additionally, occasional short-term variations in the X-ray band on a timescale of less than 3 days have been observed. The measured duration of the increased absorbing column density and the flux variability timescales can provide clues about the interaction between the putative pulsar and the Be companion’s disk if, as previously suggested, the pulsar crosses the disk at this phase interval. Moreover, the new contemporaneous X-ray and TeV observations around the pulsar-crossing phases revealed independent variability in the X-ray and TeV fluxes, contrary to a previous observation of concurrent flux increases. While these observations alone cannot provide definitive conclusions, we discuss our results in the context of pulsar-disk interaction and intrabinary shock emission scenarios.
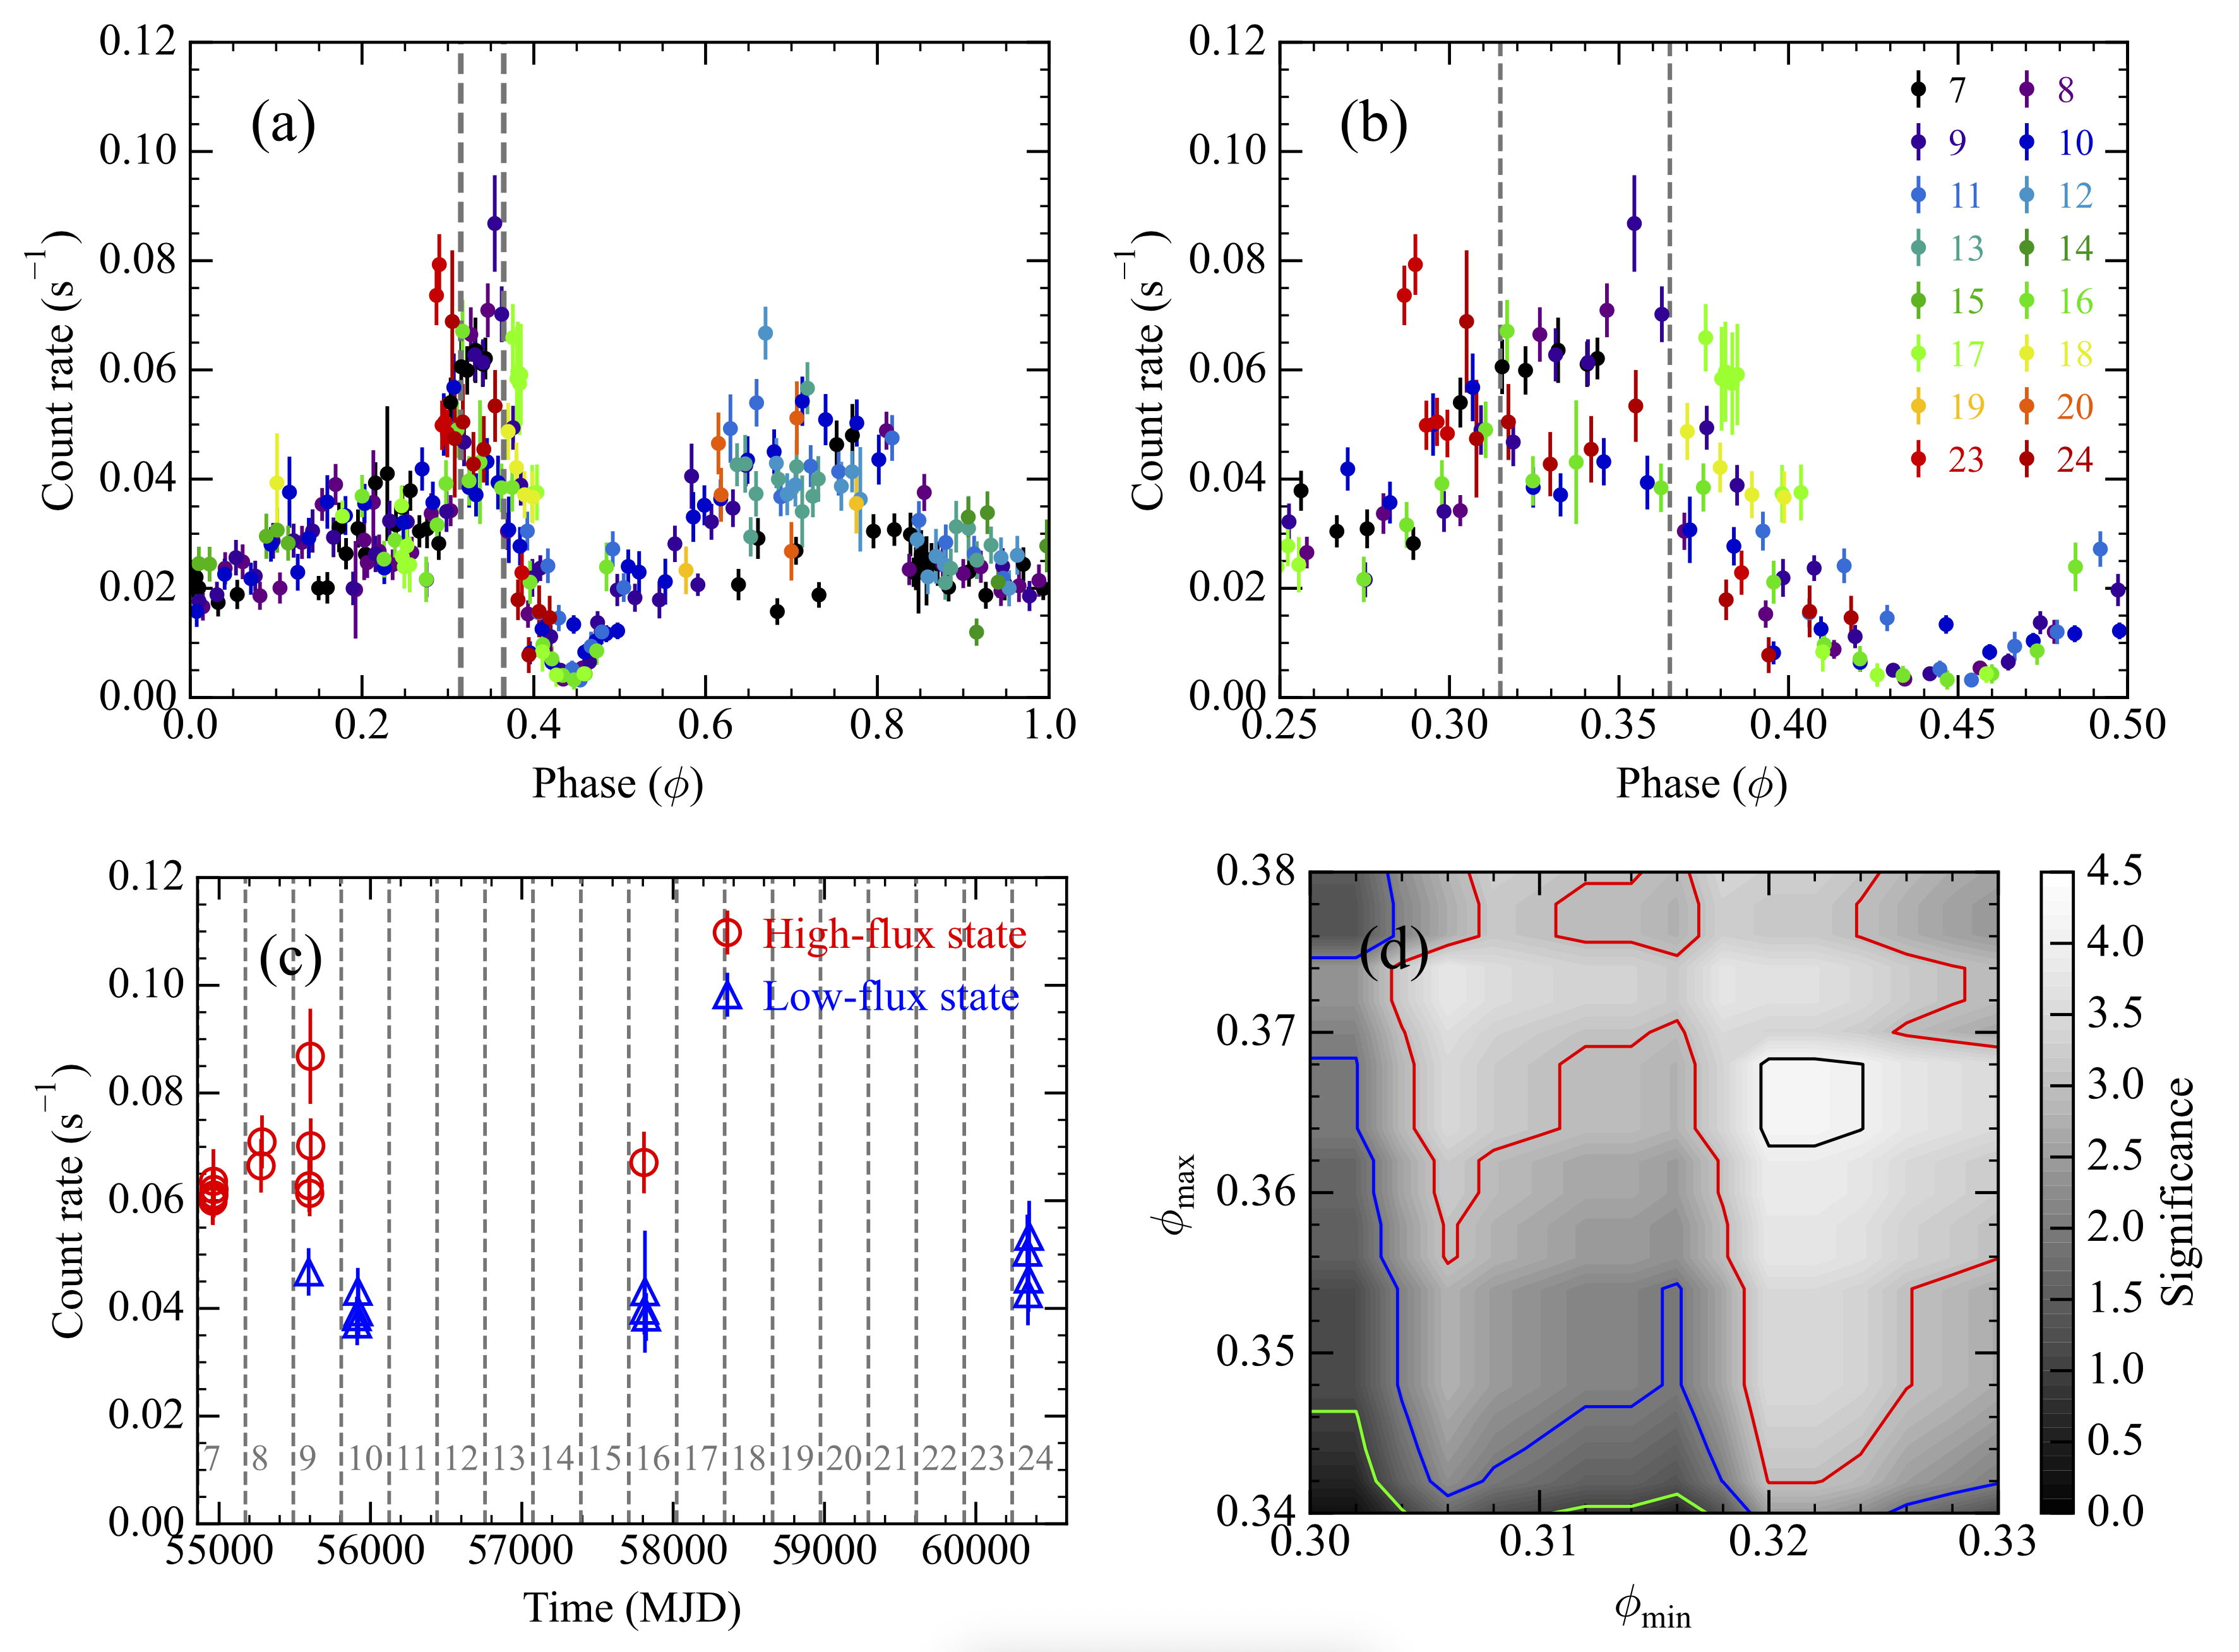
Figure 1: The 0.5–10 keV light curves of J0632 measured by Swift/XRT (a–c). (a) Light curve folded on the orbital period PB=316.65 days. (b) Zoomed-in view of the folded light curve near the X-ray peak, highlighting the phase interval ϕ=0.315–0.365 (marked by vertical dashed lines in panels a and b) corresponding to the previously-suggested pulsar-disk interaction phase. Different colors represent individual orbital cycles. (c) Unfolded light curve for the phase interval ϕ=0.315–0.365, with vertical lines indicating orbital cycles (gray numbers). (d) Probabilities that the light-curve structure in panel (c) arises from random variation as a function of phase-interval selection (ϕmin–ϕmax). The green, blue, red, and black contours correspond to significance levels of 1, 2, 3, and 4, respectively.
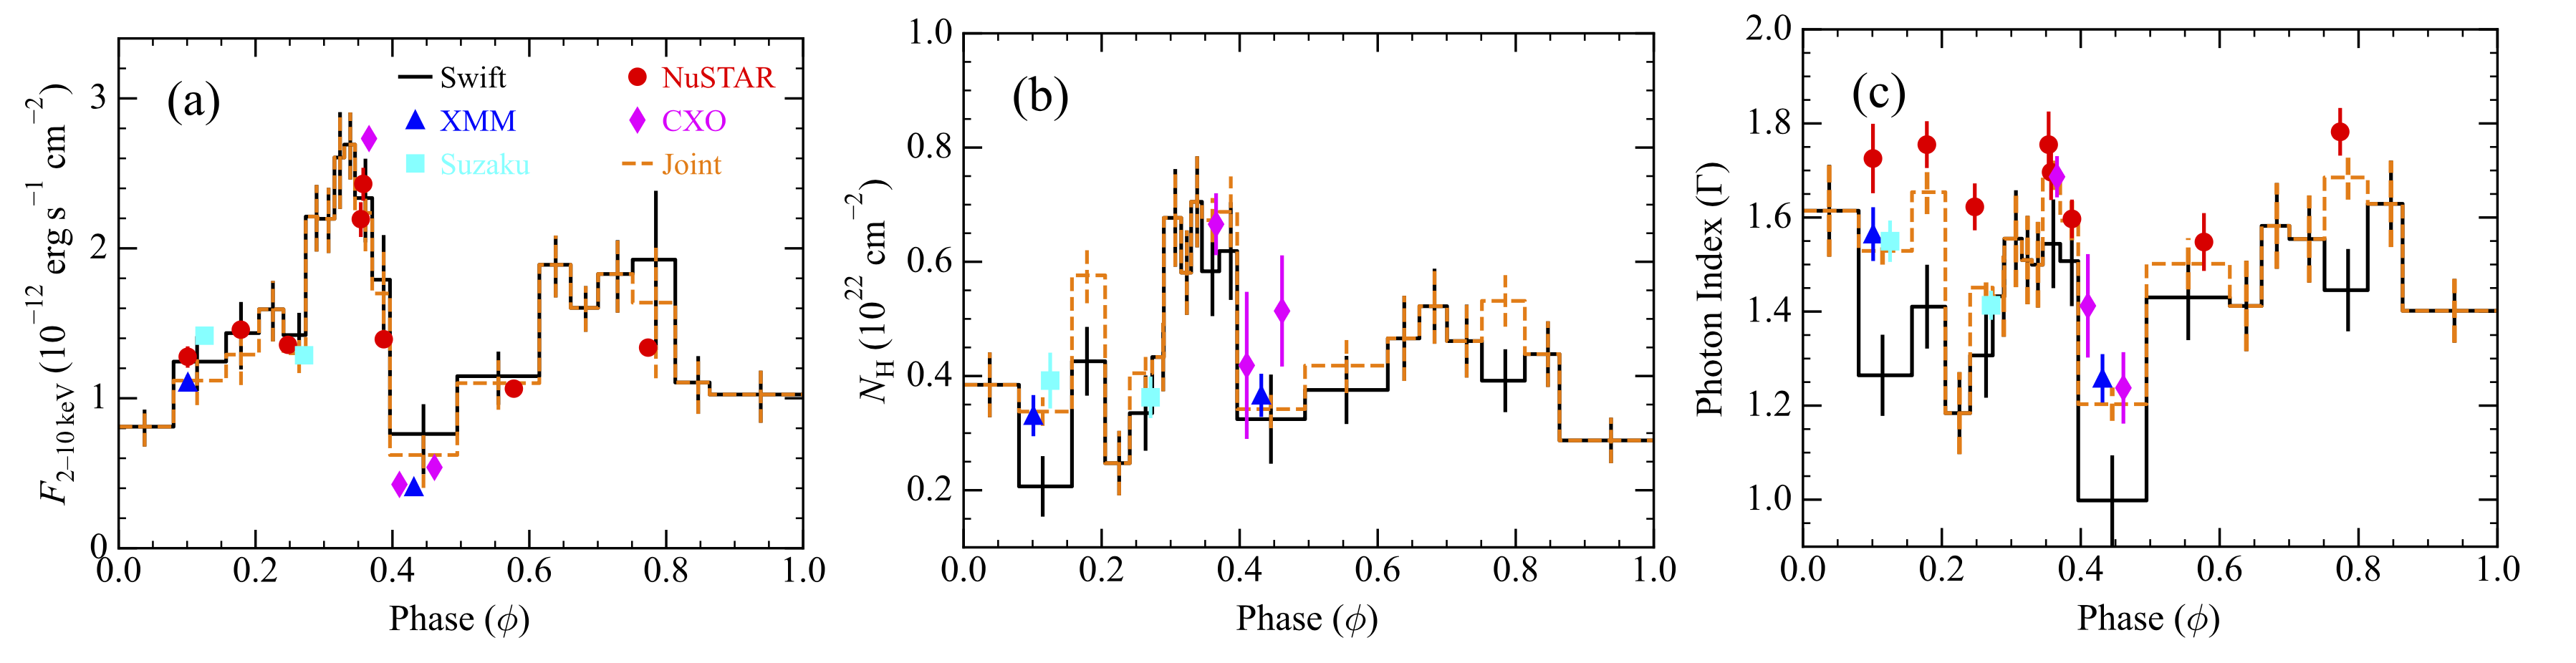

Figure 2: Plots showing (a) the 2–10 keV flux (F2−10keV), (b) NH, and (c) Γ inferred from PL fits (Section2.3). Measurements from Swift/XRT, Chandra, XMM, Suzaku, and NuSTAR are shown as black lines, pink diamonds, blue triangles, cyan squares, and red circles, respectively. The orange dashed line indicates parameter values obtained from joint fits of the multi-instrument data.
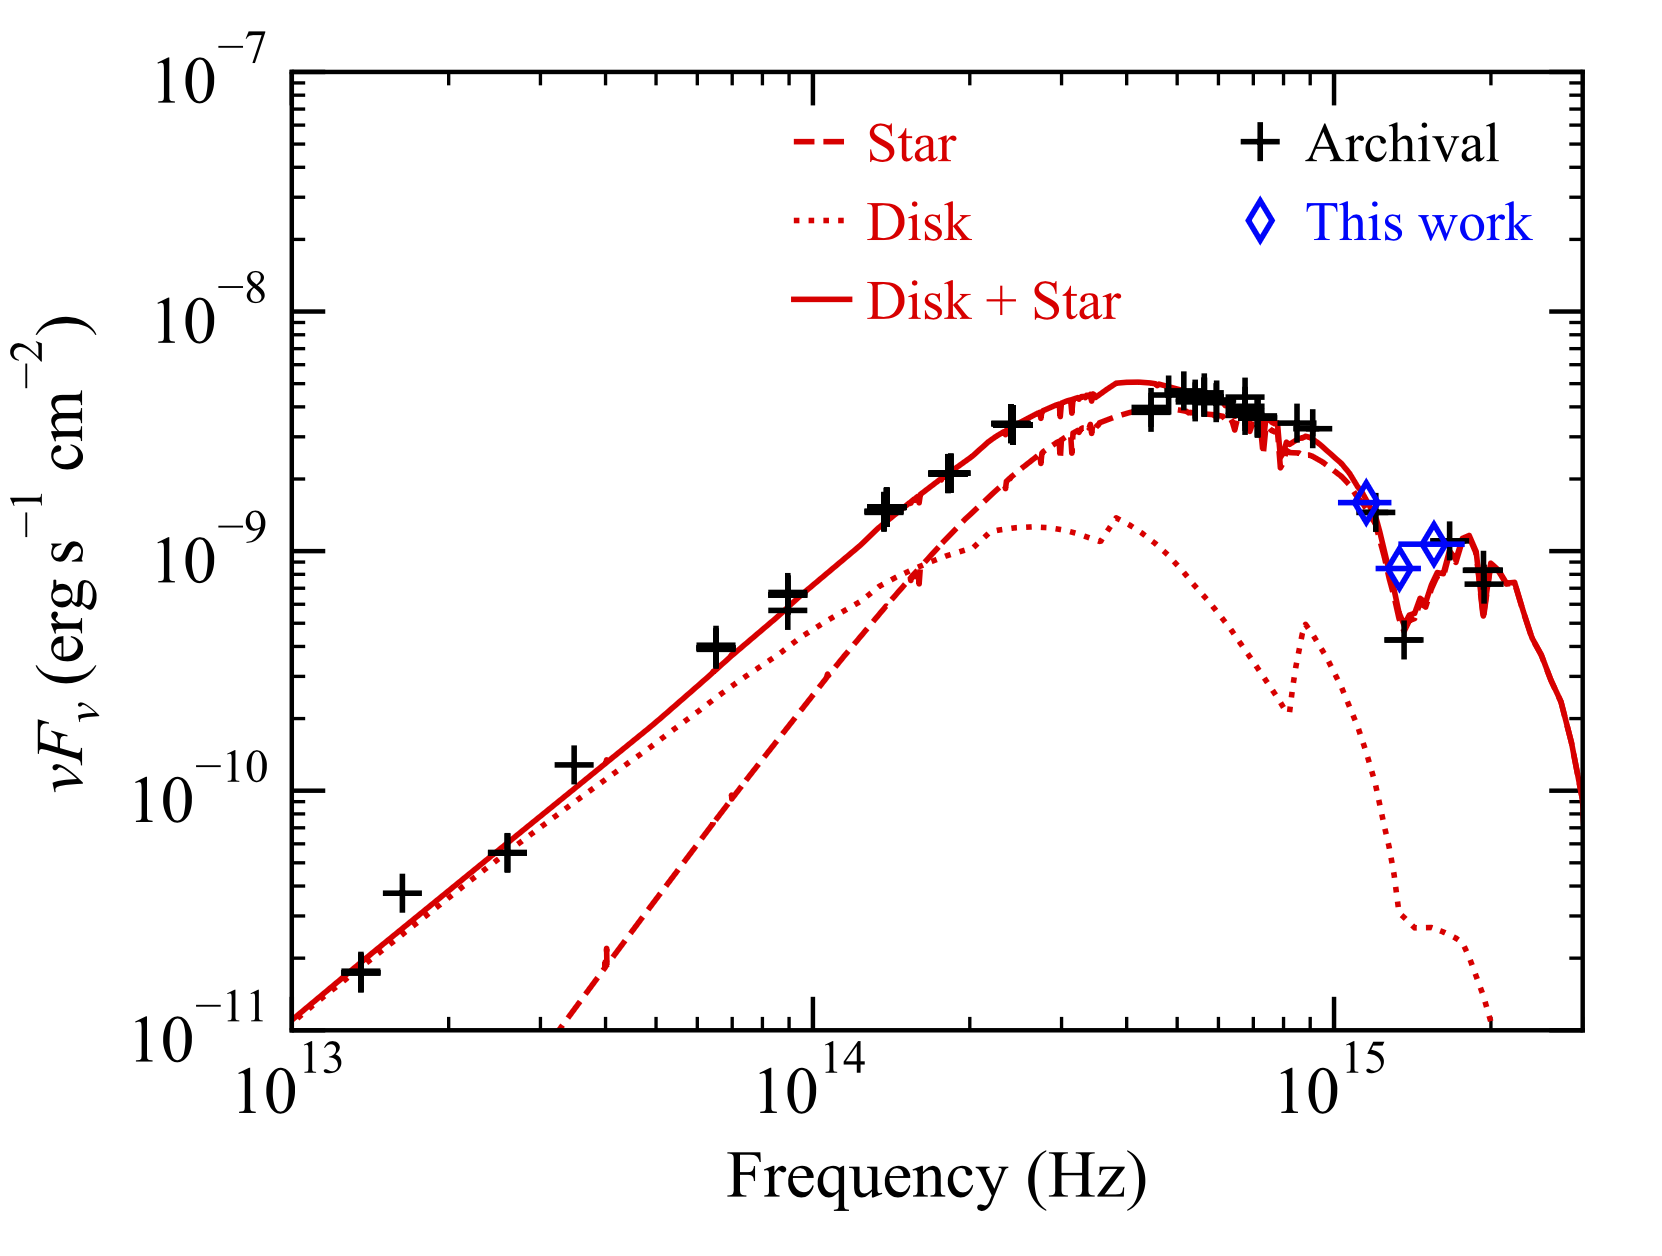
Figure 3: IR-to-Optical SED of J0632. Red lines represent emission components: stellar atmosphere (dashed; see text), disk (dotted; J. Kim et al. 2022), and their sum (solid). Our UVOT measurements are shown in blue, with a stellar atmospheric model including interstellar extinction overlaid in red (see text). Black points represent archival measurements (taken from C. Aragona et al. 2010; J. Kim et al. 2022).
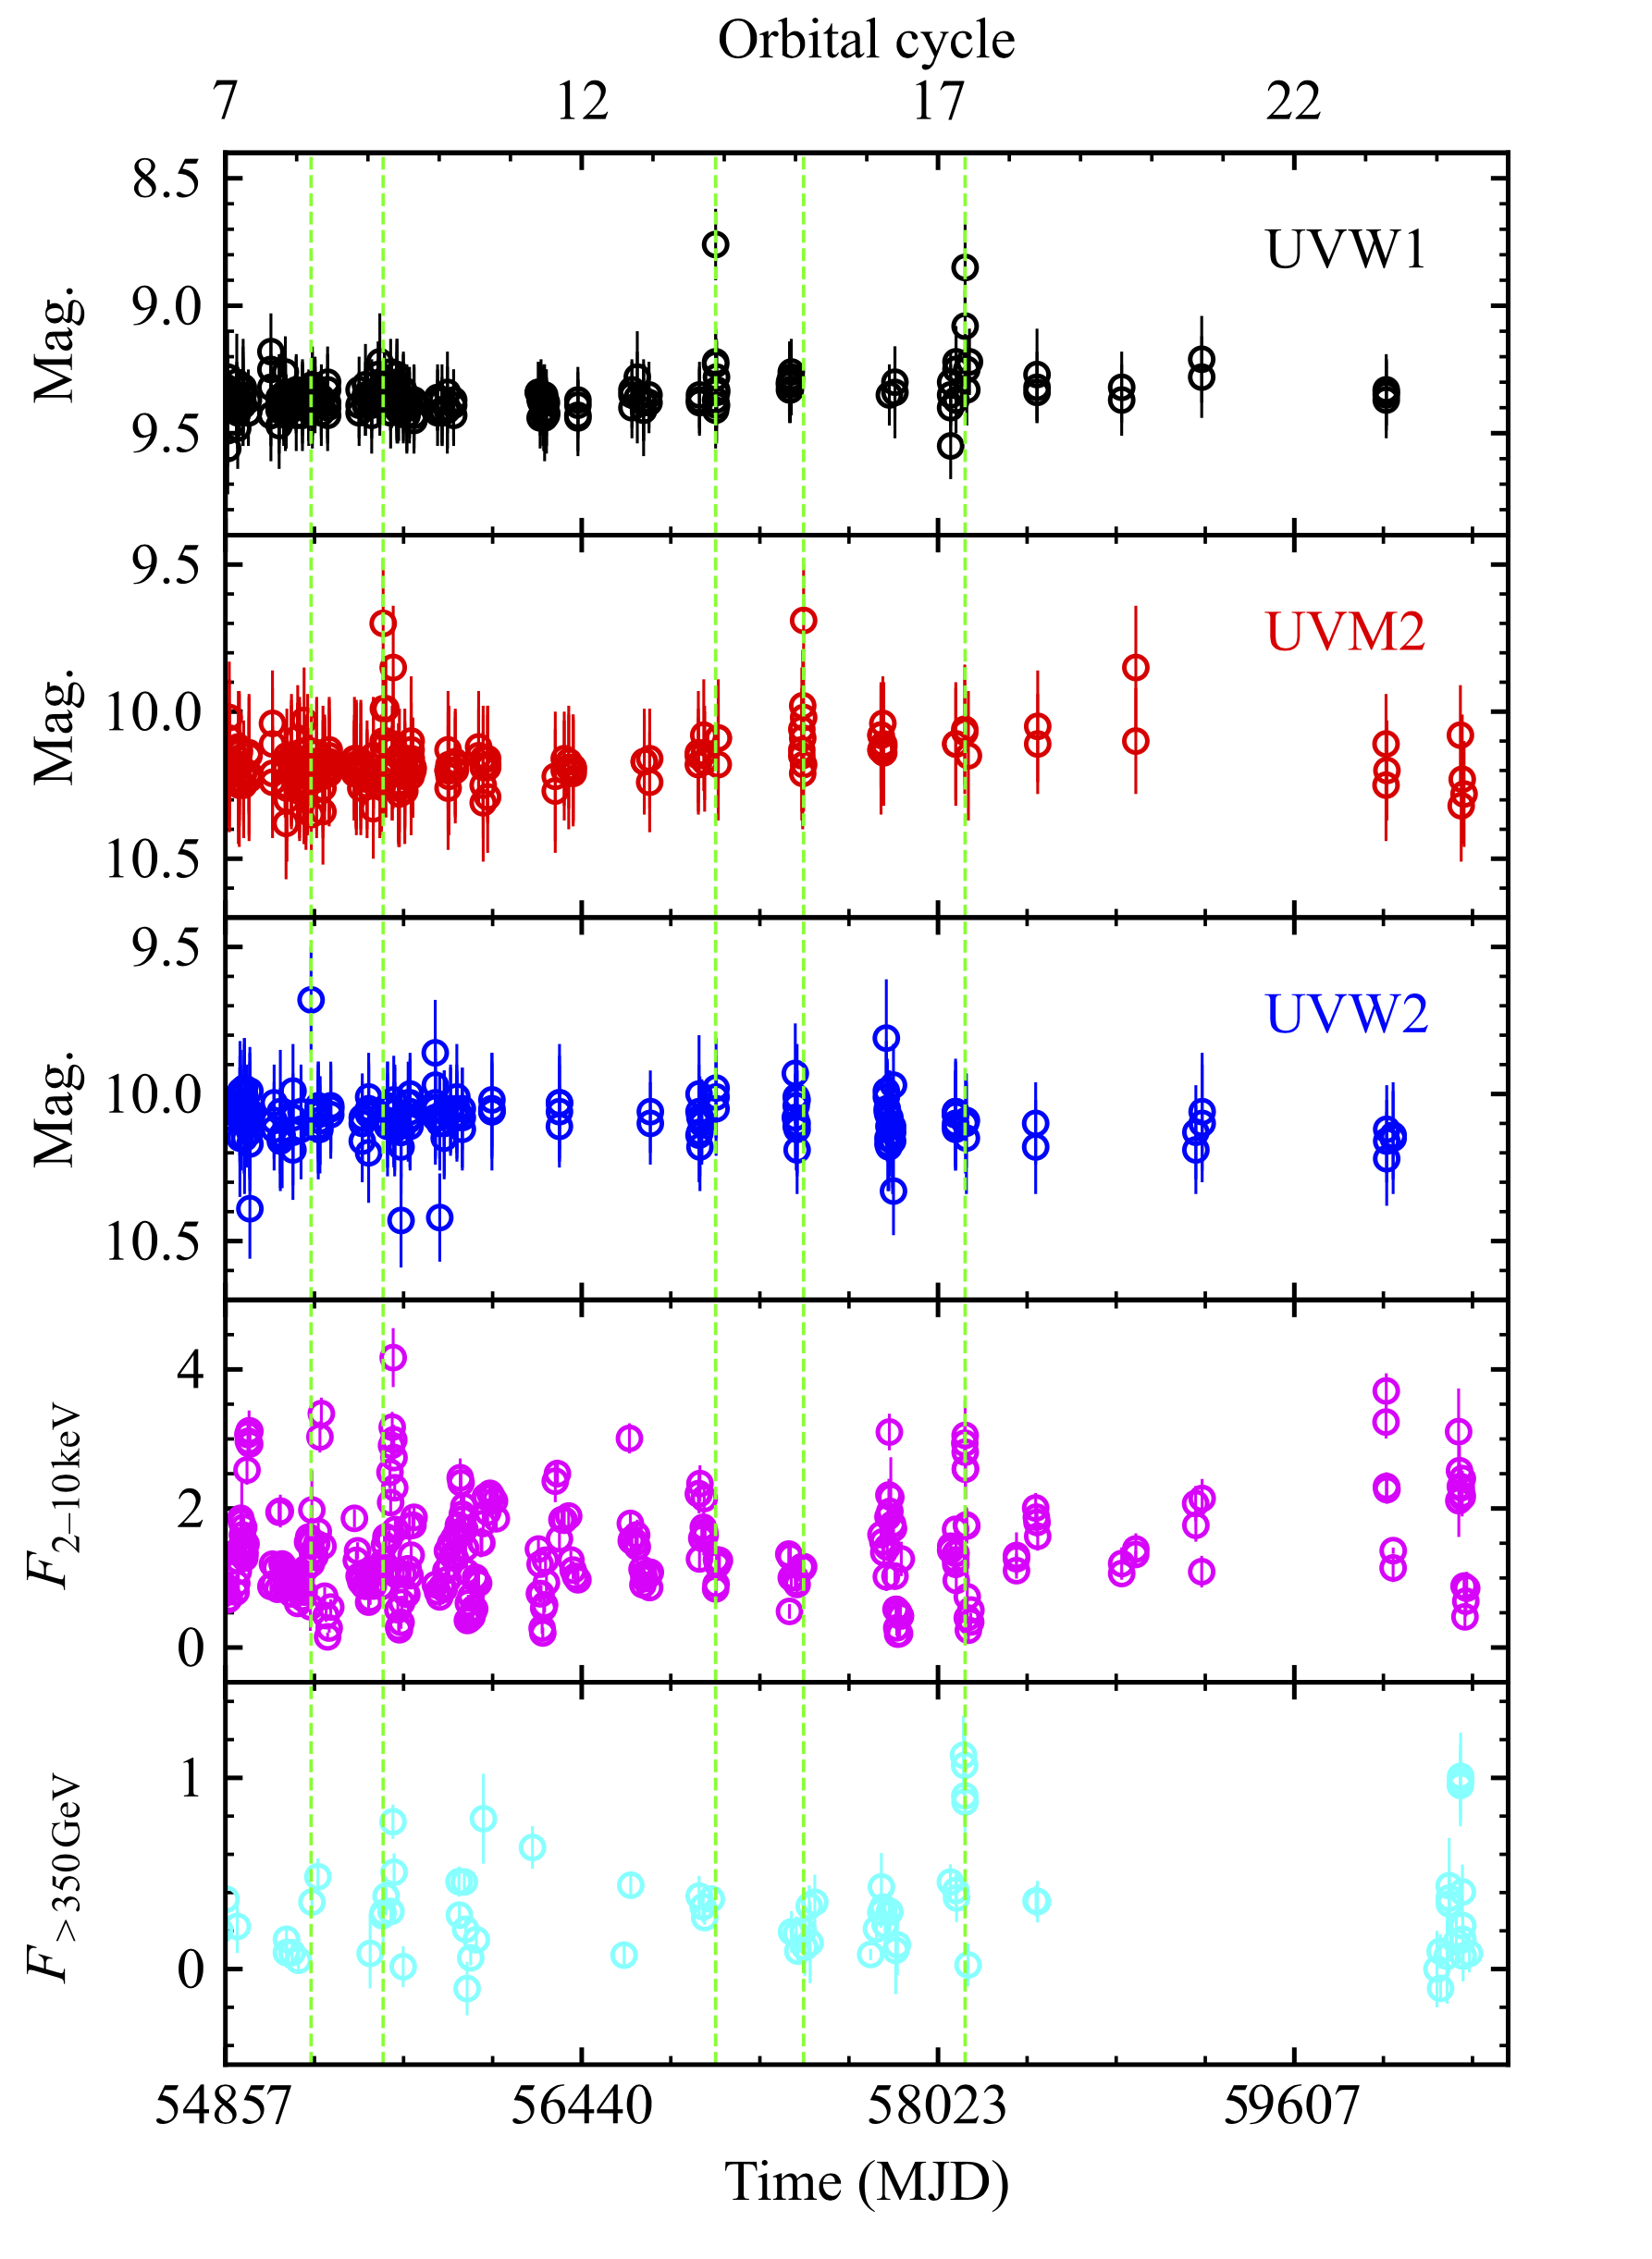
Figure 4: Unfolded UVOT light curves in UVW1, UVM2, and UVW2 bands (three panels from top). X-ray and TeV light curves, in units of 10−12ergs−1cm−2 and 10−11ergs−1cm−2, respectively, (Section4.1) are included in the bottom two panels for comparison. Vertical lines denote epochs of UV flares.
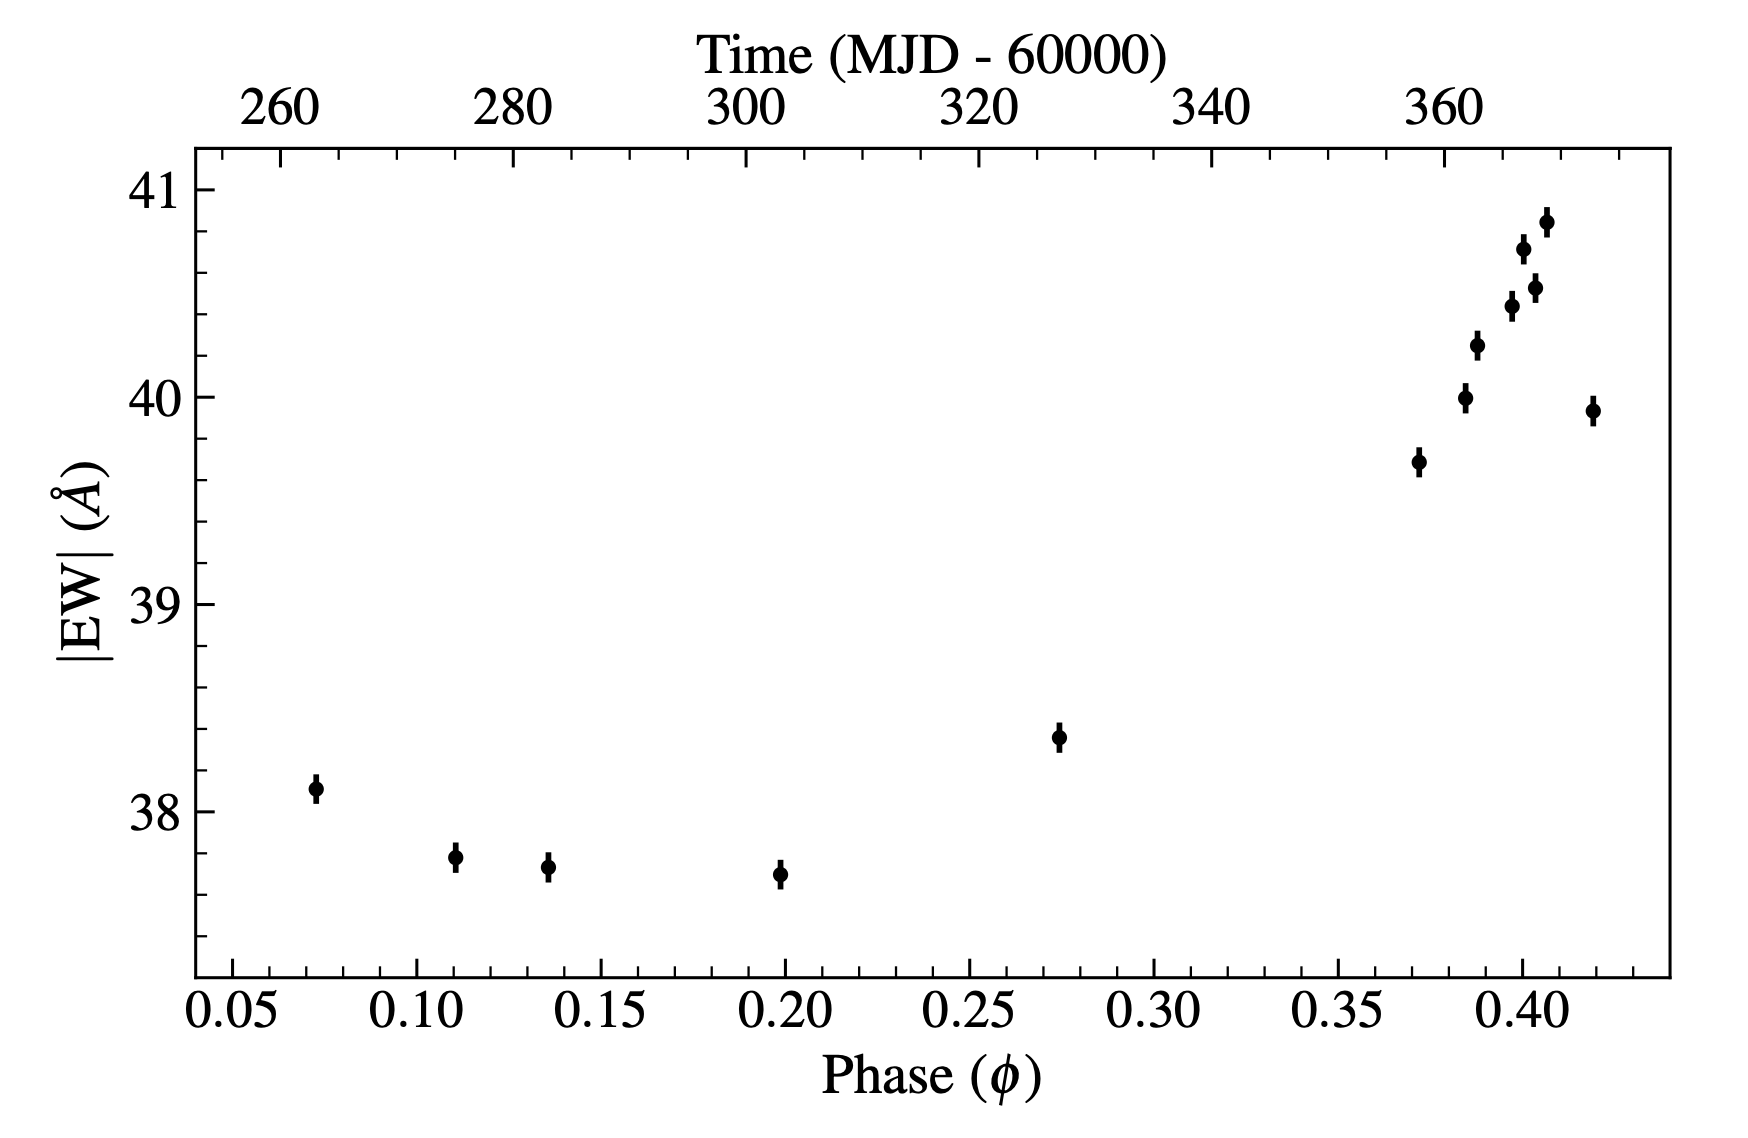
Figure 5: The Hα equivalent width measured during orbit 24.
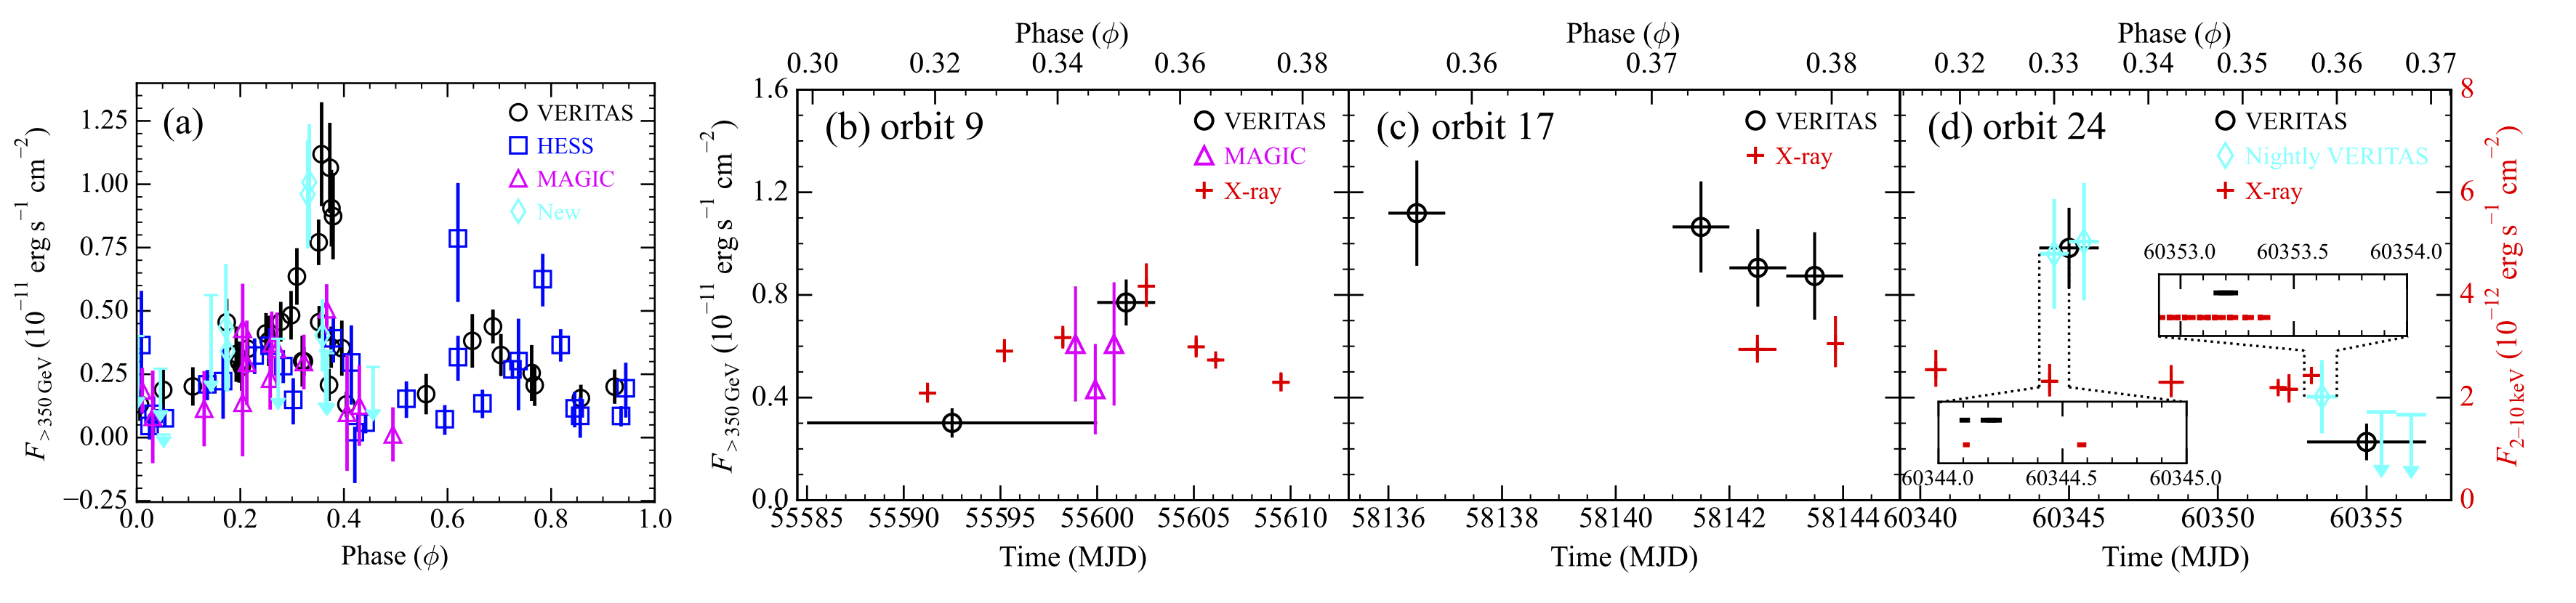
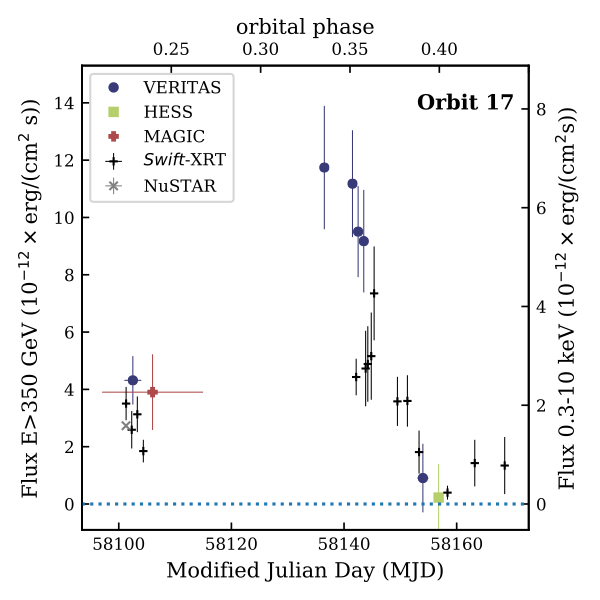
Figure 6: (a) Folded light curve of TeV gamma-ray emission (>350GeV) from J0632 measured by VERITAS, H.E.S.S, and MAGIC (see also Figure 9 of C.B. Adams et al. 2021). New VERITAS measurements from orbital cycle 24 are presented in cyan. (b–d) Unfolded light curves for orbital cycles 9, 17, and 24, respectively. Orbit 9 includes measurements obtained with MAGIC (magenta) and VERITAS (black). In each panel, black circles represent TeV flux measurements (left axis), and red crosses show the 2–10 keV X-ray flux (right axis). In panel (d), cyan diamonds represent daily TeV fluxes, and black circles show the results of an analysis using coarser time bins (see text). TeV fluxes with detection significances below 2σ are shown as 95% upper flux limits. Insets provide a visual representation of the X-ray (red) and TeV (black) observation periods to demonstrate overlapping exposures in orbit 24.
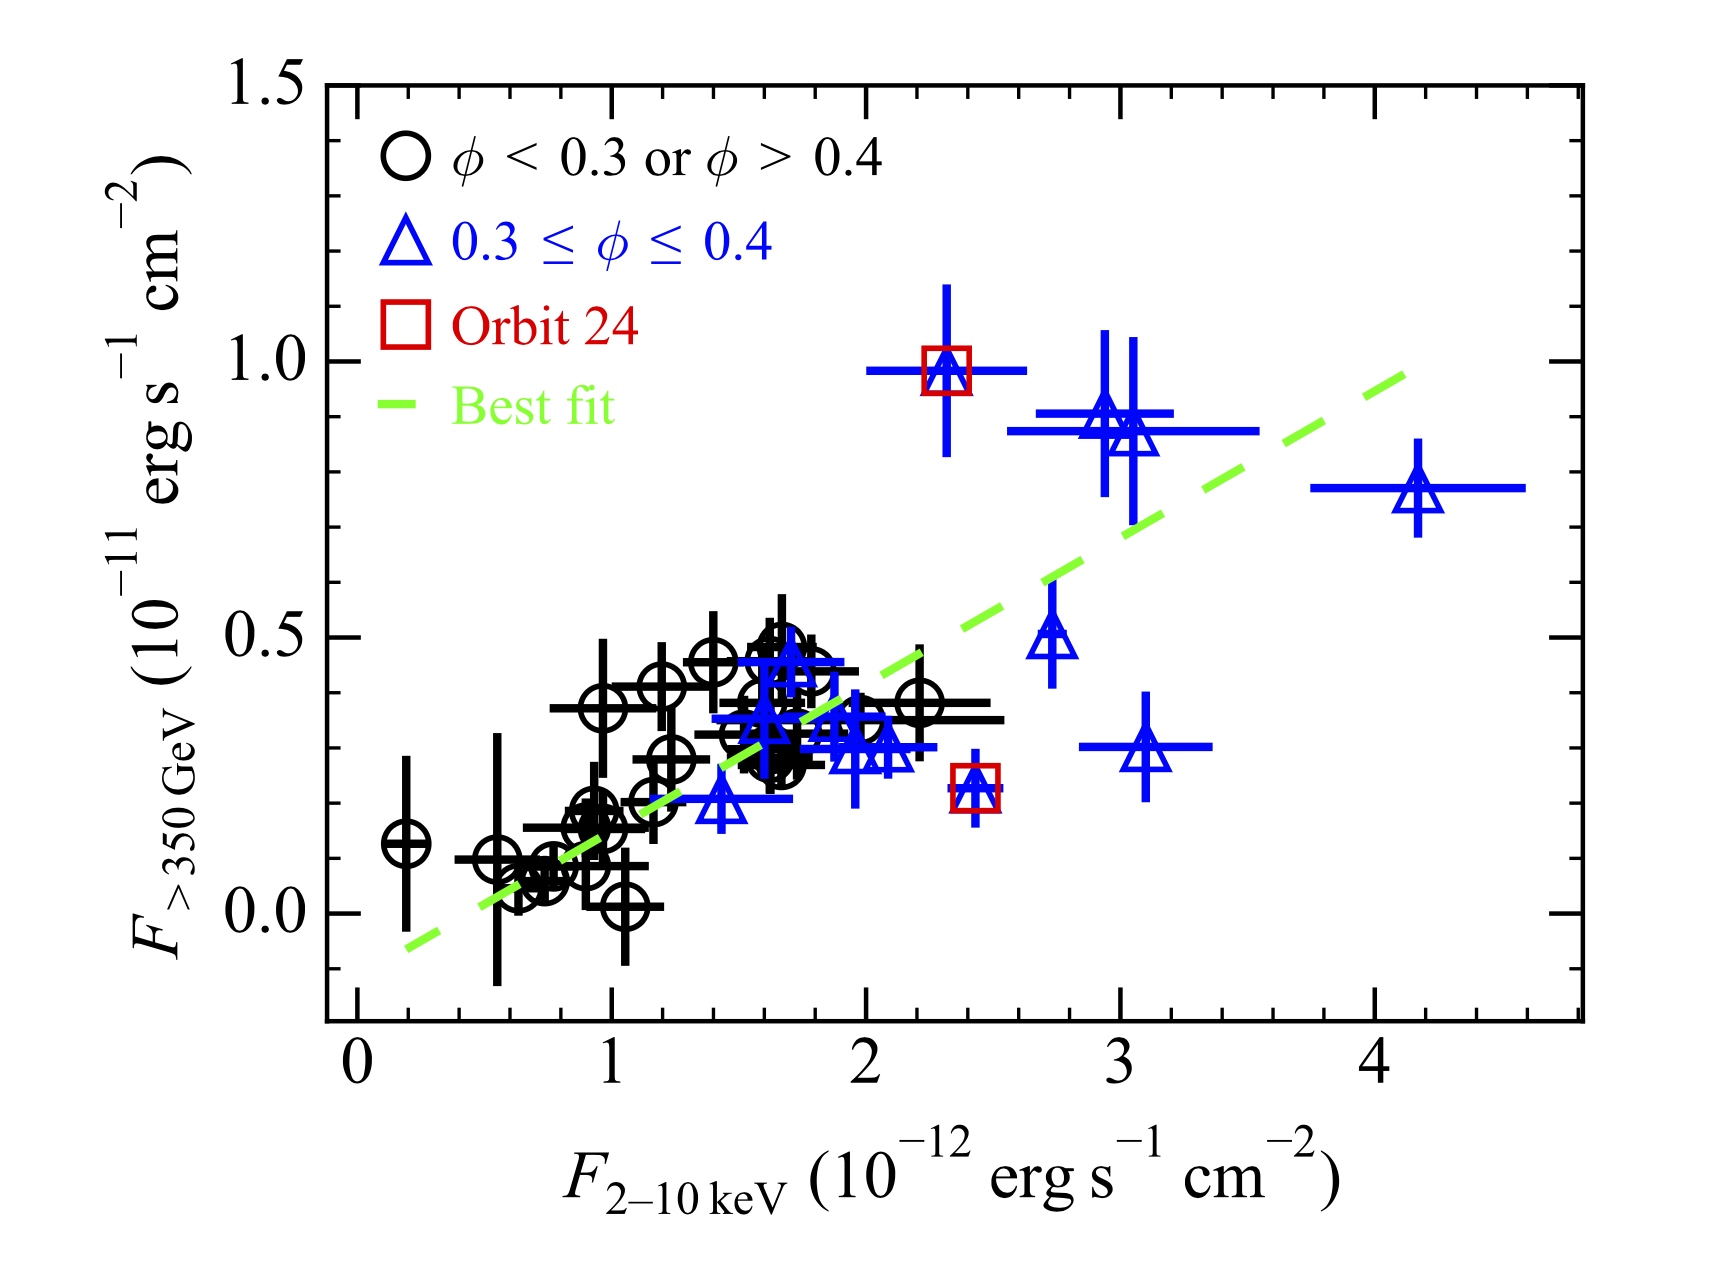
Figure 7: TeV flux (> 350GeV) vs. 2–10 keV X-ray flux for contemporaneous observations of J0632. The green dashed line represents the best-fit linear function derived from η2 minimization (see text for more detail).
