Pulsar halos are regions around middle-aged pulsars extending out to tens of parsecs. The large extent of the halos and well-defined central cosmic-ray accelerators make this new class of Galactic sources an ideal laboratory for studying cosmic-ray transport. LHAASO J0621+3755 is a candidate pulsar halo associated with the middle-aged gamma-ray pulsar PSR J0622+3749. We observed LHAASO J0621+3755 with VERITAS and XMM-Newton in the TeV and X-ray bands, respectively. For this work, we developed a novel background estimation technique for imaging atmospheric Cherenkov telescope observations of such extended sources. No halo emission was detected with VERITAS (0.3--10 TeV) or XMM-Newton (2--7 keV) within 1 degree and 10 arcmin around PSR J0622+3749, respectively. Combined with the LHAASO-KM2A and Fermi-LAT data, VERITAS flux upper limits establish a spectral break at ~1--10 TeV, a unique feature compared with Geminga, the most studied pulsar halo. We model the gamma-ray spectrum and LHAASO-KM2A surface brightness as inverse Compton emission and find suppressed diffusion around the pulsar, similar to Geminga. A smaller diffusion suppression zone and harder electron injection spectrum than Geminga are necessary to reproduce the spectral cutoff. A magnetic field ≤ 1 uG is required by our XMM-Newton observation and synchrotron spectral modeling, consistent with Geminga. Our findings support slower diffusion and lower magnetic field around pulsar halos than the Galactic averages, hinting at magnetohydrodynamic turbulence around pulsars. Additionally, we report the detection of an X-ray point source spatially coincident with PSR J0622+3749, whose periodicity is consistent with the gamma-ray spin period of 333.2 ms. The soft spectrum of this source suggests a thermal origin.
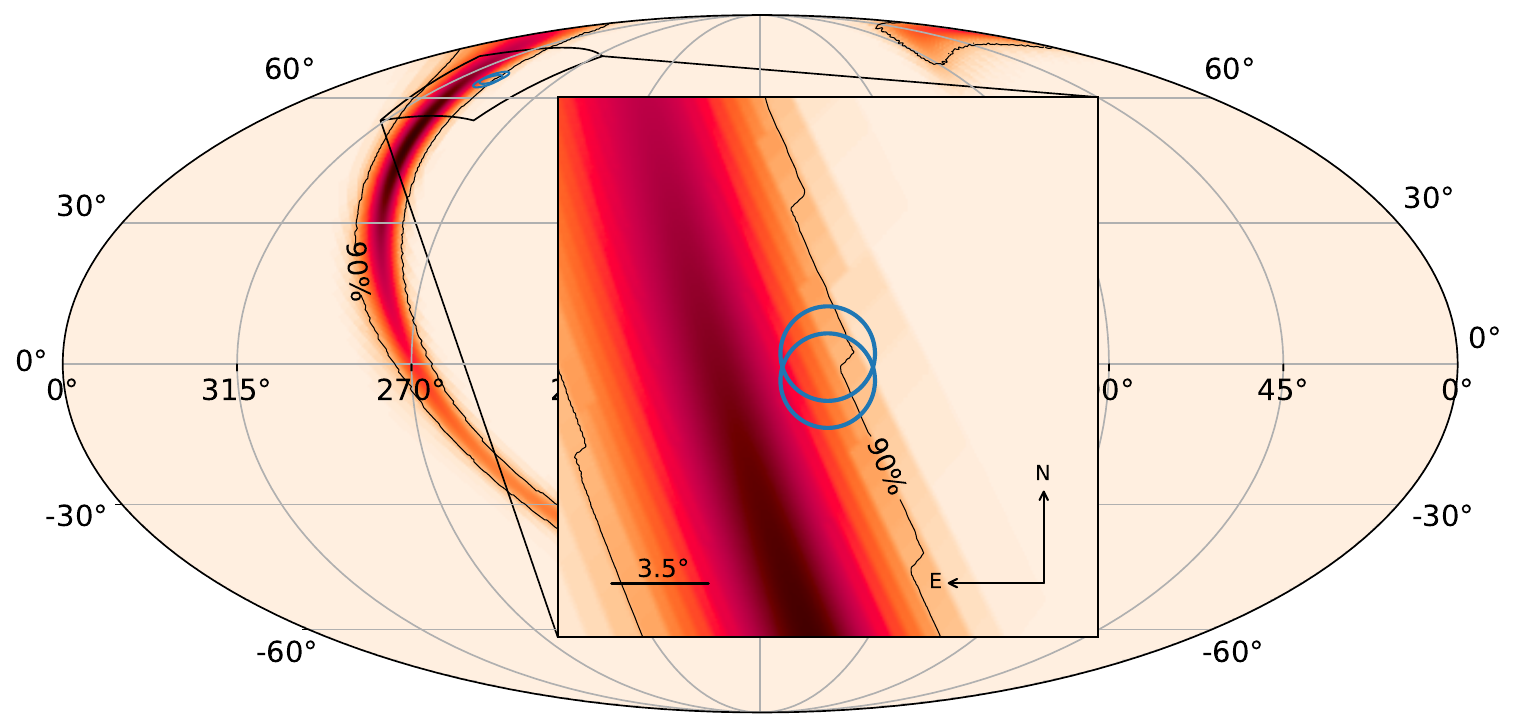
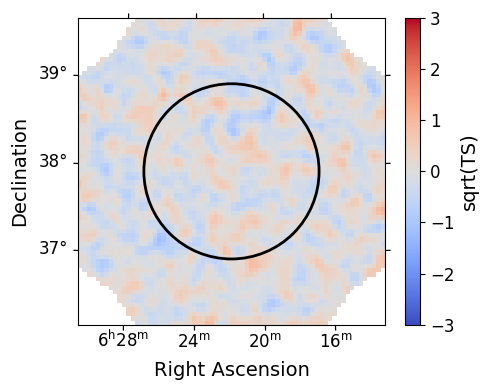
Figure 1: Left: A significance map (3.5o × 3.5o ) of the region around LHAASO J0621+3755 in 0.3–10 TeV. The source region (86% containment region of 1LHAASO J0622+3754, a circular region with a radius of 1o centered at the centroid of LHAASO J0621+3755) is overlaid with a black solid line. The pixel size is 0.05o × 0.05o , and the image was smoothed using a Gaussian kernel (σ = 1 pixel). Right: TeV gamma-ray SED of LHAASO J0621+3755. The 95% VERITAS flux upper limits for a circular region with a radius of 1o from this work (black), LHAASO KM2A flux points and 95% flux upper limit from Aharonian et al. (2021) (blue), LHAASO WCDA and KM2A best-fit power-law spectral models (yellow and red solid lines, respectively) and statistical uncertainties (grey shaded area) for 1LHAASO J0622+3754 are overlaid. The LHAASO flux points, upper limits, spectral models and uncertainties were scaled to the same region size as the VERITAS source region size for comparability.
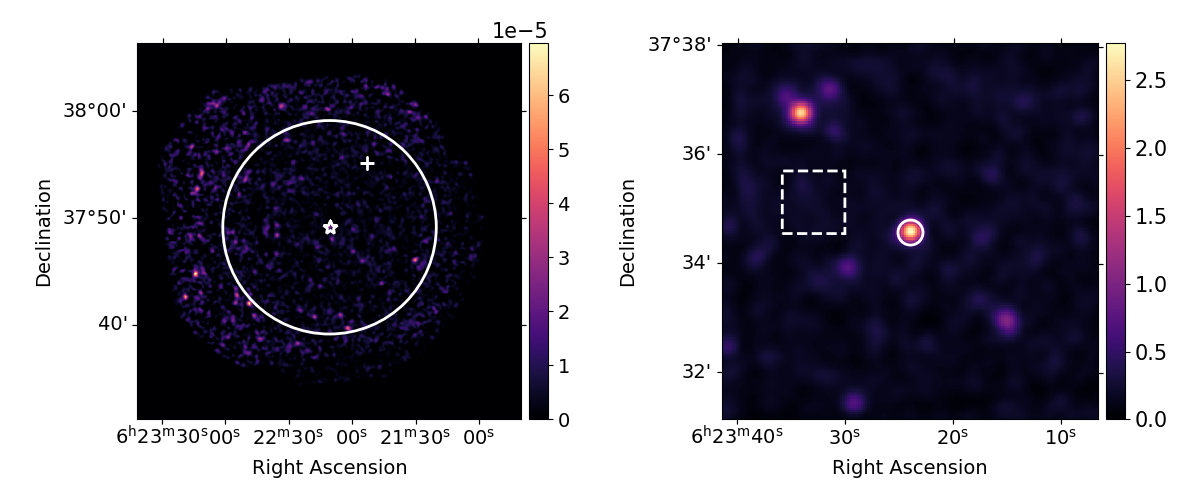

Figure 2: Left: Mosaiced, background-subtracted, and exposure-corrected image of the XMM-Newton FoV in 2–7 keV. The white circle (radius 10′ centered at PSR J0622+3749) marks the source region from which the flux upper limit for a putative halo was calculated. The location of PSR J0622+3749 and the centroid of LHAASO J0621+3755 are marked with a white star and a white cross, respectively. Right: Observation ID 923400101 MOS2 counts map in 0.2–3 keV around PSR J0622+3749 (0.2o × 0.2o). The source and background regions for the pulsar spectrum are marked with solid circle and dashed box, respectively.
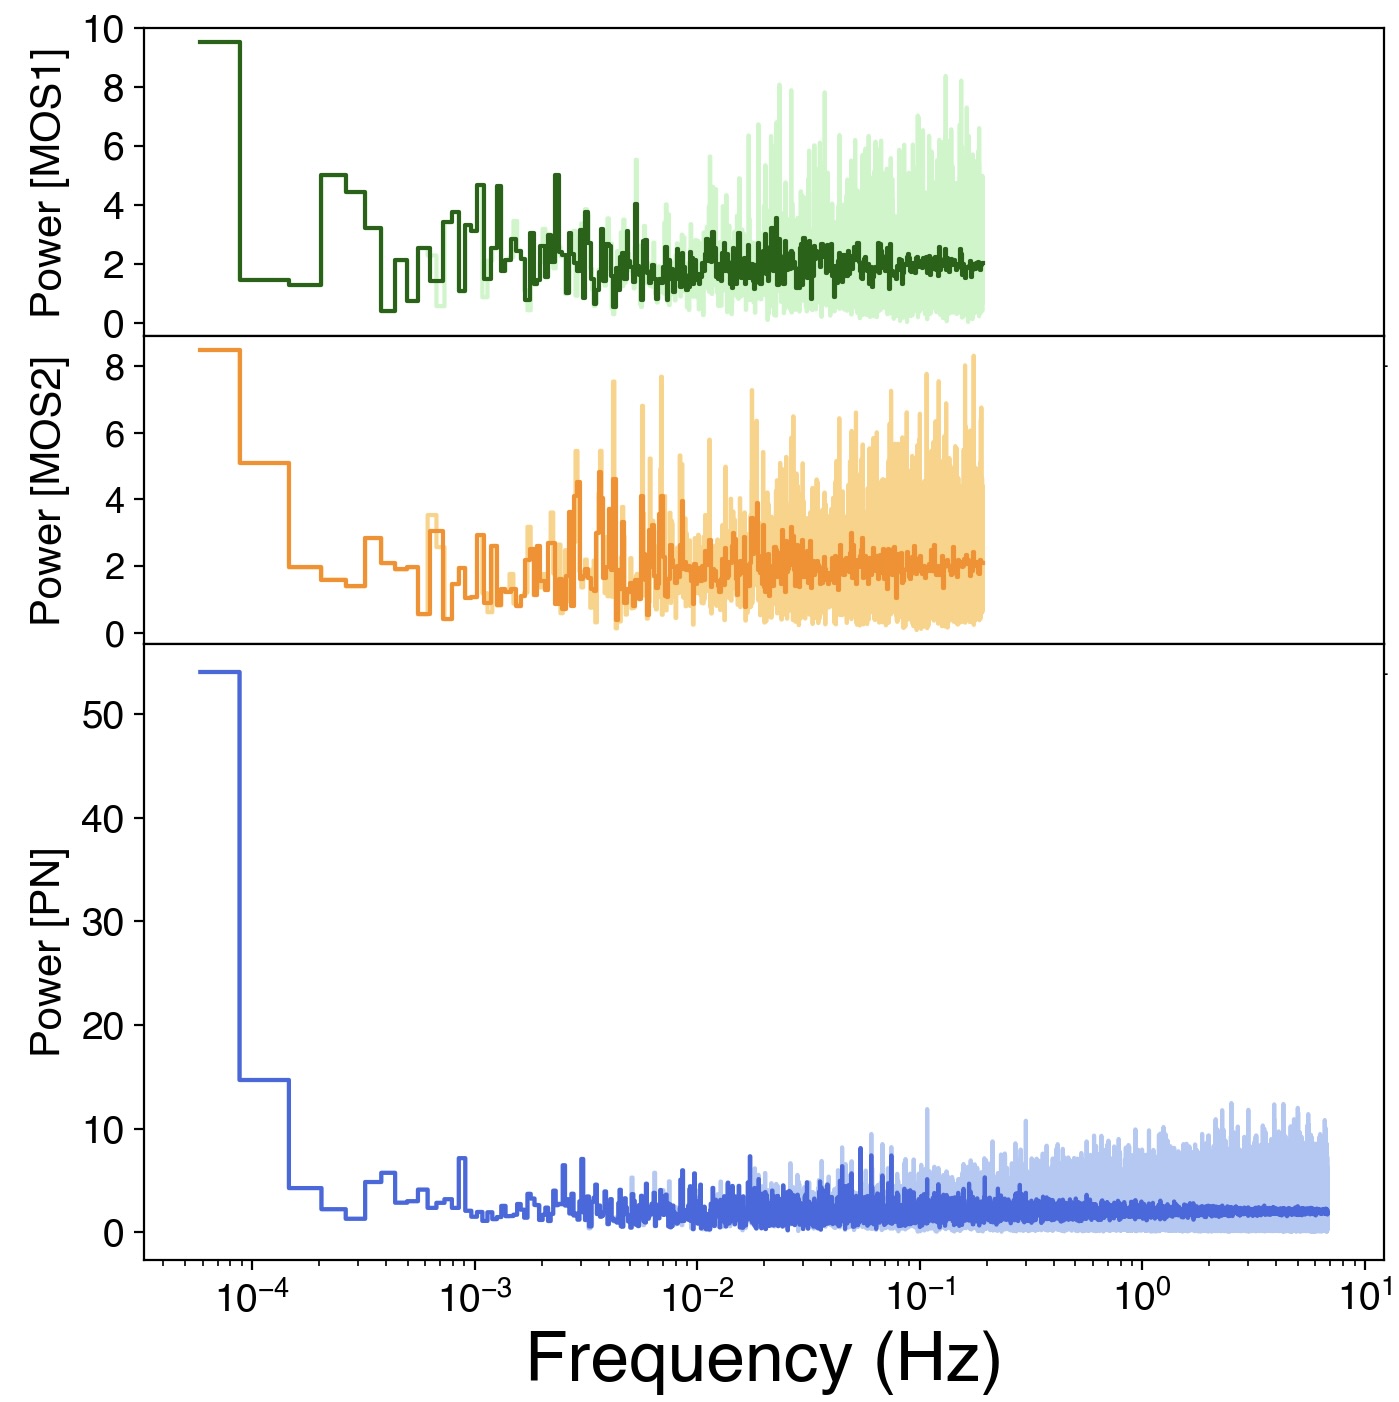
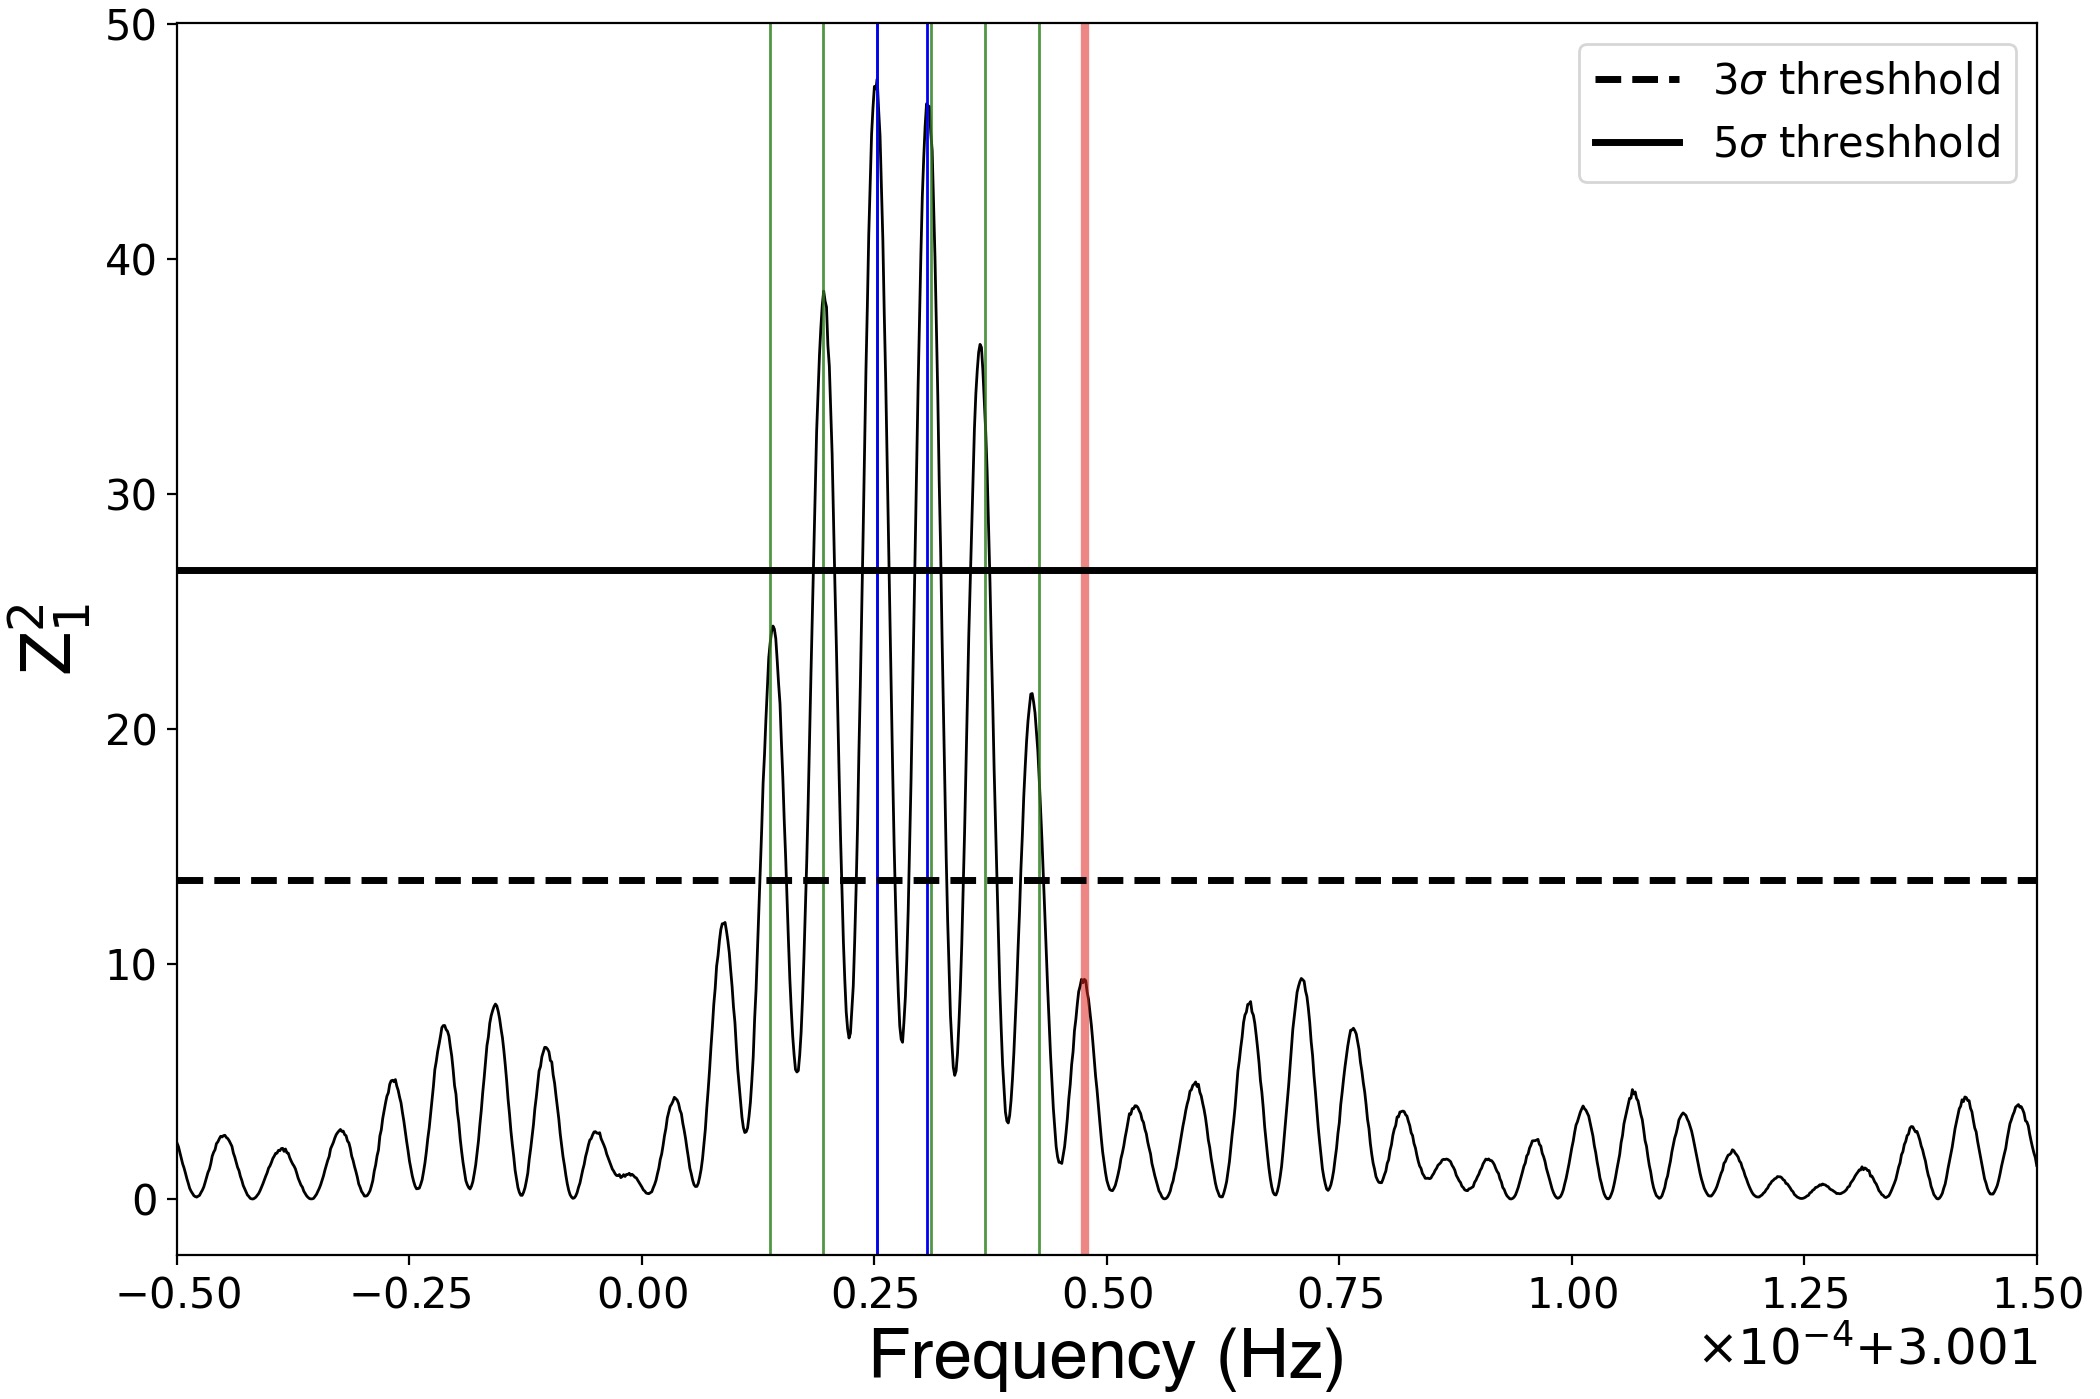
Figure 3: Left: The PDS from the MOS1, MOS2, and PN lightcurves (ordered from top to bottom). Both the unbinned (ligher colors) and log-rebinned (darker colors) PDSs have been presented. The PDSs are cut off at f = 0.192 Hz for MOS1/2 and f = 6.81 Hz for PN, adhering to the timing resolution of each instrument. Right: The Z21 periodogram for the combined PN lightcurve. An oversampling factor of 32 was used. The red line is the expected frequency calculated from the gamma-ray ephemeris. The blue lines are the most significant peak (at 3.001025 Hz) and the second most significant peak (at 3.001030 Hz). The green lines represent the aliasing of the most significant peak due to the orbital period of XMM-Newton.
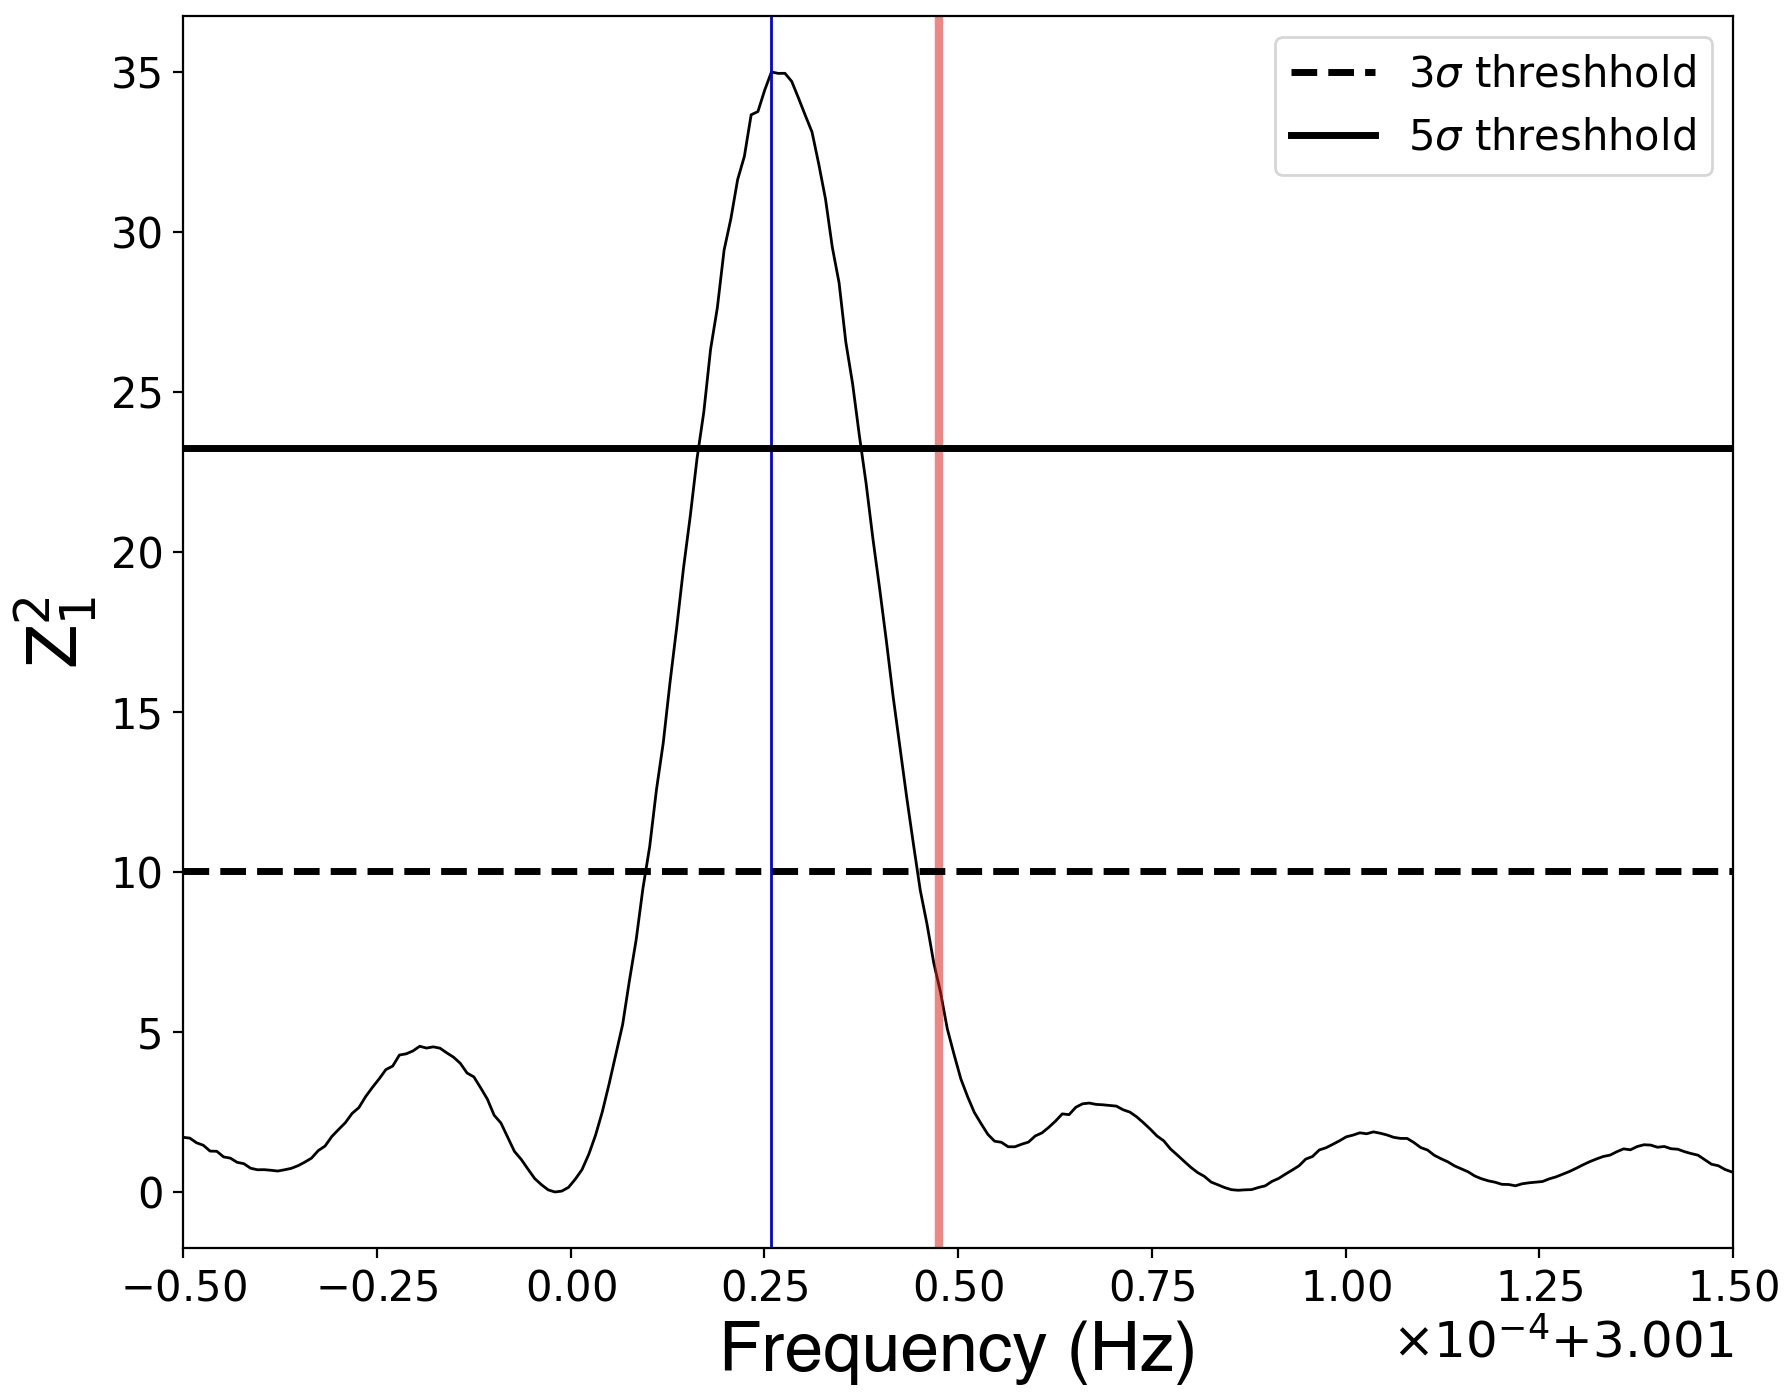
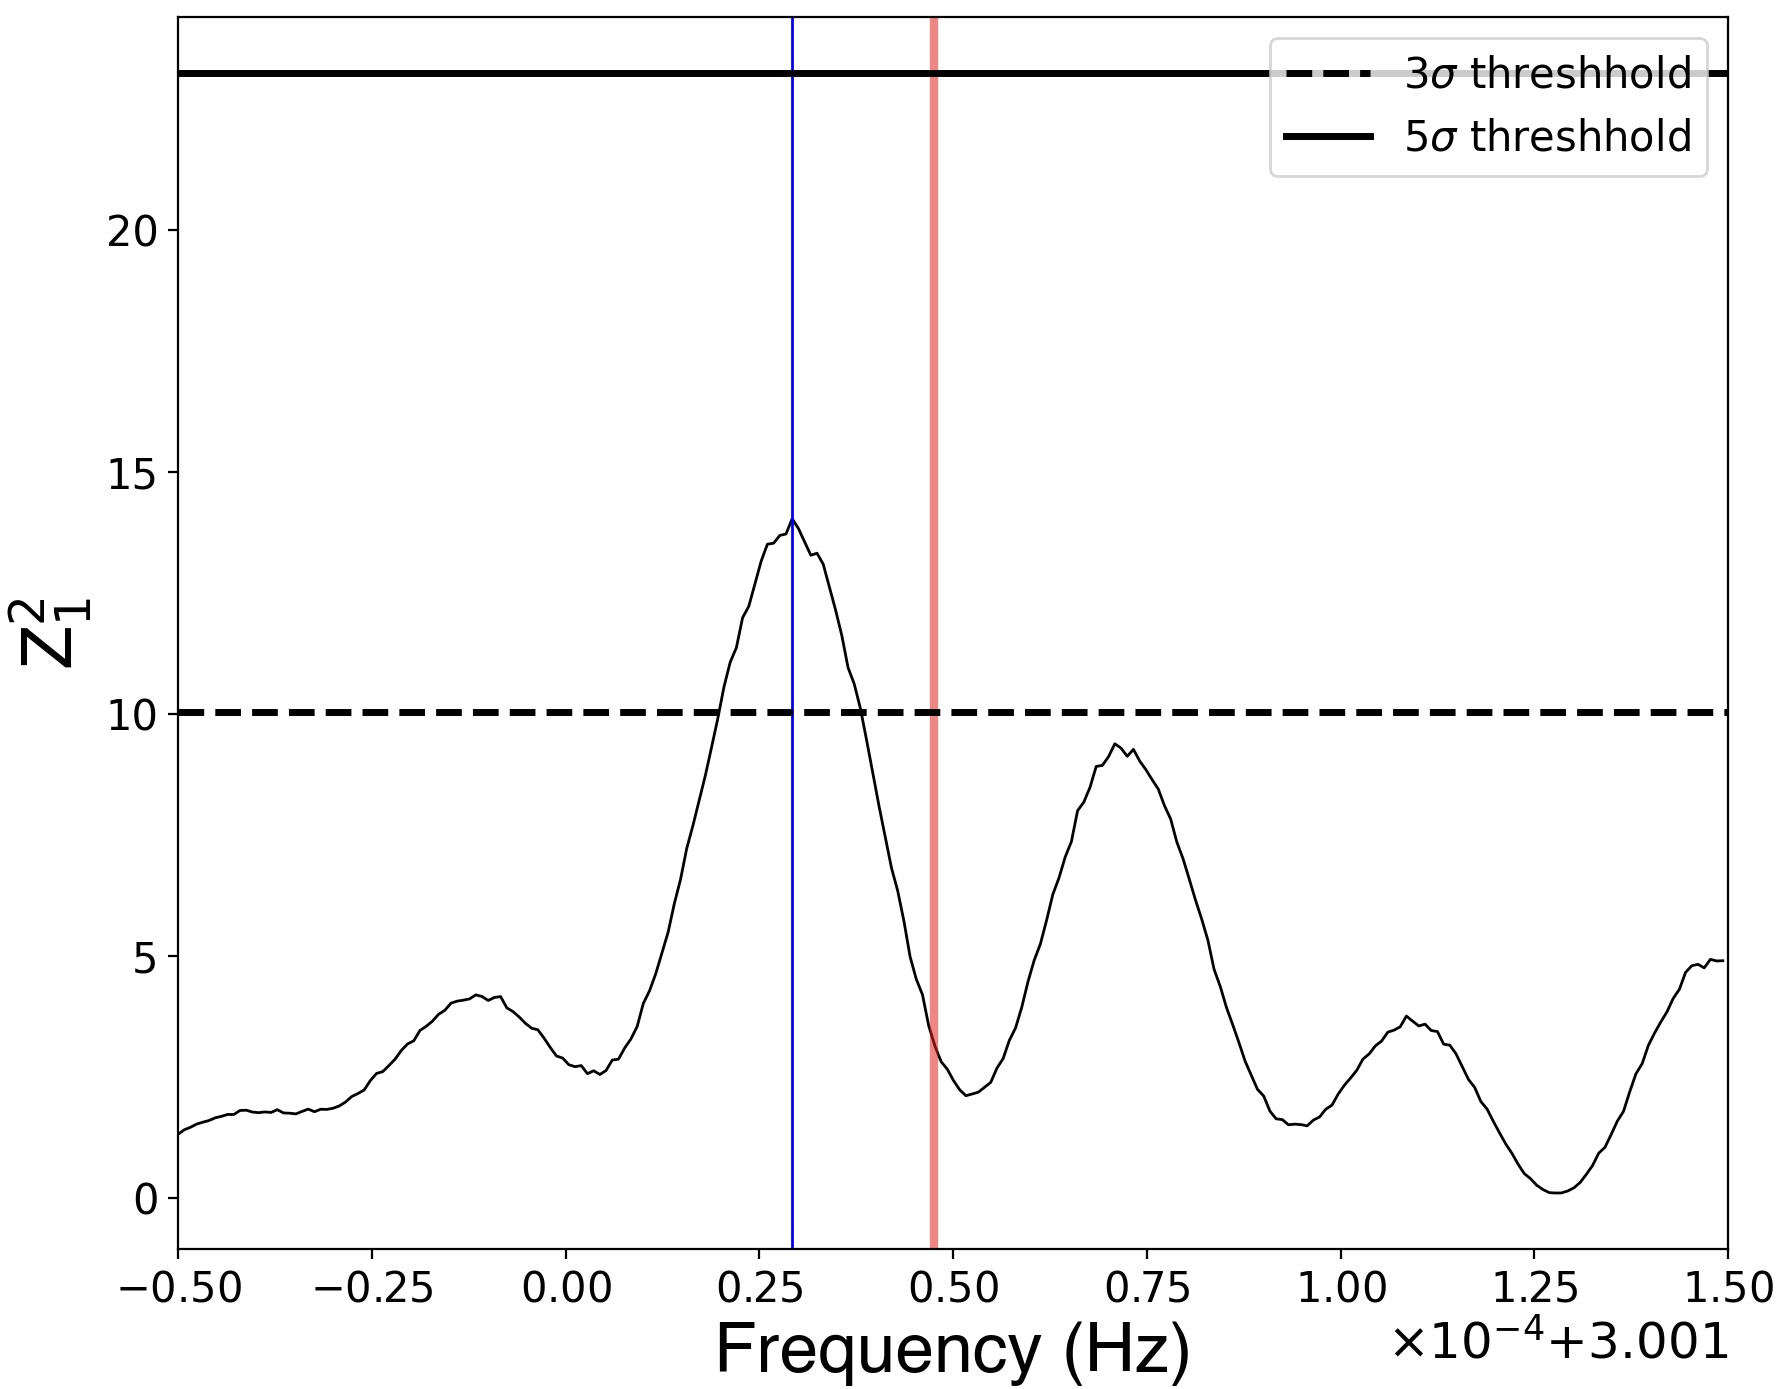
Figure 4: The Z21 periodogram for the PN lightcurve of the 0923400101 observation. The blue line is the most significant peak (at 3.001026 Hz). Right: The Z21 periodogram for the PN lightcurve of the 0923400601 observation. The blue line is the most significant peak (at 3.001029 Hz). As in Figure 3, the red line in both panels is the expected frequency calculated from the gamma-ray ephemeris.
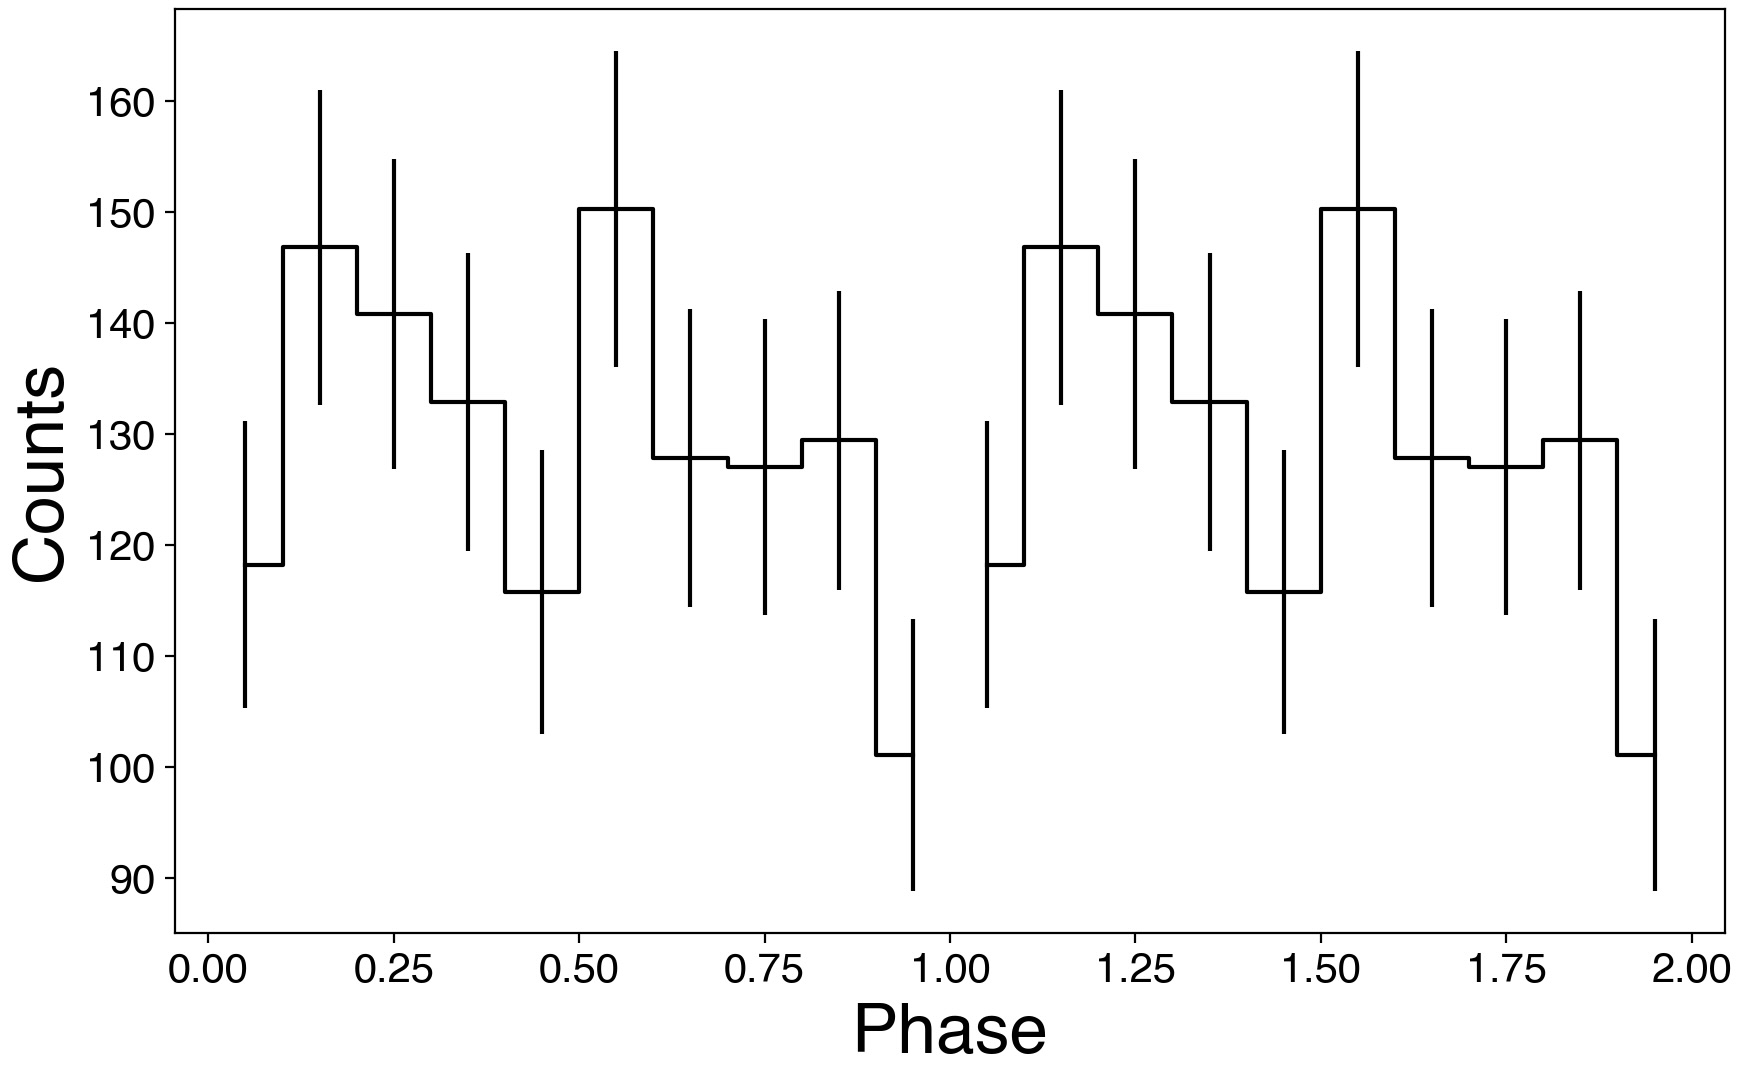
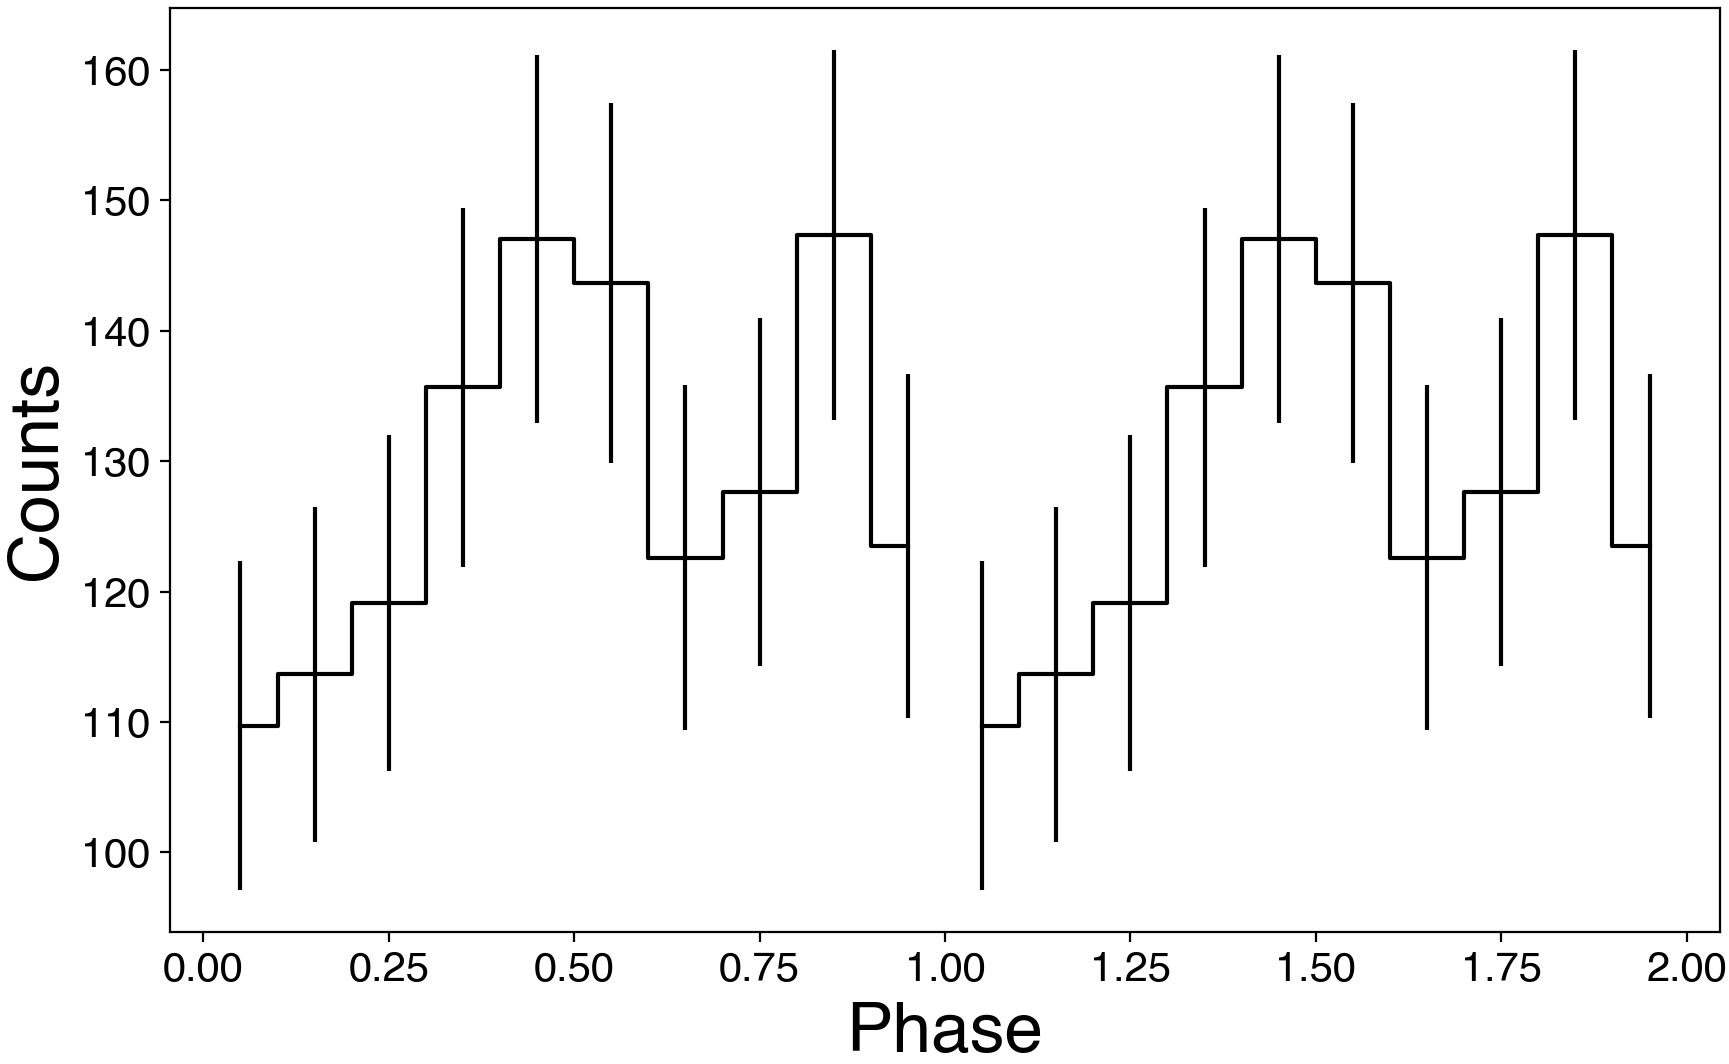
Figure 5: Left: The background-subtracted PN lightcurve folded over P = 0.332195 into 10 phase bins. Right: The background-subtracted PN lightcurve folded over P = 0.332189 into 10 phase bins. The folding is done over these two nearly identical periods as the heavy aliasing seen in Figure 3 caused both periods to be detected with equal likelihood. In both cases, the large error bars preclude us from pursuing further analysis.
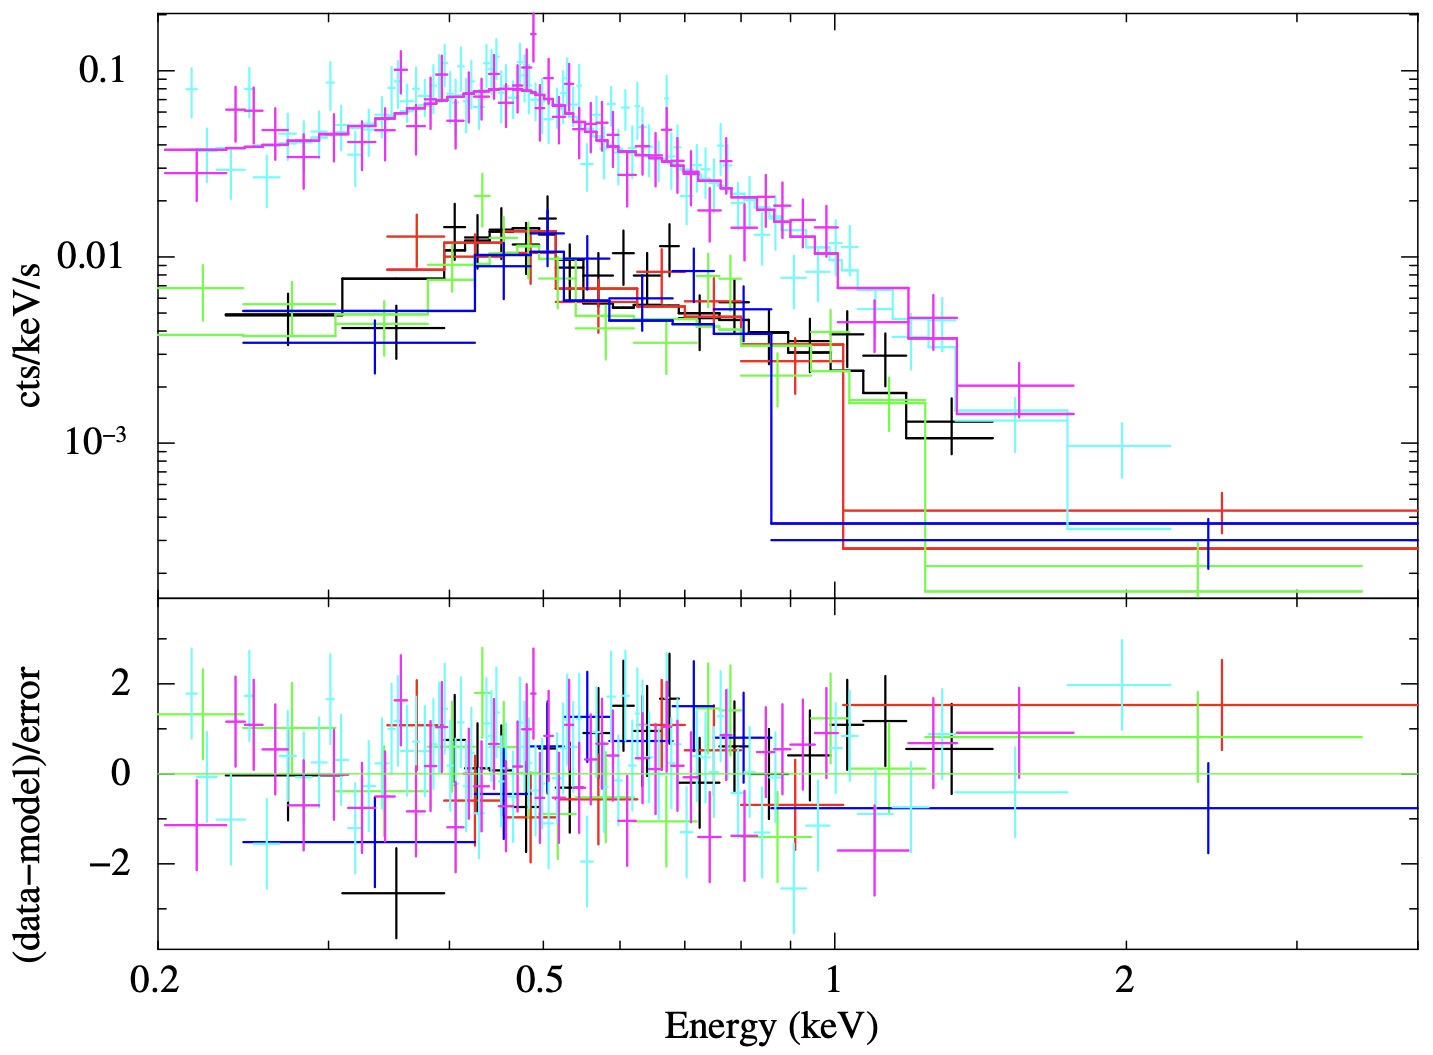
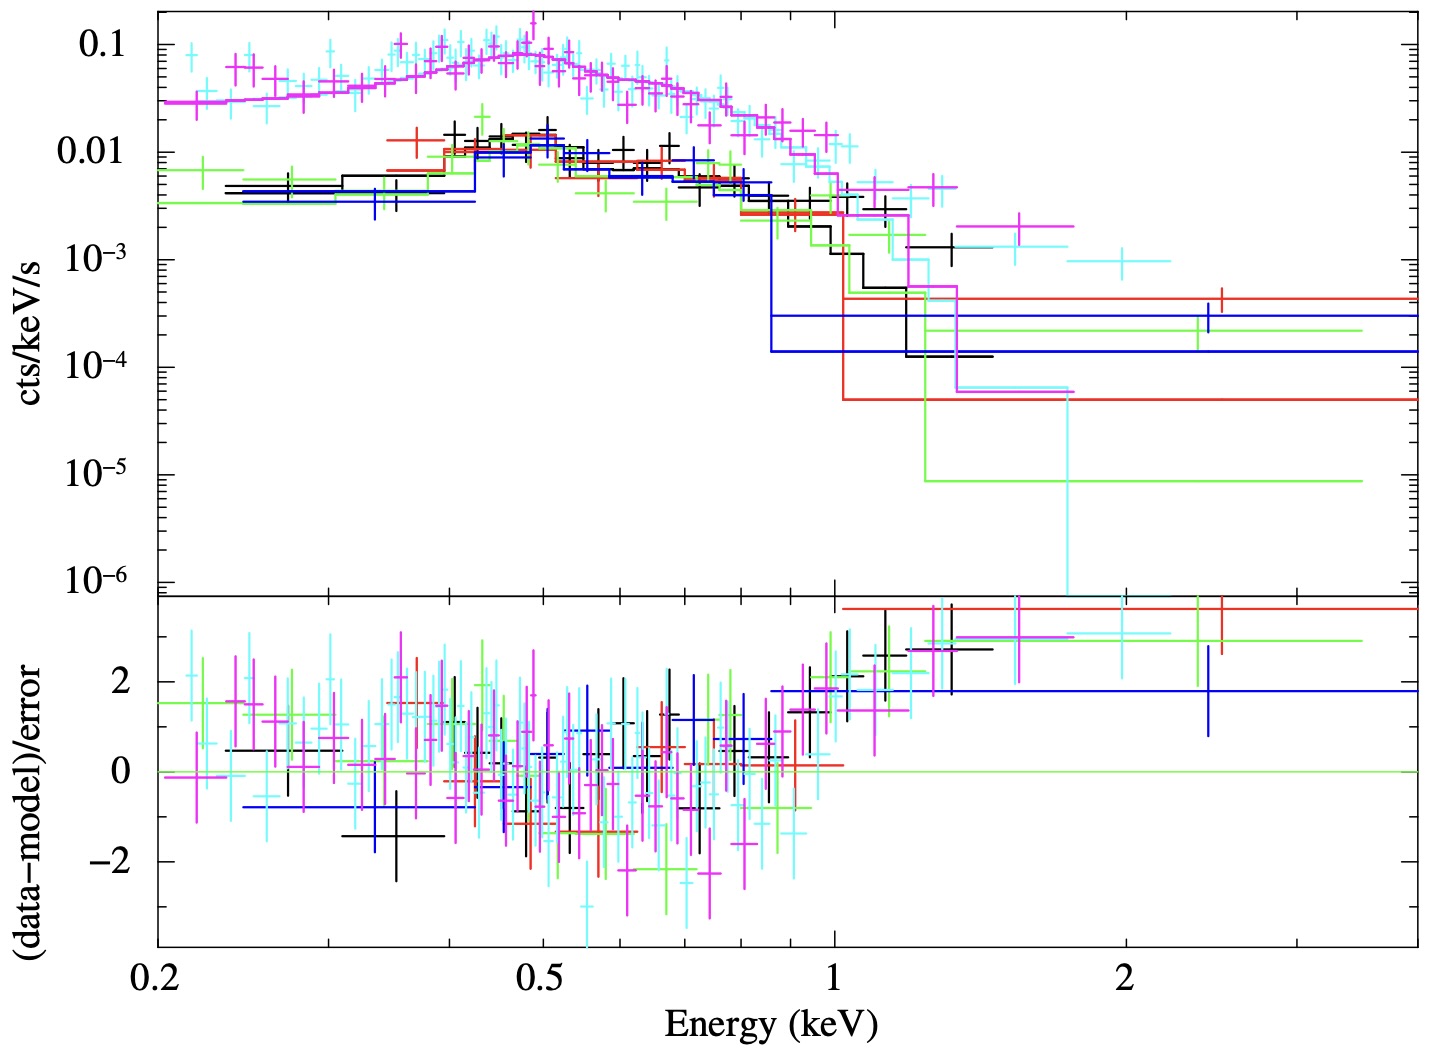
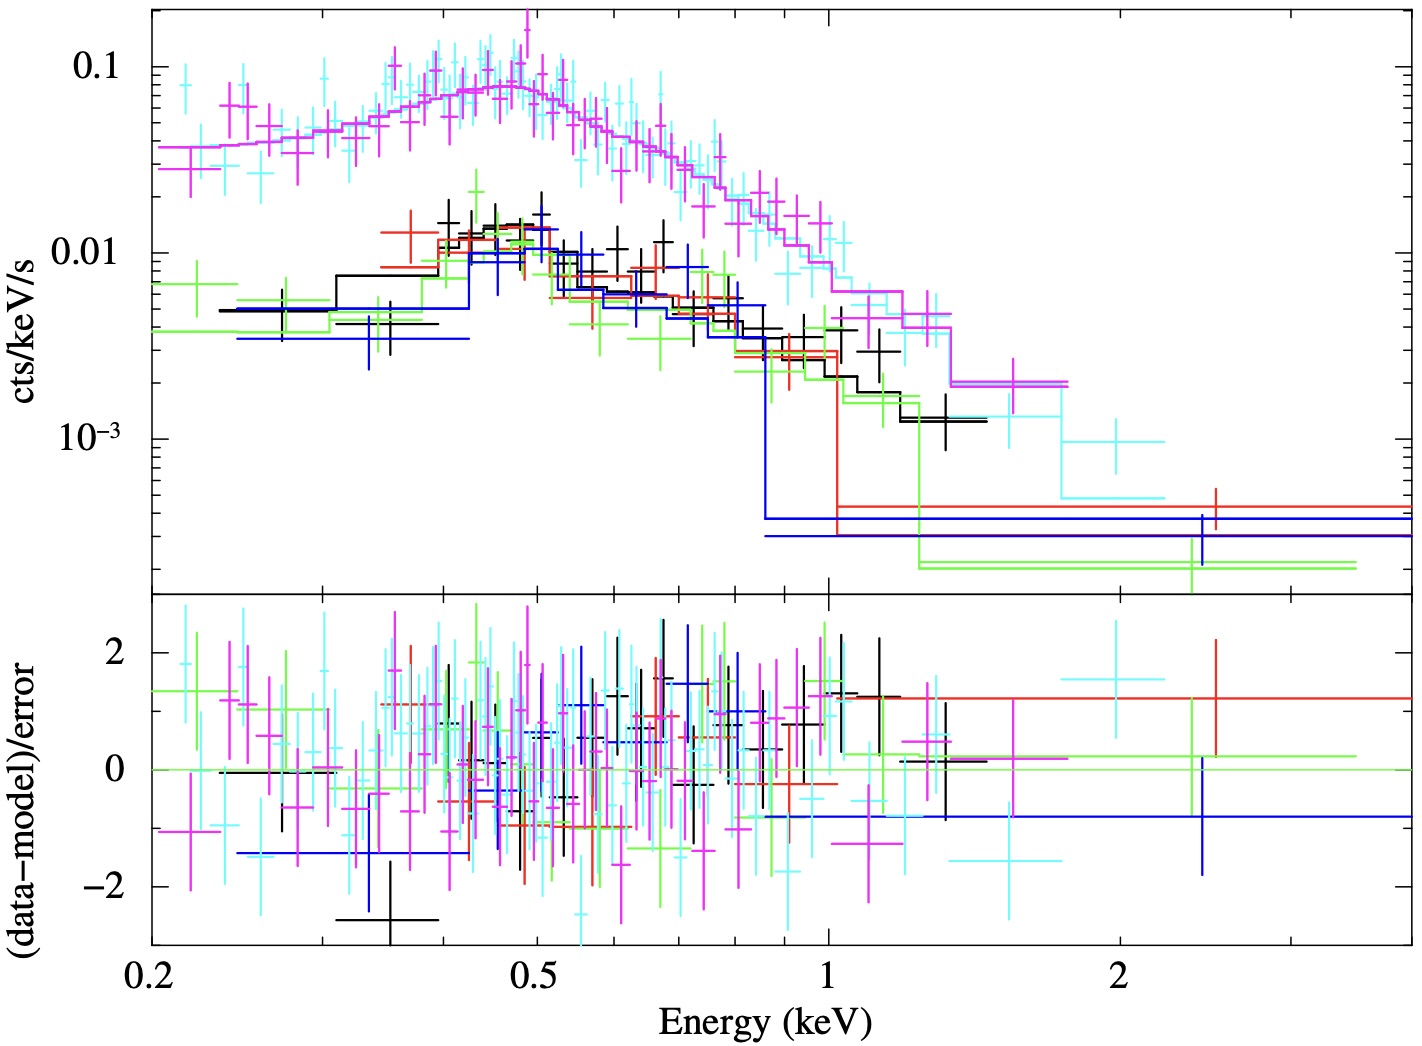
Figure 6: Left: The phase-averaged XMM-Newton spectra of PSR J0622+3749 fit with an absorbed pow model. Right: The same spectra fit with an absorbed bbodyrad model. In both panels, different colors are for different spectra (three instruments × two observations = six spectra).
Figure 7: Left: The phase-averaged XMM-Newton spectra of PSR J0622+3749 fit with an absorbed 2*bbodyrad model. Right: The same spectra fit with an absorbed nsmax(H) model. The B-field is fixed to B = 4 × 10¹²G while the gravitational redshift is fixed to zg = 0.30. In both panels, different colors are for different spectra (three instruments × two observations = six spectra).
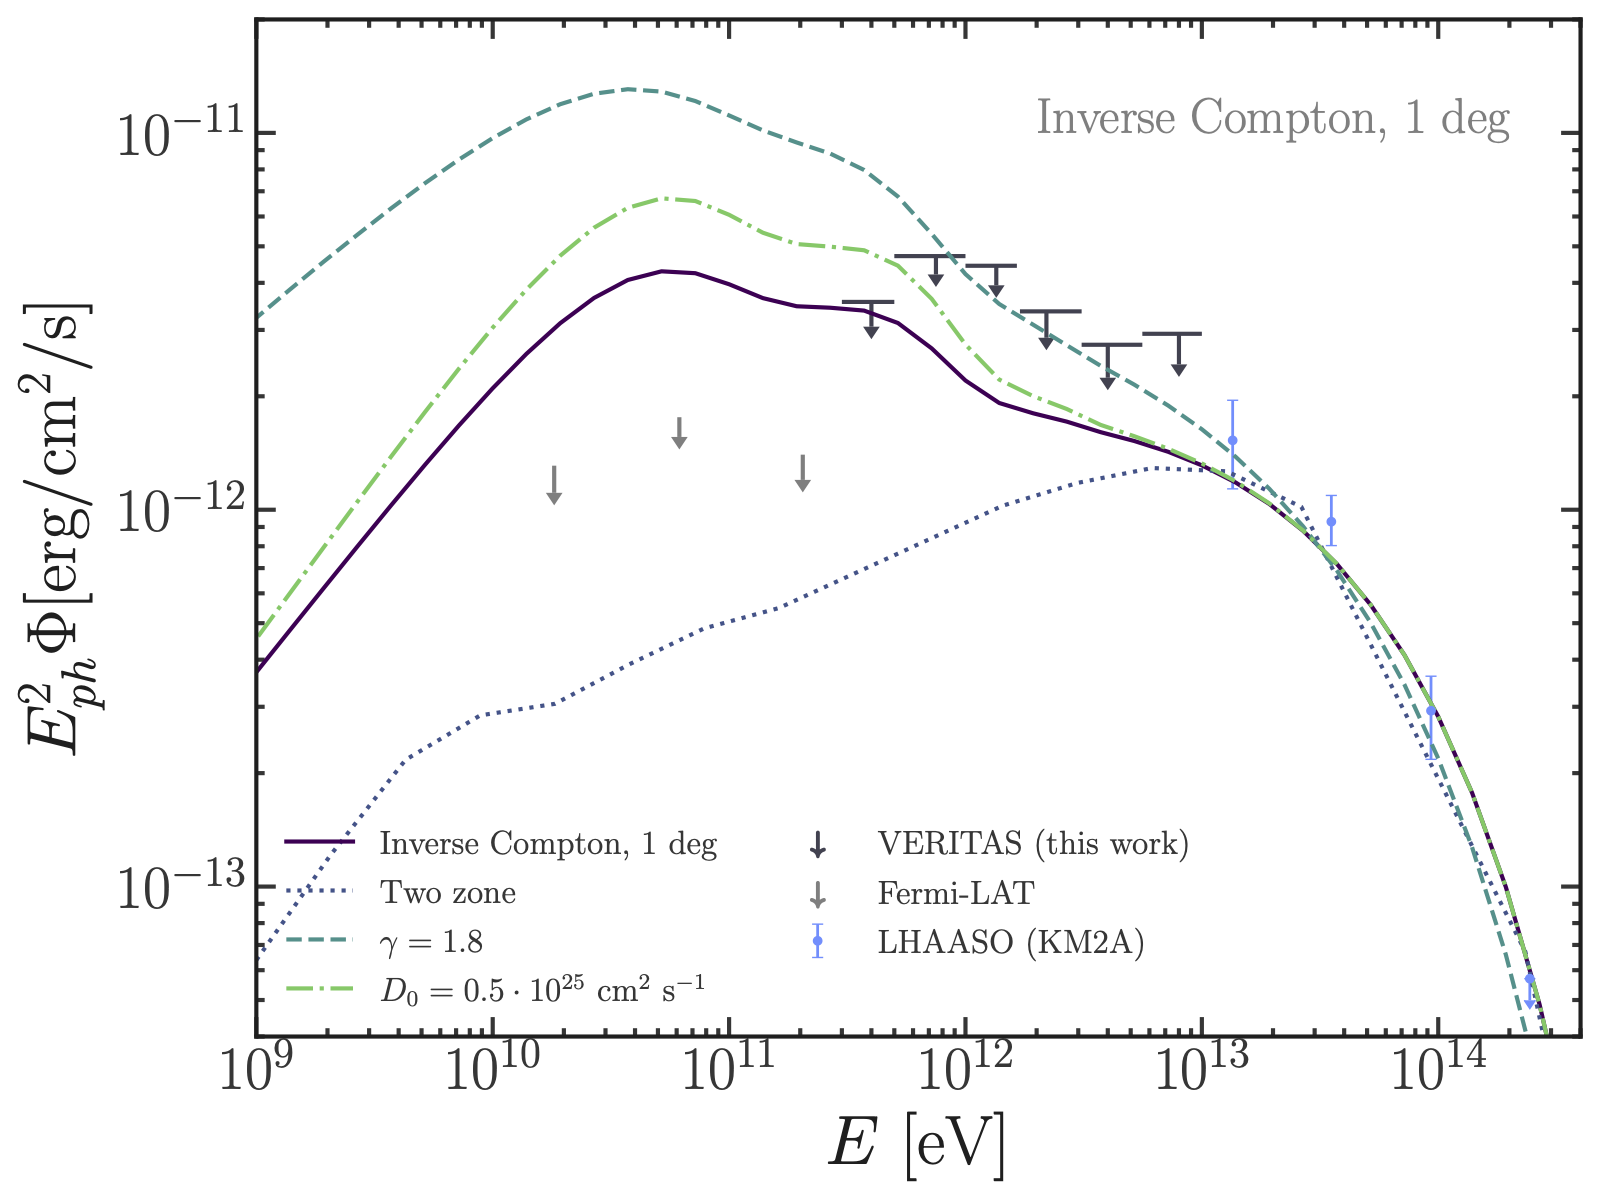
Figure 8: IC SED models of LHAASO J0621+3755 integrated over a 1o region around PSR J0622+3749. The LHAASO-KM2A and Fermi-LAT flux points (blue points and gray arrows, Aharonian et al. (2021)) and VERITAS flux upper limits (black arrows, this work) are overlaid. The solid black line represents the benchmark model (see text for details). The effects of changing the diffusion model (blue dotted line), the injection spectral index (blue dashed line), and the diffusion coefficient (green dot-dashed line) are illustrated to showcase the constraining power of VERITAS and Fermi-LAT upper limits.
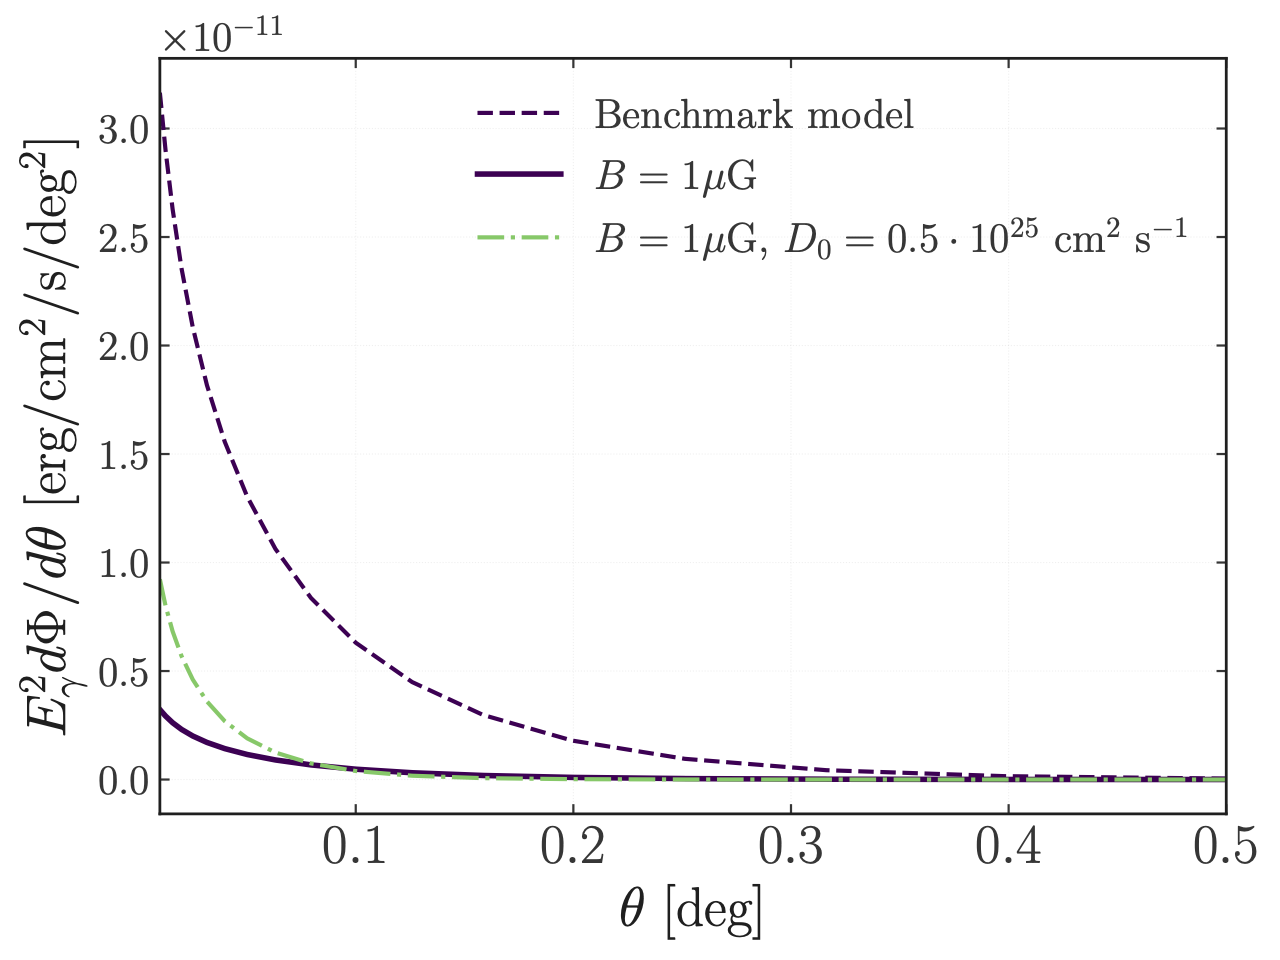
Figure 9: Left: The 1.5o × 1.5o model sky map of the synchrotron emission of LHAASO J0621+3755 in 2–7 keV for the benchmark model. The color map is on a logarithmic scale. The XMM-Newton integration region is overlaid with a white dashed line. Right: Surface brightness profile of the synchrotron halo in 2–7 keV for the benchmark model (B = 3 µG, dashed line), reduced magnetic field (solid line), and reduced diffusion coefficient (dot-dashed line); see the text for the details.
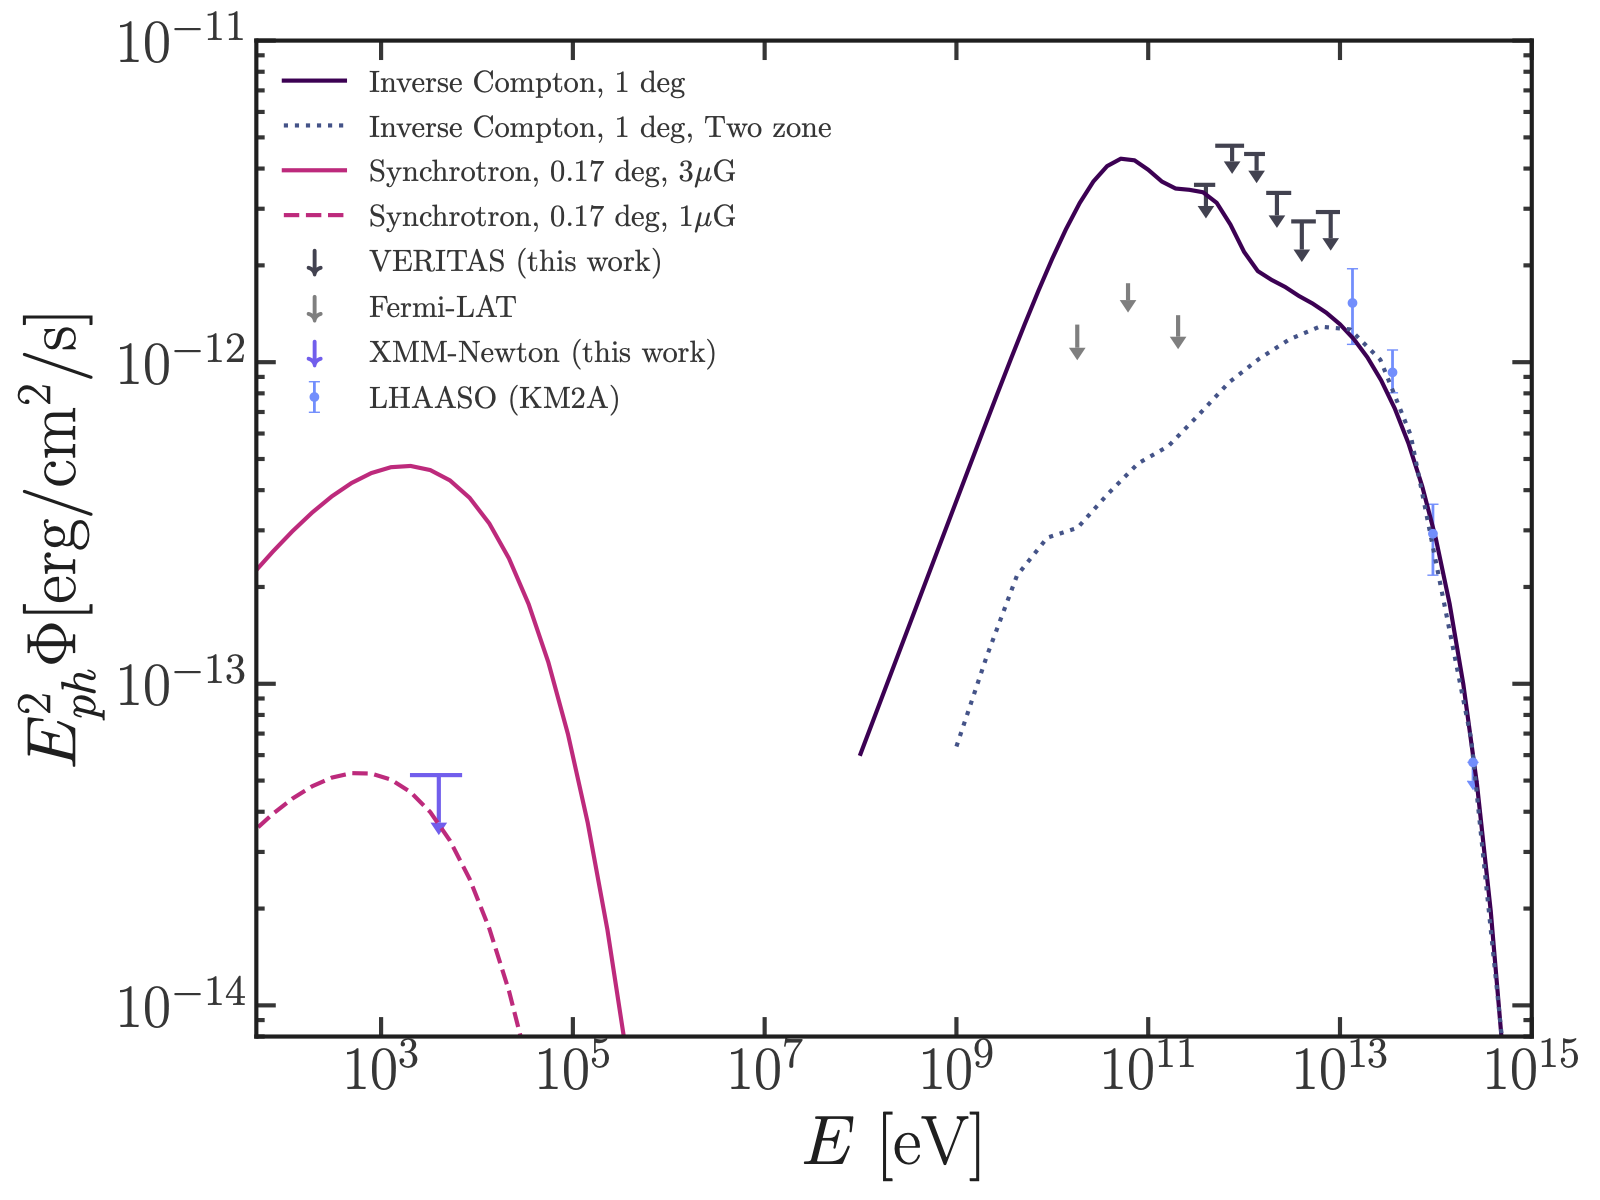
Figure 10: The multiwavelength SED model for LHAASO J0621+3755 as a pulsar halo. The gamma-ray data from LHAASO-KM2A and Fermi-LAT (blue and gray points, Aharonian et al. (2021)) and VERITAS (black, this work) and the X-ray data from XMM-Newton (magenta, this work) are overlaid. The pulsar halo model is tuned to be compatible with the IC emission in the TeV range (solid line, obtained by integrating the model within 1 degree from the pulsar). The synchrotron spectrum is integrated over a 10′ region around PSR J0622+3749 and reported for two values of the magnetic field, 3 µG and 1 µG (magenta dashed and dotted lines, respectively).
