In this joint study with the IceCube Collaboration, the VERITAS Collaboration reports a follow-up of the blazar B3 2247+381, which was associated with the IceCube multiplet neutrino alert and observed across multiple wavebands, from optical to very high-energy gamma rays. Each band offers valuable insight into the processes responsible for neutrino and gamma ray production. They also provide potential constraints on the activity occurring within the jets. Combined, these observations allow us to explore potential connections between the jets and neutrinos.
We observed the source in a low photon-flux state at the time of neutrino detection. This suggests that the detected neutrinos may result from background fluctuations rather than originating from this source. Alternatively, it could indicate a lack of correlation between neutrino and photon emission in this source—similar to our Sun, where neutrinos emerge from the core while photons originate from the photosphere.
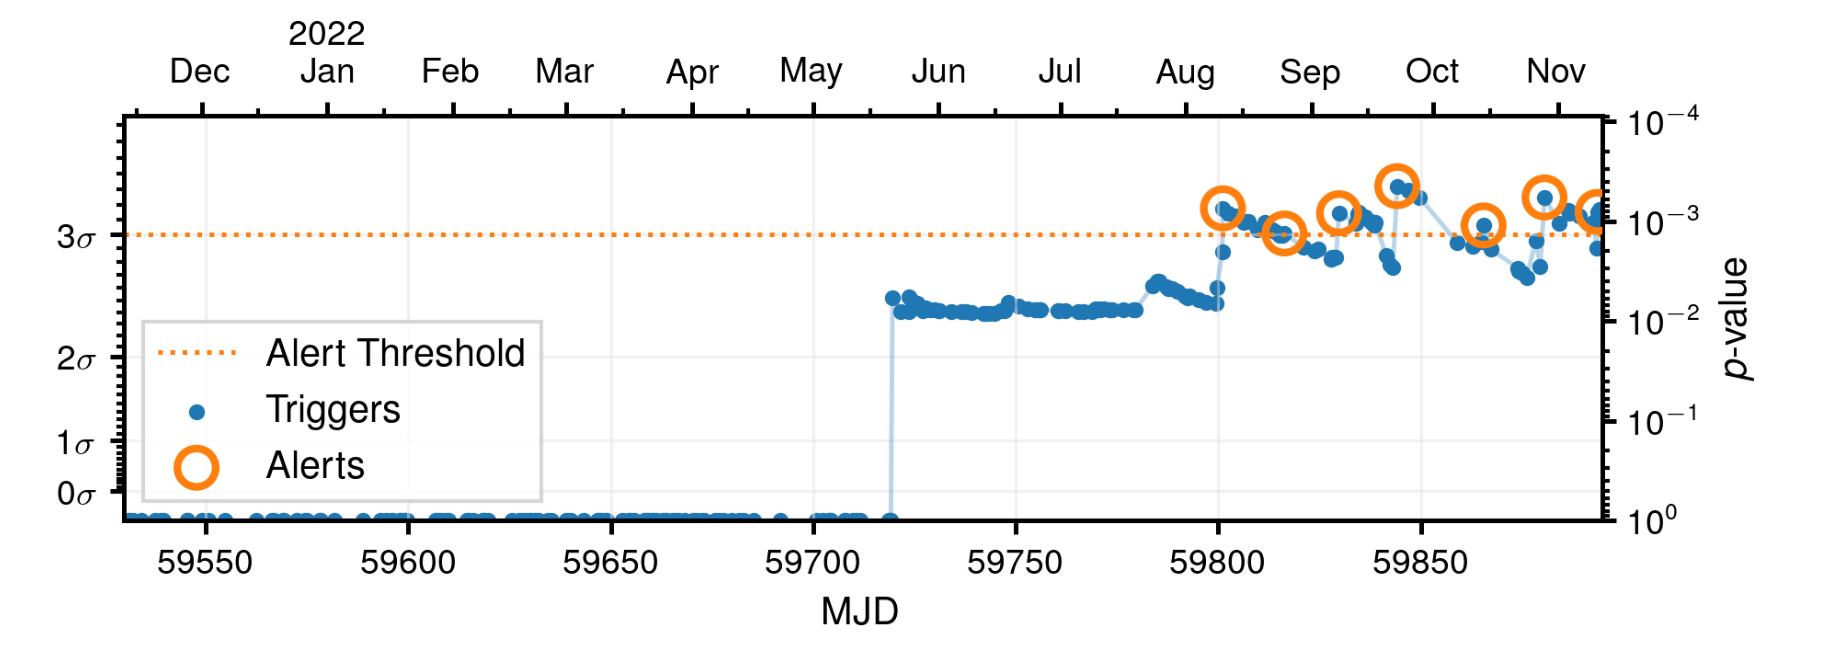
Figure 1: The evolution of alert significance at the location of B3 2247+381. In total, 7 alerts were received over a duration of 174 days between May 20, 2022 and November 10, 2022 and the significance of these alerts, taking into account their directions, angular uncertainties and energies, as well as the duration of the time window, was found to be 3.2σ. It should be noted, this significance value is not fully corrected for trials as the GFU search includes trials corrections for the multiple time windows searched per source but not for the number of catalog entries searched.
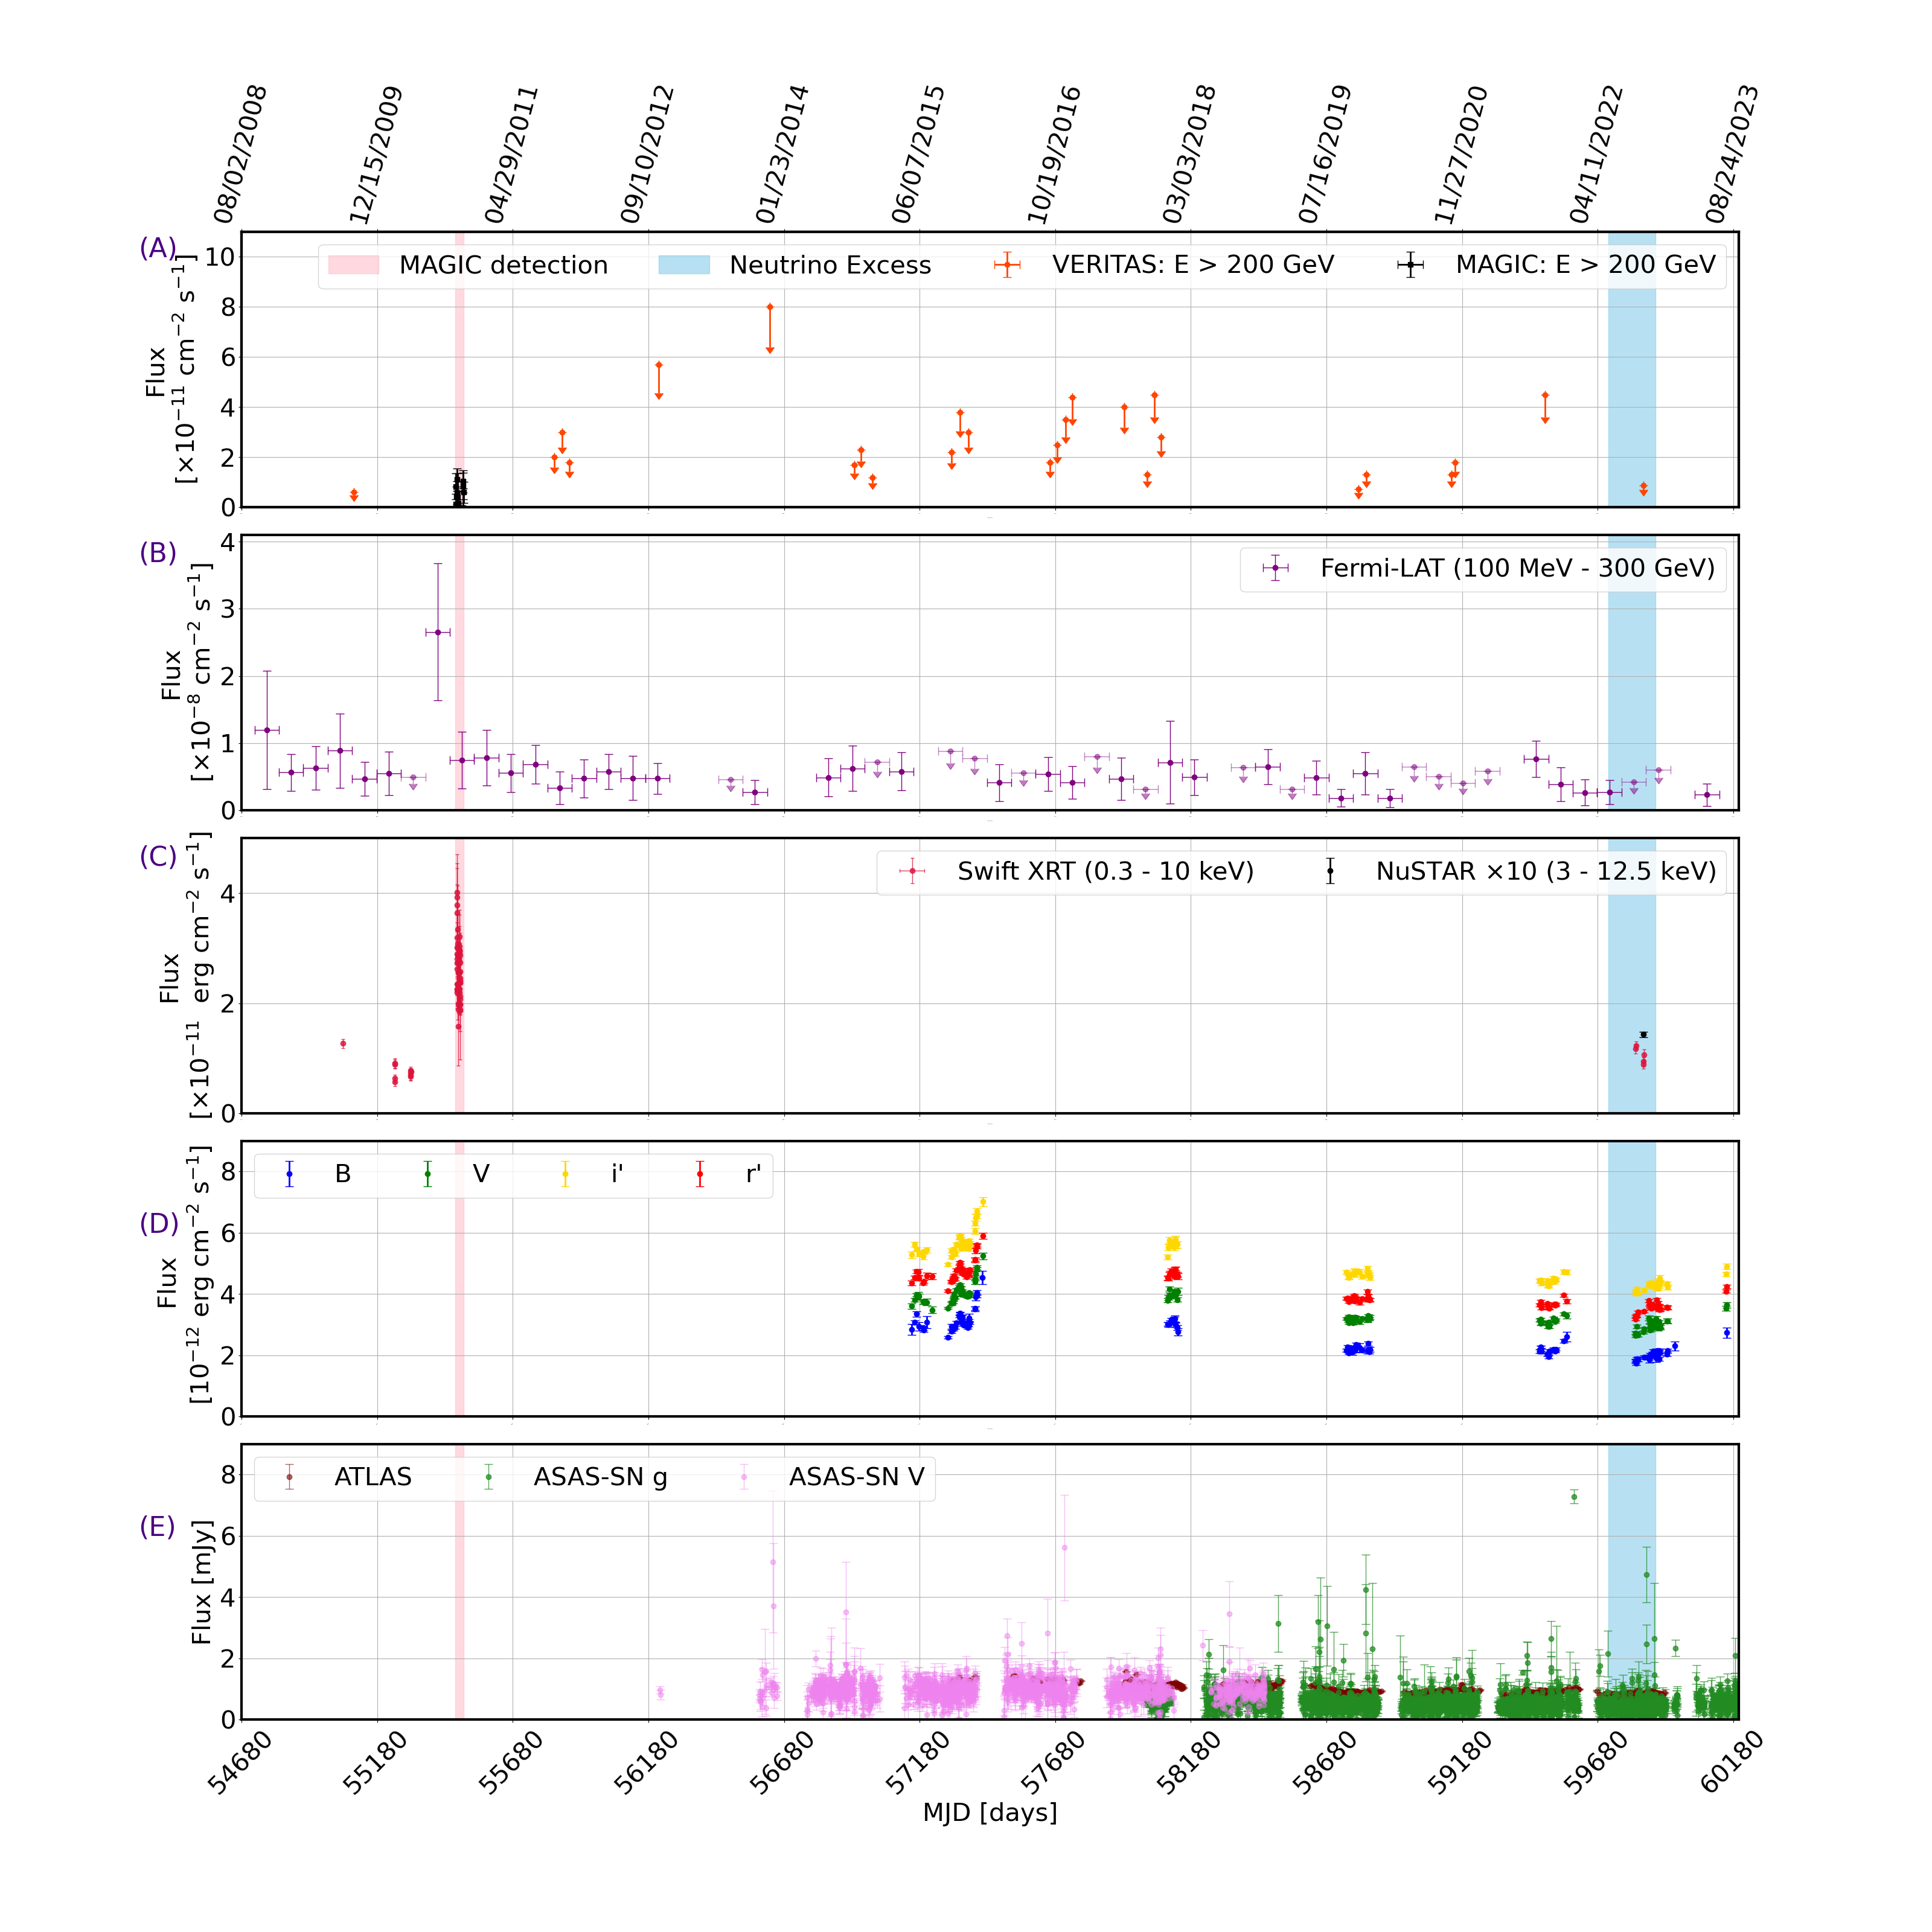
Figure 2: Multiwavelength lightcurves of B3 2247+381 between August 4, 2008 until midnight on June 1, 2023 (MJD 54683 - MJD 60096). The blue narrow band corresponds to the IceCube neutrino excess period and the red narrow band corresponds to the time interval of the MAGIC detection (Aleksic et al. 2012). (A) Monthly-binned VHE lightcurve for VERITAS observations above an energy threshold of 200 GeV. Also shown for comparison are MAGIC data from the 2010 detection (Aleksic et al. 2012). (B) 90-day-binned Fermi-LAT lightcurve in the 0.1–300 GeV band. Upper limits are shown for individual bins having a significance of lower than 2σ. (C) Swift-XRT and NuSTAR fluxes in the 0.3–10 keV band and 3–12.5 keV band, respectively. To aid visual comparison, the NuSTAR data have been scaled up by a factor of 10. (D) Optical lightcurve in all filters using data from the 48” optical telescope at the FLWO. Errors plotted are statistical uncertainties only. (E) Optical flux observations: Optical data from the ASAS-SN Sky Patrol in the g and V band (green and magenta, respectively) and ATLAS R band data (in red).
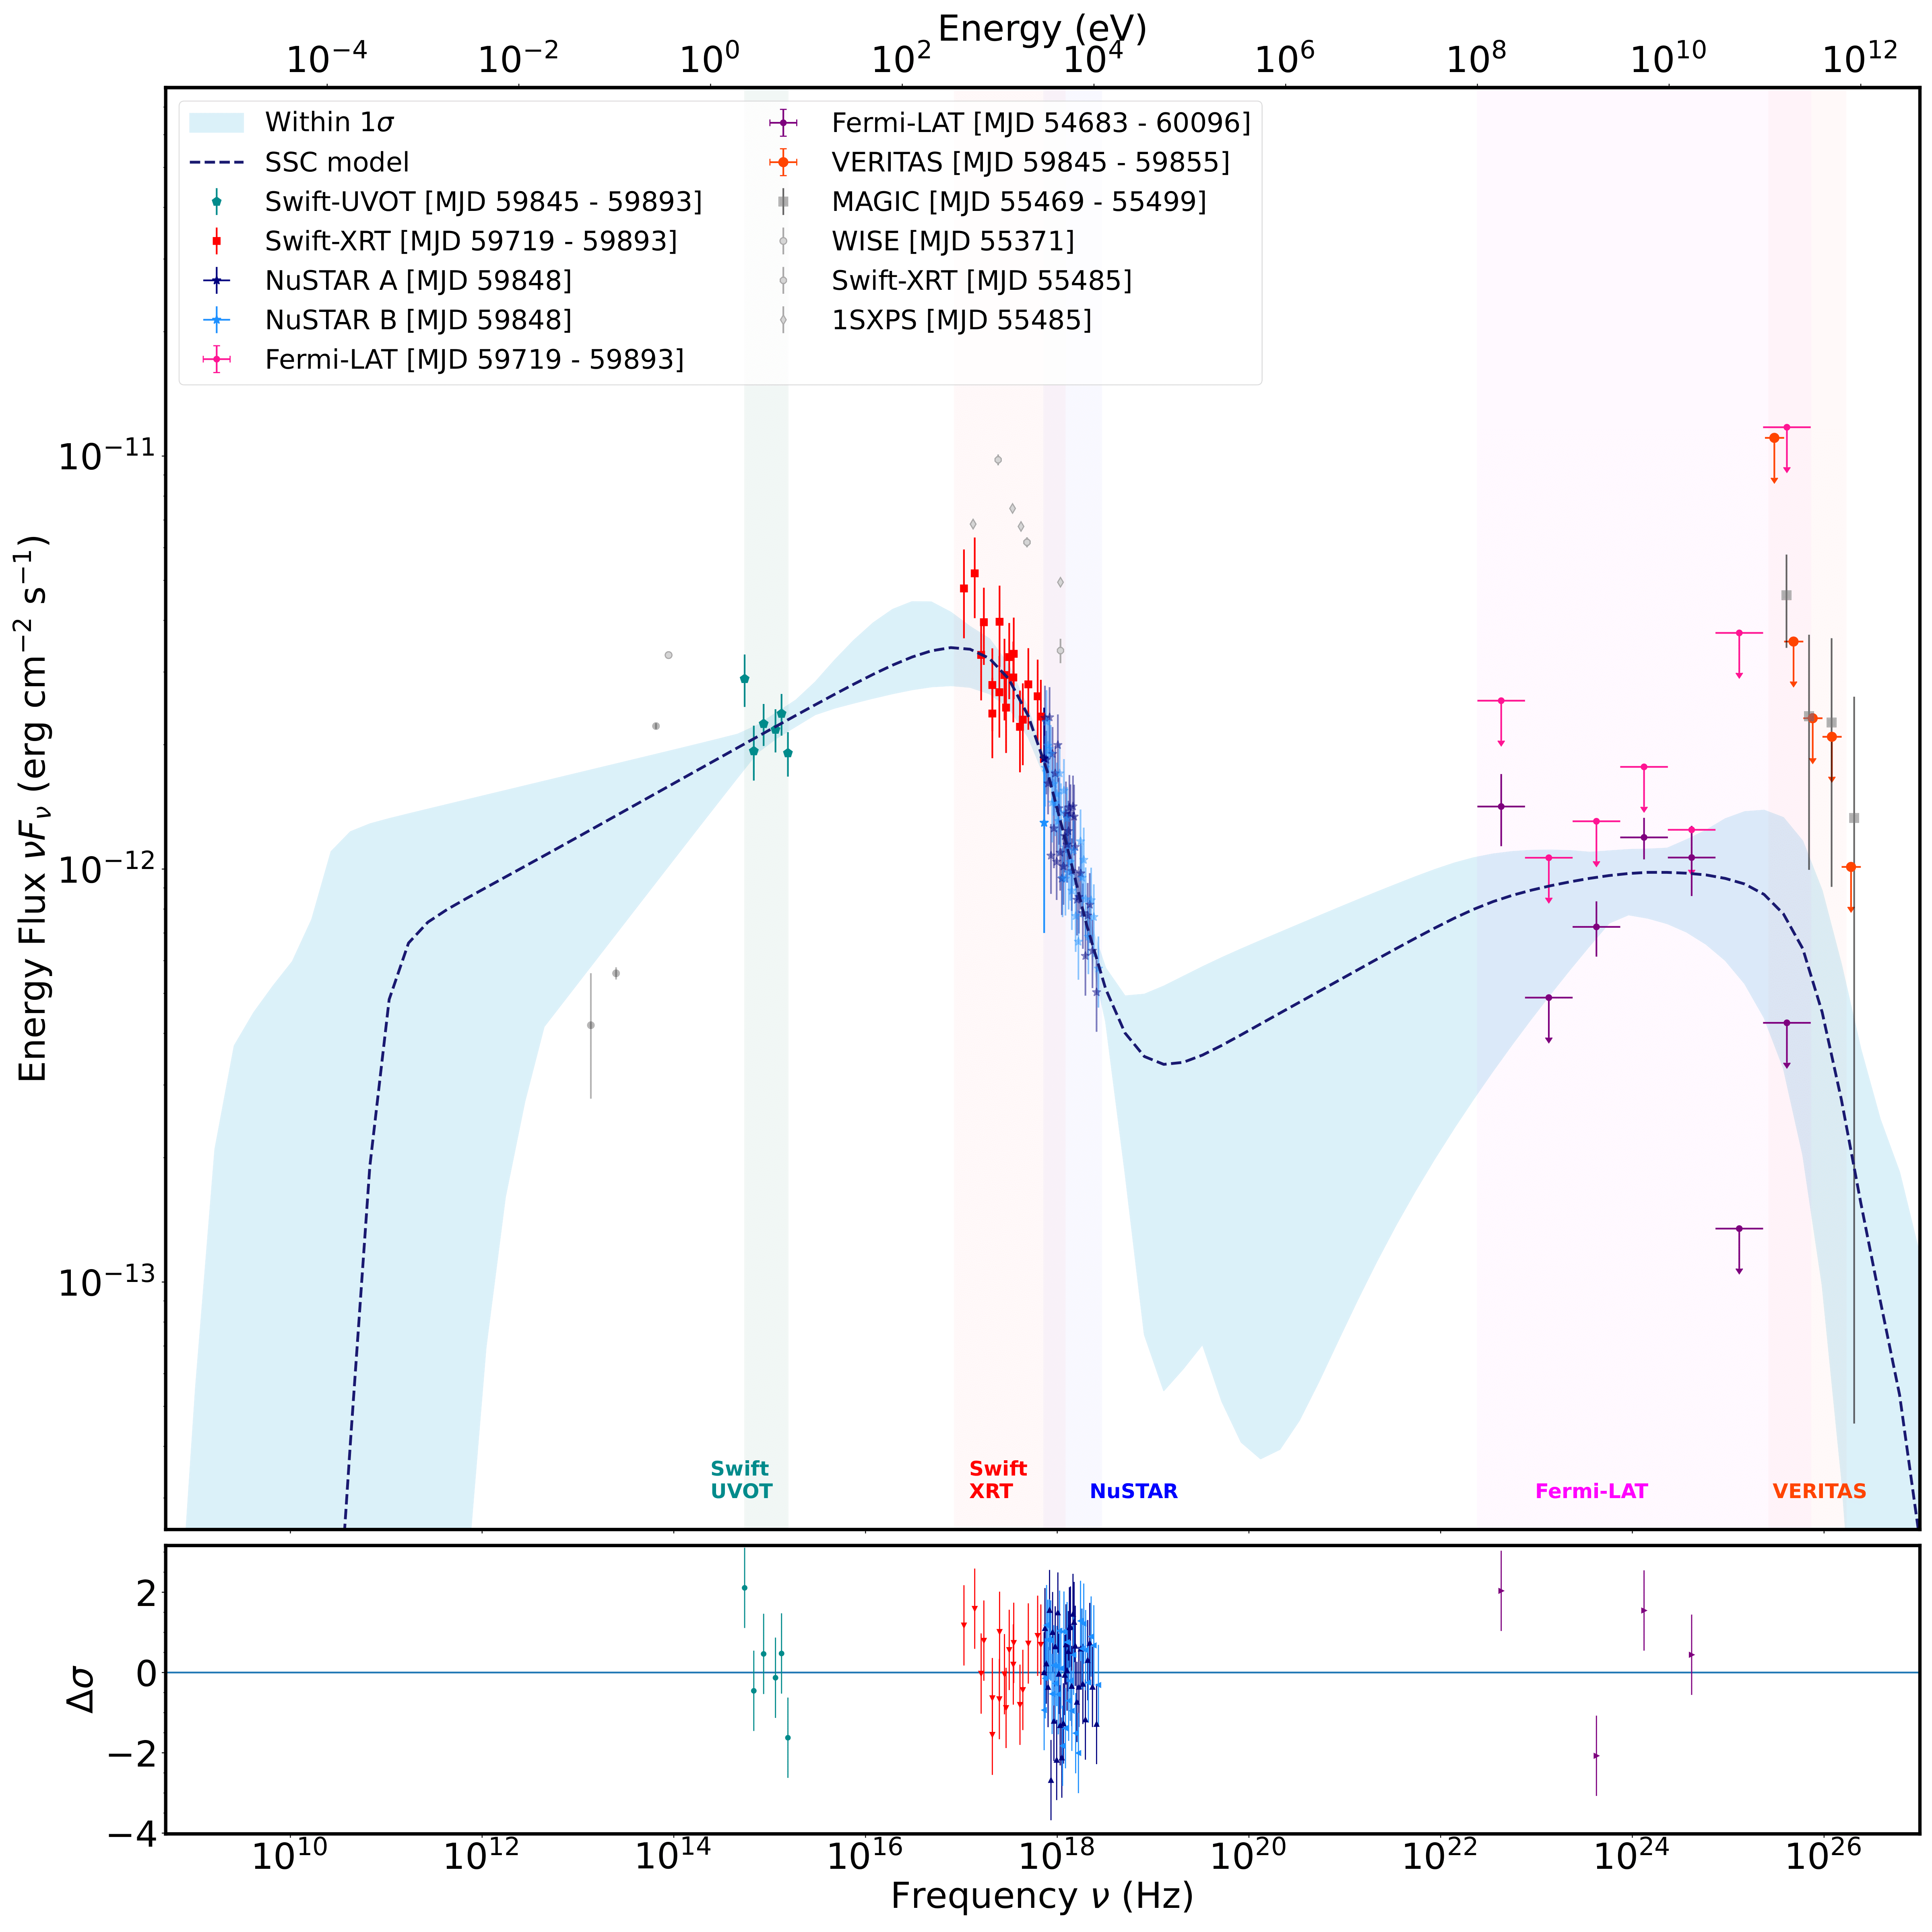
Figure 3: The broadband SED of B3 2247+381. The VERITAS spectral limits are time-averaged over the time interval of the ToO observations between September 23, 2022 and October 3, 2022 (MJD 59845 – 59855). The Fermi-LAT spectrum, time averaged over a wider time interval between August 4, 2008 and June 1, 2023 (MJD 54683 – 60096), is shown using purple points while those corresponding to the IceCube neutrino alert window between May 20, 2022 and November 10, 2022 (MJD 59719 - 59893) is shown using pink points. The NuSTAR spectra were obtained on September 26, 2022 (MJD 59848). The Swift-UVOT and Swift-XRT observations correspond to the time interval between September 23, 2022 and November 10, 2022 (MJD 59845 - 59893). The grey points represent archival data, provided by the Space Science Data Center-ASI, taken with Wide-field Infrared Survey Explorer (WISE) and the Swift-XRT. It should be noted that none of these archival data are considered in the fitting, as we consider only contemporaneous datasets. The MAGIC data from the 2010 detection (Aleksic et al. 2012) are shown with gray square markers. A minimum significance of two standard deviations is required for each flux point and upper limits at 99% confidence level are quoted otherwise. The blue curve and shaded region represents the one-zone synchrotron and SSC radiation model fit and the corresponding 1σ confidence interval respectively, obtained using Bjet_MCMC, with the residuals for each SED point considered shown in the bottom panel, and the parameters shown in Table 1. The Bjet_MCMC shows the SED including the effect of the extragalactic background light (EBL) using the Franceschini & Rodighiero (2017) model. The VERITAS upper limits have therefore not been corrected for EBL absorption.
