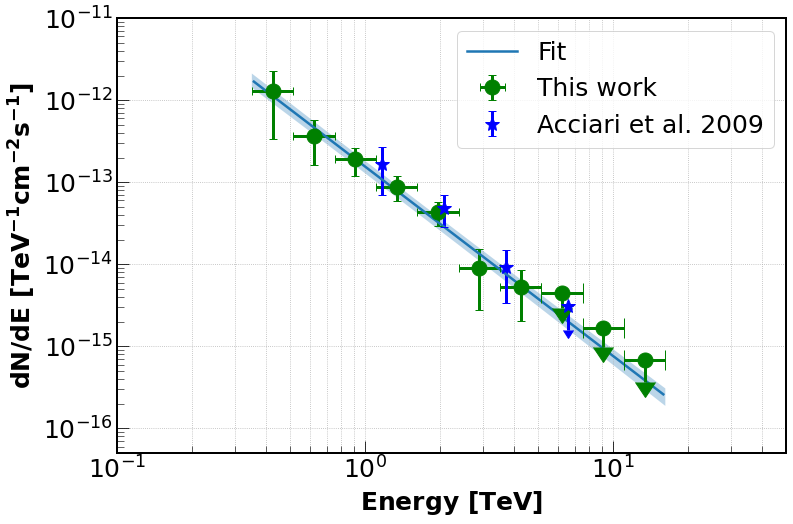
VHE photon spectrum of M 82 from the 2008-22 VERITAS observations. See Figure 1 below for more details.
Reference: A. Acharyya et al. (The VERITAS Collaboration), ApJ 981, 189 (2025)
The identification of the sources contributing to the acceleration of Galactic Cosmic Rays (CRs) is a long-standing puzzle. Assuming that CRs originate in the supernovae and winds of massive stars, starburst galaxies should provide an ideal environment for the production of gamma rays via the interaction of CRs with dense gas. Very-high-energy (VHE; E>100 GeV) gamma-ray emission was discovered from the starburst galaxy M82 using VERITAS in 2008-09. A more extensive campaign from 2008 to 2022, including these initial observations, yields a total of 254 hours of good-quality VERITAS data. Leveraging modern analysis techniques and the larger exposure, these VERITAS data show a more statistically significant VHE signal (~ 6.5σ) from M82.
We have combined the improved VERITAS measurements with data from multiple instruments across the electromagnetic spectrum to understand the underlying emission and transport processes. We found that a purely leptonic scenario is a poor representation of the observed gamma-ray spectral energy distribution (SED). However, a lepto-hadronic scenario with cosmic rays following a power-law spectrum in momentum (index s≃2.25), and with significant bremsstrahlung below 1~GeV, matches the observed SED well. We also found that the synchrotron emission from the secondary electrons indicates that efficient non-radiative losses of cosmic-ray electrons may be at play, for example advective escape from the starburst core.
FITS files: N/A
Figures from paper (click to get full size image):
Figure 1: VHE photon spectrum of M 82 from the 2008-22 VERITAS observations. The 2008-09 result from the previous VERITAS publication (VERITAS Collaboration et al. 2009) is also shown. The 2008-22 data points are best fit by a power-law function (Γ = 2.3). The statistical uncertainty for the fit is also shown.
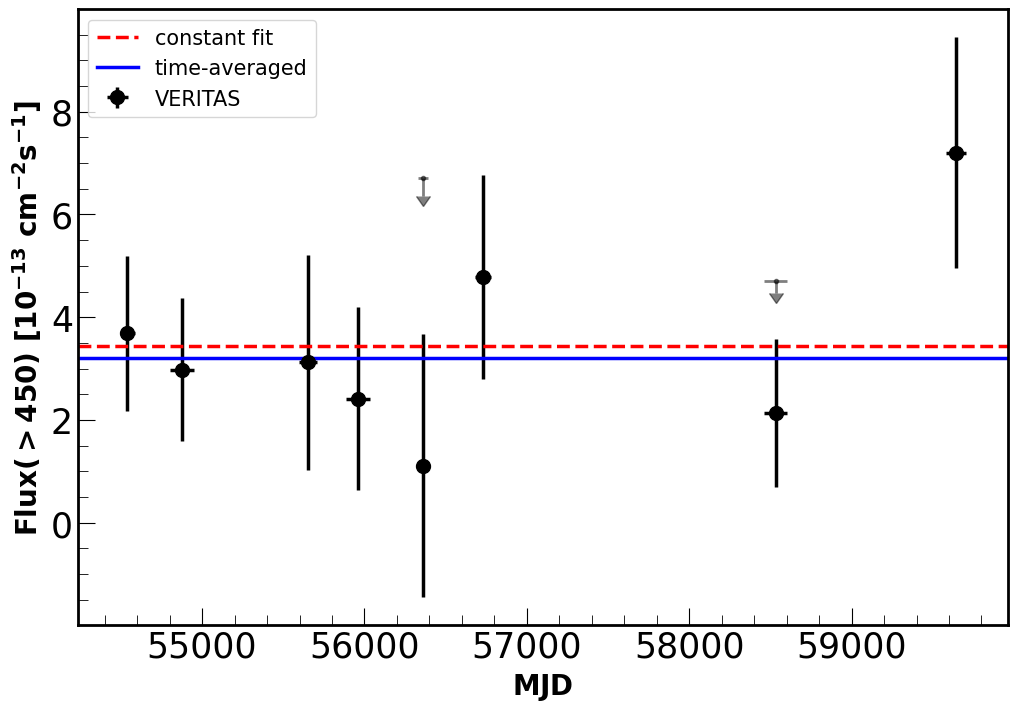
Figure 2: The integral flux above 450 GeV observed by VERITAS during each season. Upper limits (99% confidence level) are also shown for the 2012-13 and 2018-19 seasons due to the low significance observed. The time-averaged flux measured during the entire observation period (2007 to 2022) is indicated by a solid (blue) line. A fit of a constant to the seasonal data is shown by the dashed (red) line.
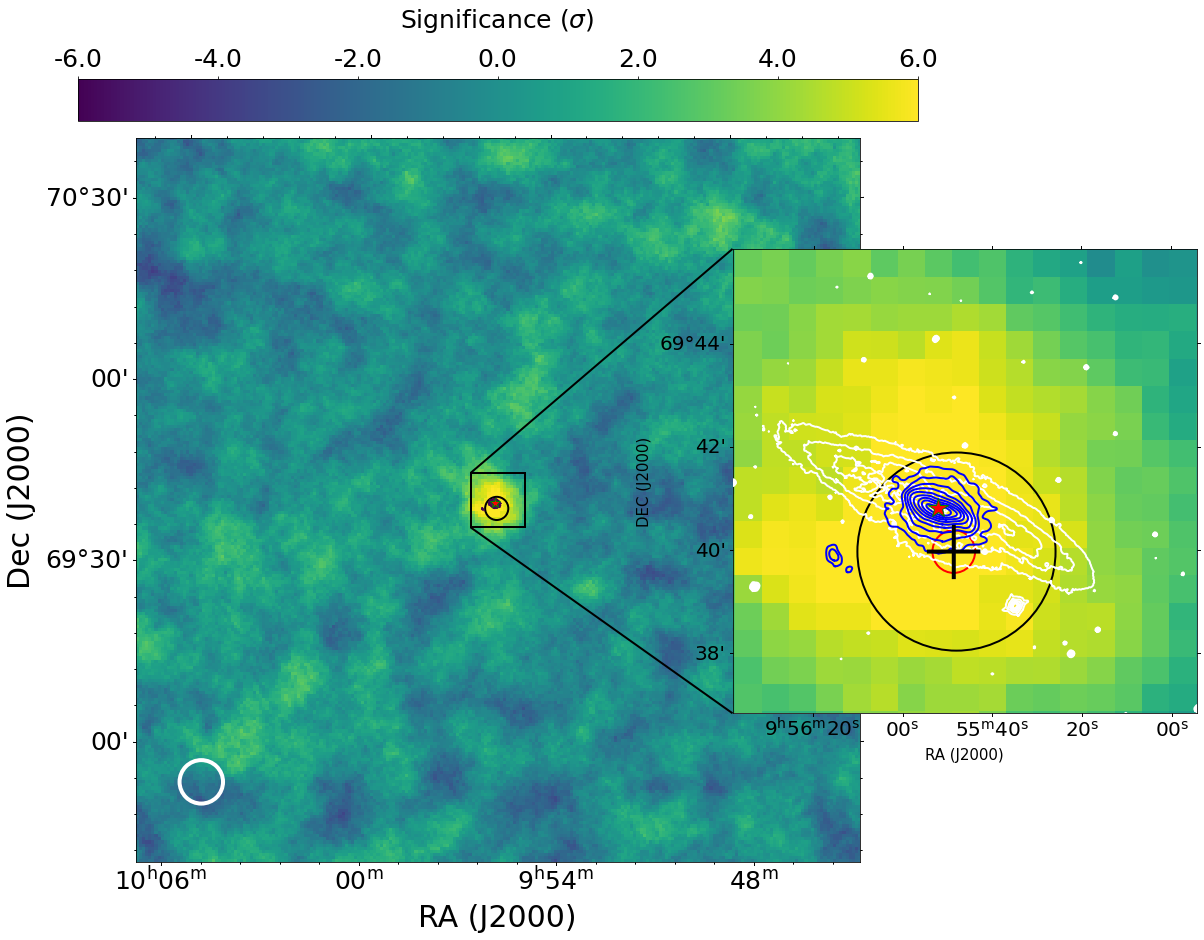
Figure 3: Sky map of significance observed by VERITAS from the region near M 82. The position of M 82 is indicated with a red star (Jackson et al. 2007). The total power radio continuum contours (blue) at about 10 GHz from the WSRT observations are overlaid on the skymap (see Fig. 3 of Adebahr et al. 2013). These radio contours start at the 3σ level of the 50 µJy/beam, with a beam size of 7′′.8 × 7 ′′.3, and increases in powers of 2. The data for optical contours (white) at g-band are taken from the survey data of stellar structure in galaxies by Spitzer (Knapen et al. 2014). The optical contour starts at 16 magnitude and goes to 1 in step 2.143. The black circle indicates the upper limit of the extension (1.9′ ) of M 82 as discussed in section 2. The best-fit location with 1σ statistical errors is shown with a black cross. The 1σ systematic uncertainties are shown around the best-fit centroid position with a red circle. The white circle indicates the VERITAS point spread function (68% containment radius) at the average energy threshold of ∼450 GeV.

Figure 4: The spectral energy distribution (SED) of M 82 from radio to TeV energies. The radio data are compiled from observations discussed in section 3.1 and are shown with a single marker (circle) and color (blue). The X-ray data in the energy range of 1.25 – 6.5 keV are shown in line (purple) and taken from Brightman et al. (2020). The Fermi-LAT data are taken from Ajello et al. (2020). The VERITAS data are the results presented in this paper.
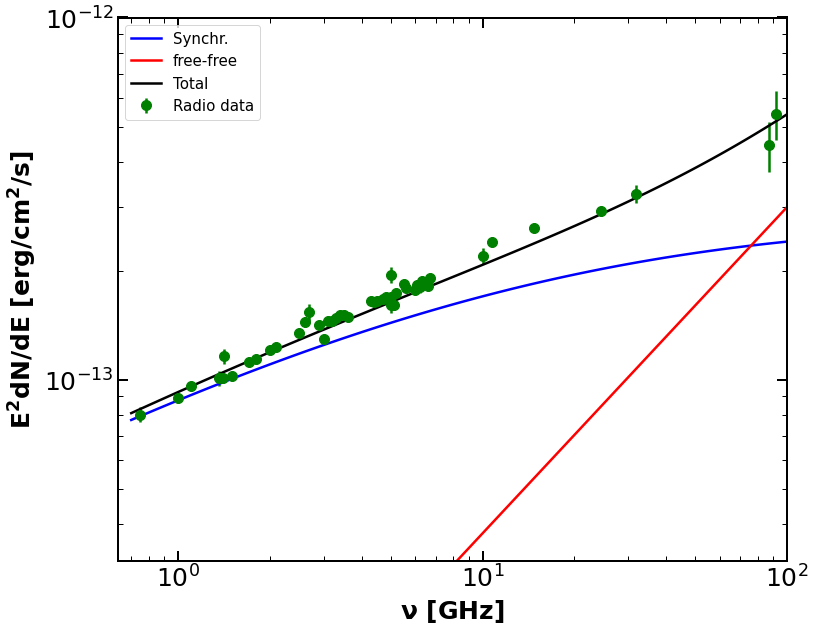
Figure 5: Radio SED of M 82 compared with a model spectrum that is composed of a synchrotron component following equation 3 with Q ∝ E−2.25 and free-free emission with a flux slightly below the estimate in equation 6. The radio data are taken from Klein et al. (1988); Carlstrom & Kronberg (1991); Williams & Bower (2010); Basu et al. (2012); Adebahr et al. (2013).
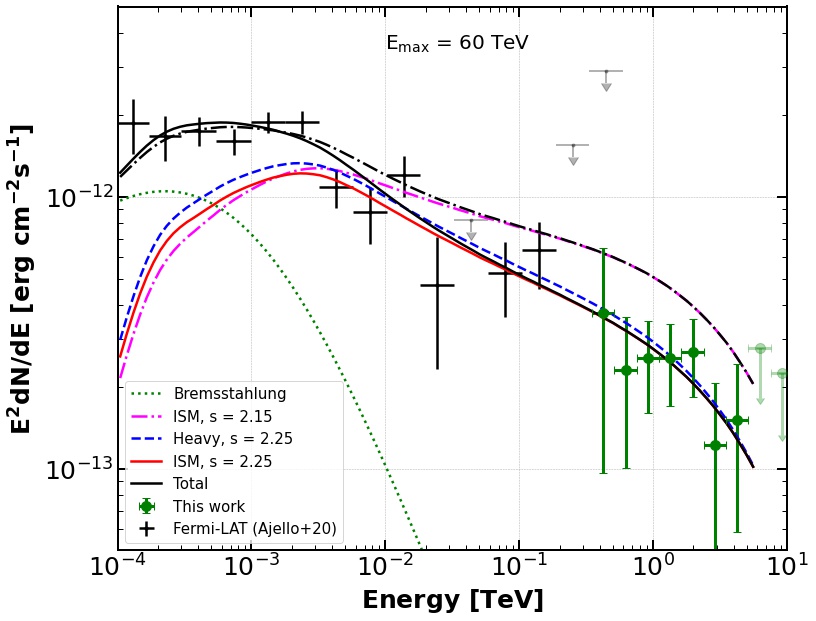
Figure 6: Gamma-ray SED of M 82 compared with hadronic models, varying the spectral index and the elemental composition. The bremsstrahlung contribution is given by the green dotted line. The maximum particle energy, Emax, is set to 60 TeV. The black solid line is the sum of bremsstrahlung and the hadronic component for ISM and s = 2.25, and likewise the black dash-dotted line for s = 2.15.
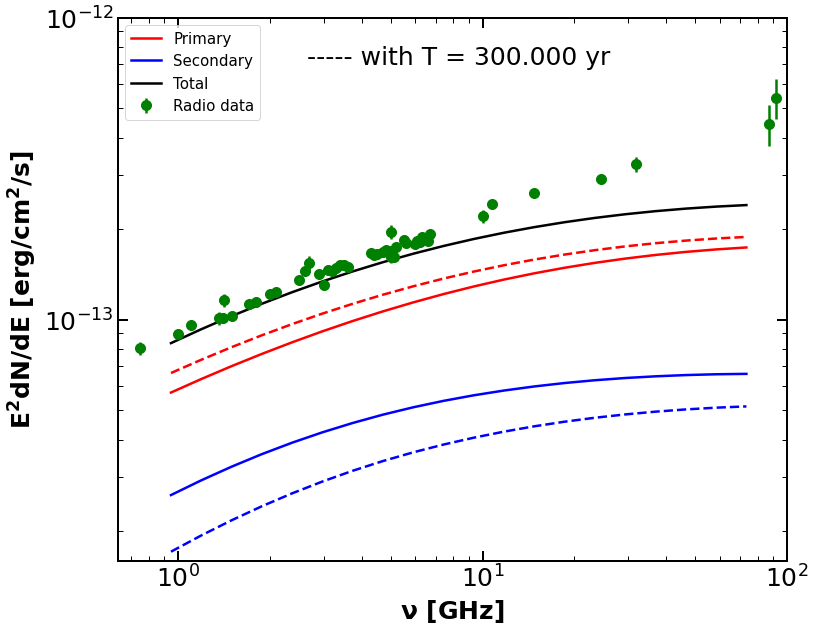
Figure 7: . Radio SED of M 82 compared with synchrotron emission spectra from secondary electrons and positrons for the baseline hadronic models (blue lines) with spectral index s = 2.25 and ISM composition. The solid black line indicates the total synchrotron flux (the same as the blue line in figure 5), and the red lines reflect the contribution of primary electrons. Dashed lines show spectra calculated accounting for catastrophic losses with timescale T = 3·105 yr.
