The recent discovery of electromagnetic signals in coincidence with neutron-star mergers has solidified the importance of multimessenger campaigns in studying the most energetic astrophysical events. Pioneering multimessenger observatories, such as LIGO/Virgo and IceCube, record many candidate signals below the detection significance threshold. These sub-threshold event candidates are promising targets for multimessenger studies, as the information provided by them may, when combined with contemporaneous gamma-ray observations, lead to significant detections. Here we describe a new method that uses such candidates to search for transient events using archival very-high-energy gamma-ray data from imaging atmospheric Cherenkov telescopes (IACTs). We demonstrate the application of this method to sub-threshold binary neutron star (BNS) merger candidates identified in Advanced LIGO’s first observing run. We identify eight hours of archival VERITAS observations coincident with seven BNS merger candidates and search them for TeV emission. No gamma-ray emission is detected; we calculate upper limits on the integral flux and compare them to a short gamma-ray burst model. We anticipate this search method to serve as a starting point for IACT searches with future LIGO/Virgo data releases as well as in other sub-threshold studies for multimessenger transients, such as IceCube neutrinos. Furthermore, it can be deployed immediately with other current-generation IACTs, and has
the potential for real-time use that places minimal burden on experimental operations. Lastly, this method may serve as a pilot for studies with the Cherenkov Telescope Array, which has the potential to observe even larger fields of view in its divergent pointing
mode.
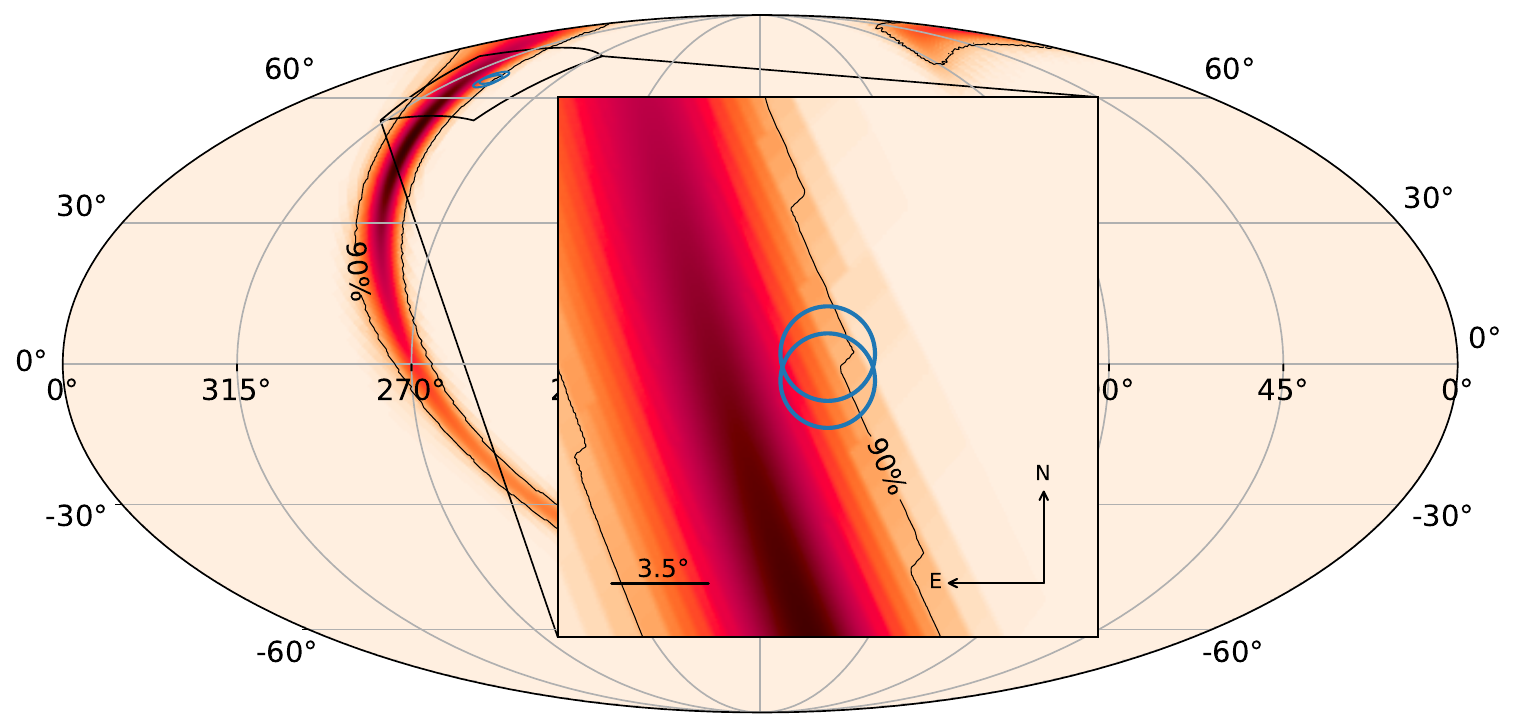
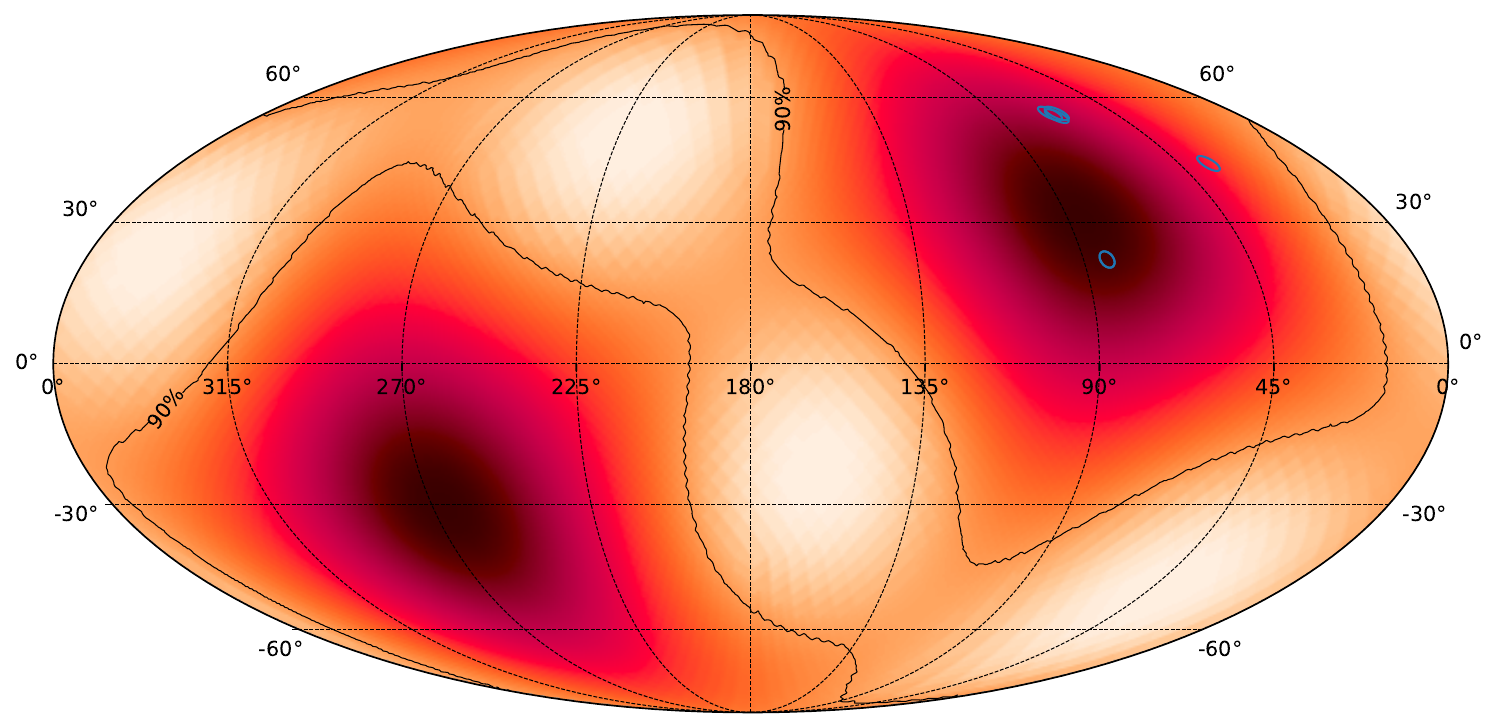
Figure 1: The localization probability map, with 90% localization contours shown in black, for subthreshold LIGO BNS candidate C1 (from Table 1) presented in equatorial coordinates with two VERITAS observations that overlap spatially and temporally
overlaid (blue circles).
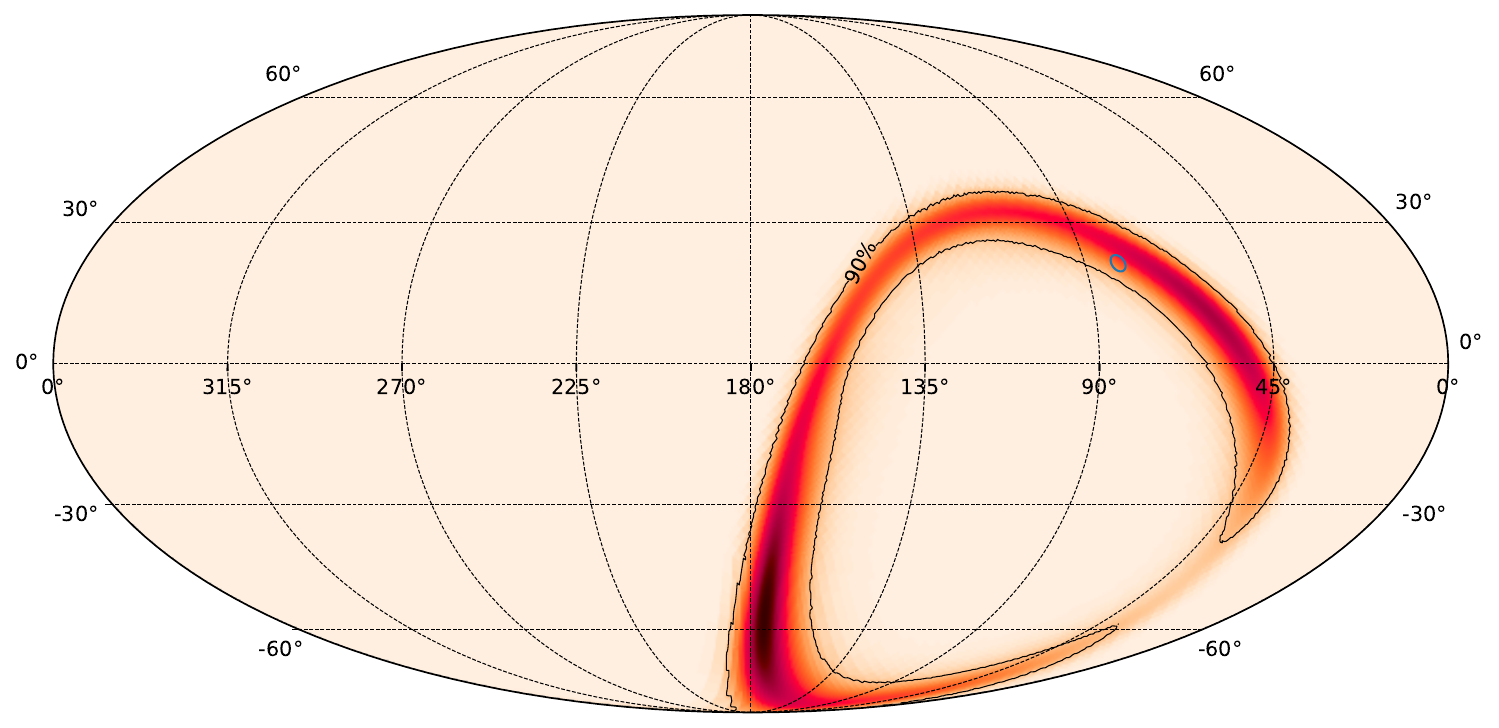
Figure 2: The localization probability map, with 90% localization contours shown in black, for 2019 BNS merger event G330561 presented in equatorial coordinates. Ten VERITAS observations (blue circles) trace the highest localization probability region of the LIGO skymap. Four serendipitous VERITAS observations (black circles) also passed the spatial and temporal cuts of the algorithm and were taken prior to initial VERITAS follow-up.
Figure 3: Results from VERITAS observations of the target SN 2014c (marked with a star), made in coincidence with the LIGO BNS candidate C4. Panel (a) (left) shows a skymap of upper limits on the integral flux over [0.24 TeV, 30 TeV] for the two pointings in the observation, with the 50% and 90% localization contours of the GW candidate overlaid. The distribution of the upper limits from (a) is shown in (b) (right); both use the same colormap to better connect the data visually. The geometric mean of this distribution is indicated by the vertical line.

Figure 4: The curves in this plot depict the estimated fluence evolution of the Bartos et al. (2014, 2019) GRB model placed at 75 Mpc over the [0.24 TeV, 30 TeV] energy band. Each point of the curve is the energy flux integrated from that point in time to n minutes later, where n is determined by the legend. Also shown with dashed lines are fluence estimates from a source 3 orders of magnitude weaker. The geometric means (μgeom) of the VERITAS upper limits on the fluence in each skymap (calculated from the common Emin upper limits on the integral flux shown in Table 2) are plotted at the start time of each VERITAS observation with respect to t0. Each observation is tagged with the label of its corresponding BNS candidate (see Table 1). The colors of the μ�geom points are coded by their observation livetime on the same color scale as the model curve for easy comparison.
The following figures are in the Appendix:
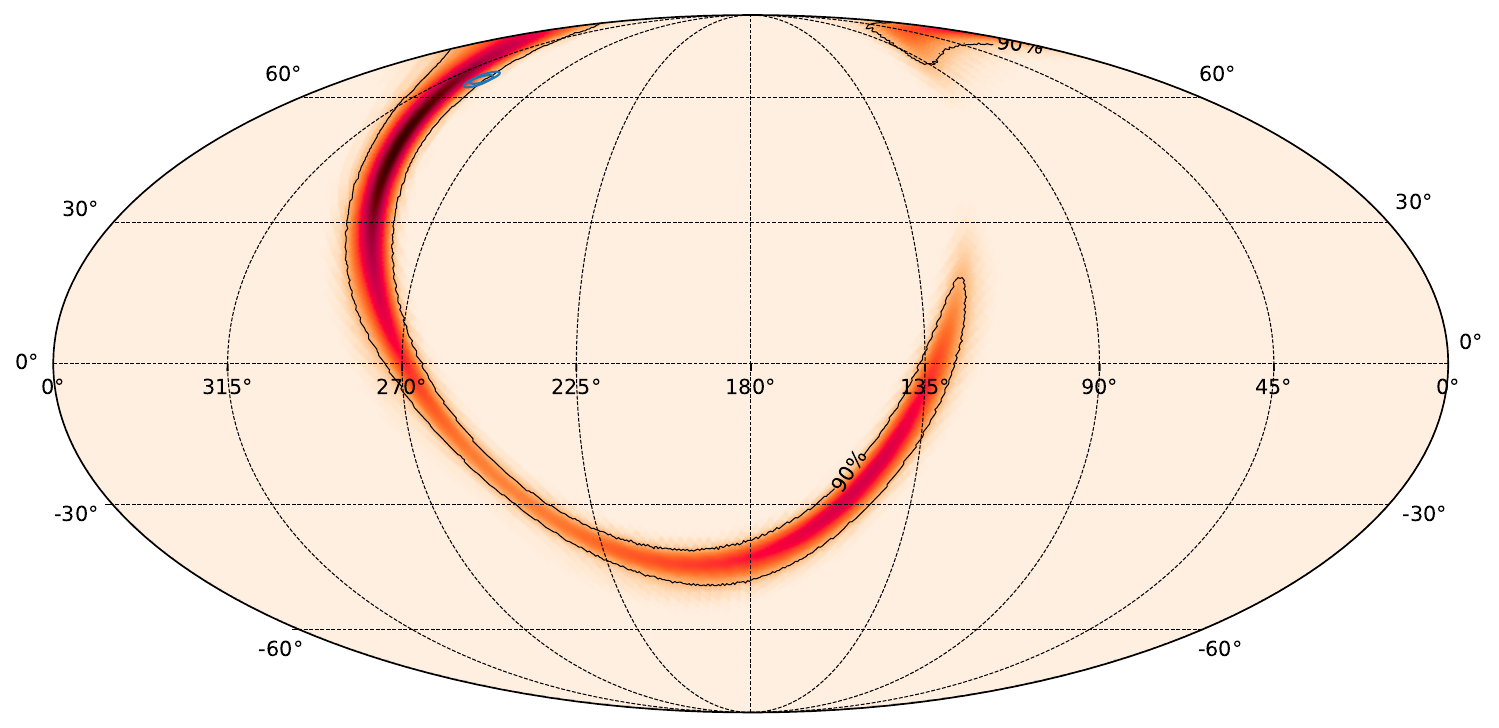
Figure 5: Spatial and temporal coincidence of VERITAS observations (blue circles) with 90% localization (black contours) of LIGO BNS candidate C1 (2015-10-12T02_40_22).
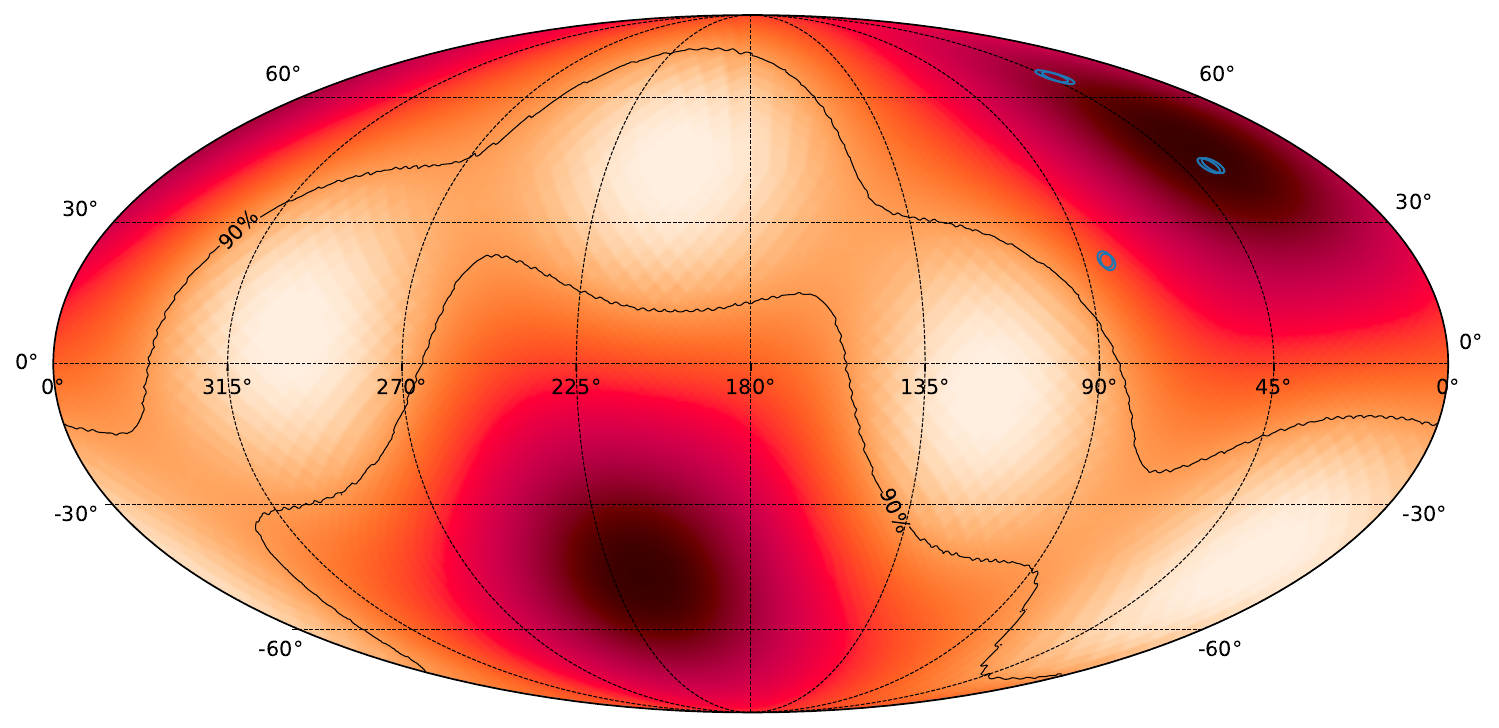
Figure 6: Spatial and temporal coincidence of VERITAS observations (blue circles) with 90% localization (black contours) of LIGO BNS candidate C2 (2015-10-24T09_03_52).
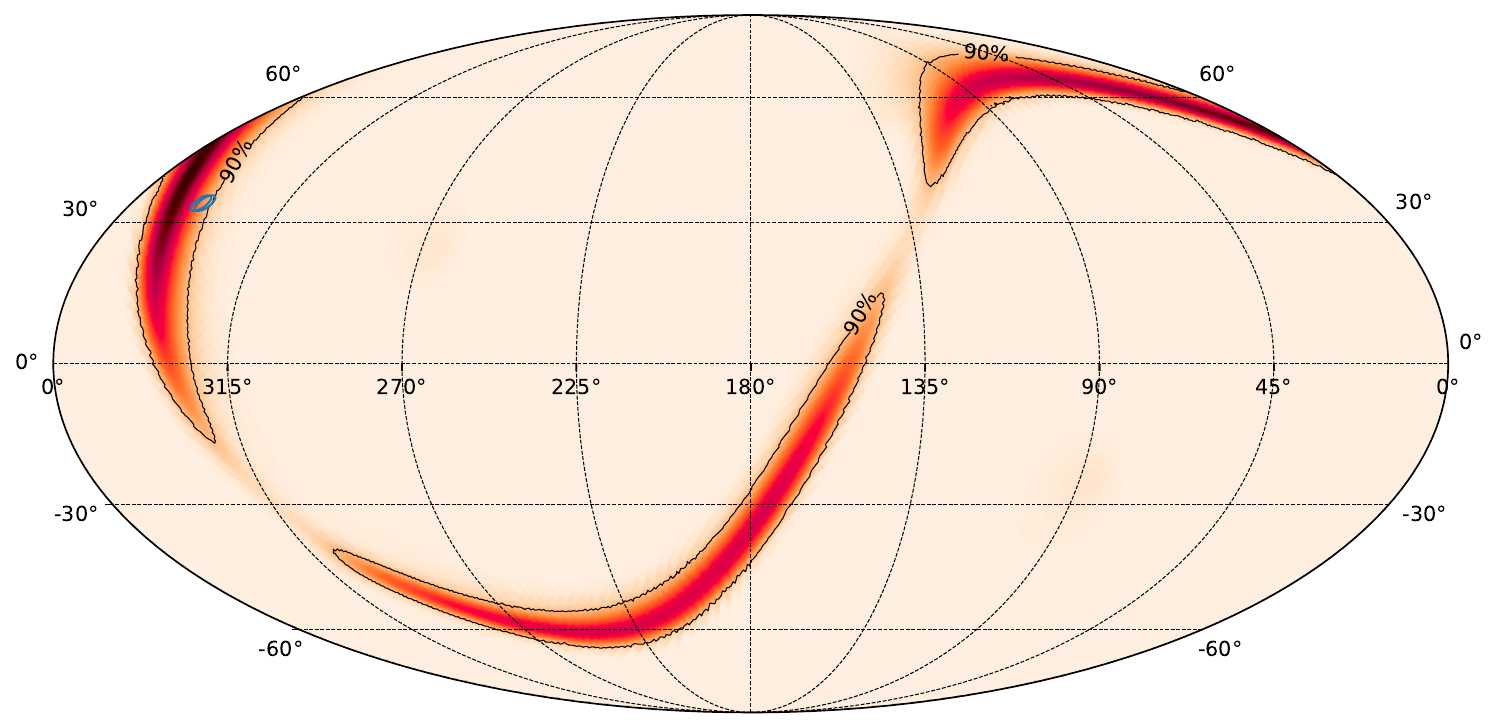
Figure 7: Spatial and temporal coincidence of VERITAS observations (blue circles) with 90% localization (black contours) of LIGO BNS candidate C3 (2015-11-17T06_34_02).
Figure 8: Spatial and temporal coincidence of VERITAS observations (blue circles) with 90% localization (black contours) of LIGO BNS candidate C4 (2015-12-04T01_53_39).
Figure 9: Spatial and temporal coincidence of VERITAS observations (blue circles) with 90% localization (black contours) of LIGO BNS candidate C5 (2015-12-06T06_50_38).
Figure 10: Spatial and temporal coincidence of VERITAS observations (blue circles) with 90% localization (black contours) of LIGO BNS candidate C6 (2015-12-09T07_25_24).
Figure 11: Spatial and temporal coincidence of VERITAS observations (blue circles) with 90% localization (black contours) of LIGO BNS candidate C7 (2016-01-02T02_47_29).