TeV luminosities Lγ as a function of E-dot and pulsar age. See Figure 3 below for details.
Reference: W. Benbow et al. (The VERITAS Collaboration), Astrophysical Journal 916, 117 (2021)
Pulsars are among nature's most powerful particle accelerators, capable of producing particles with energies up to a few PeV. As a neutron star rotates, it imparts some of its immense rotational energy into a magnetized ultra-relativistic particle wind. Since the 'birth kicks' that pulsars receive in their progenitor supernova explosions are typically on the order of a few hundred km/s, pulsars will only remain in their host supernova remnant (SNR) for a few tens of kyr. Once a pulsar leaves its SNR, it traverses an environment with a much lower speed of sound. Consequently, most pulsars outside of their SNRs move supersonically. For supersonic pulsars, the ram pressure exerted upon the shocked pulsar wind (PW) by the oncoming interstellar medium (ISM) confines the shocked PW to the direction
opposite that of the pulsar motion, forming a bow shock pulsar wind nebule (PWN, plural: PWNe) 'head' and an extended pulsar 'tail'
Radio and X-ray observations of pulsar tails have shown that they can extend distances of ~10 pc behind their pulsars. However, puzzlingly, no supersonic PWNe (SPWNe) with long tails seen in radio and X-rays have been detected at TeV energies yet. Detecting TeV emission from tails, whose synchrotron emission has been detected in X-rays, would enable an informative diagnostic of pulsar wind properties, since modeling for these SPWNe is simpler than for PWNe still residing within their host SNRs, where one can expect additional contributions to the TeV emission arising from the interaction between the pulsar wind and reverse shock of the SNR or the pulsar wind and dense material inside the SNR.
Here, we report on the search for very-high-energy gamma-ray emission from the regions around three nearby supersonic pulsars (PSR B0355+54, PSR J0357+3205 and PSR J1740+1000) that exhibit long X-ray tails. We provide upper limits on the TeV flux and luminosity, and also compare these limits with other pulsar wind nebulae detected in X-rays and the tail emission model predictions. We find that at least one of the three tails is likely to be detected in observations that are a factor of 2-3 more sensitive. The analysis presented here also has implications for deriving the properties of pulsar tails, for those pulsars whose tails could be detected in TeV.
FITS files: N/A
Figures from paper (click to get full size image):
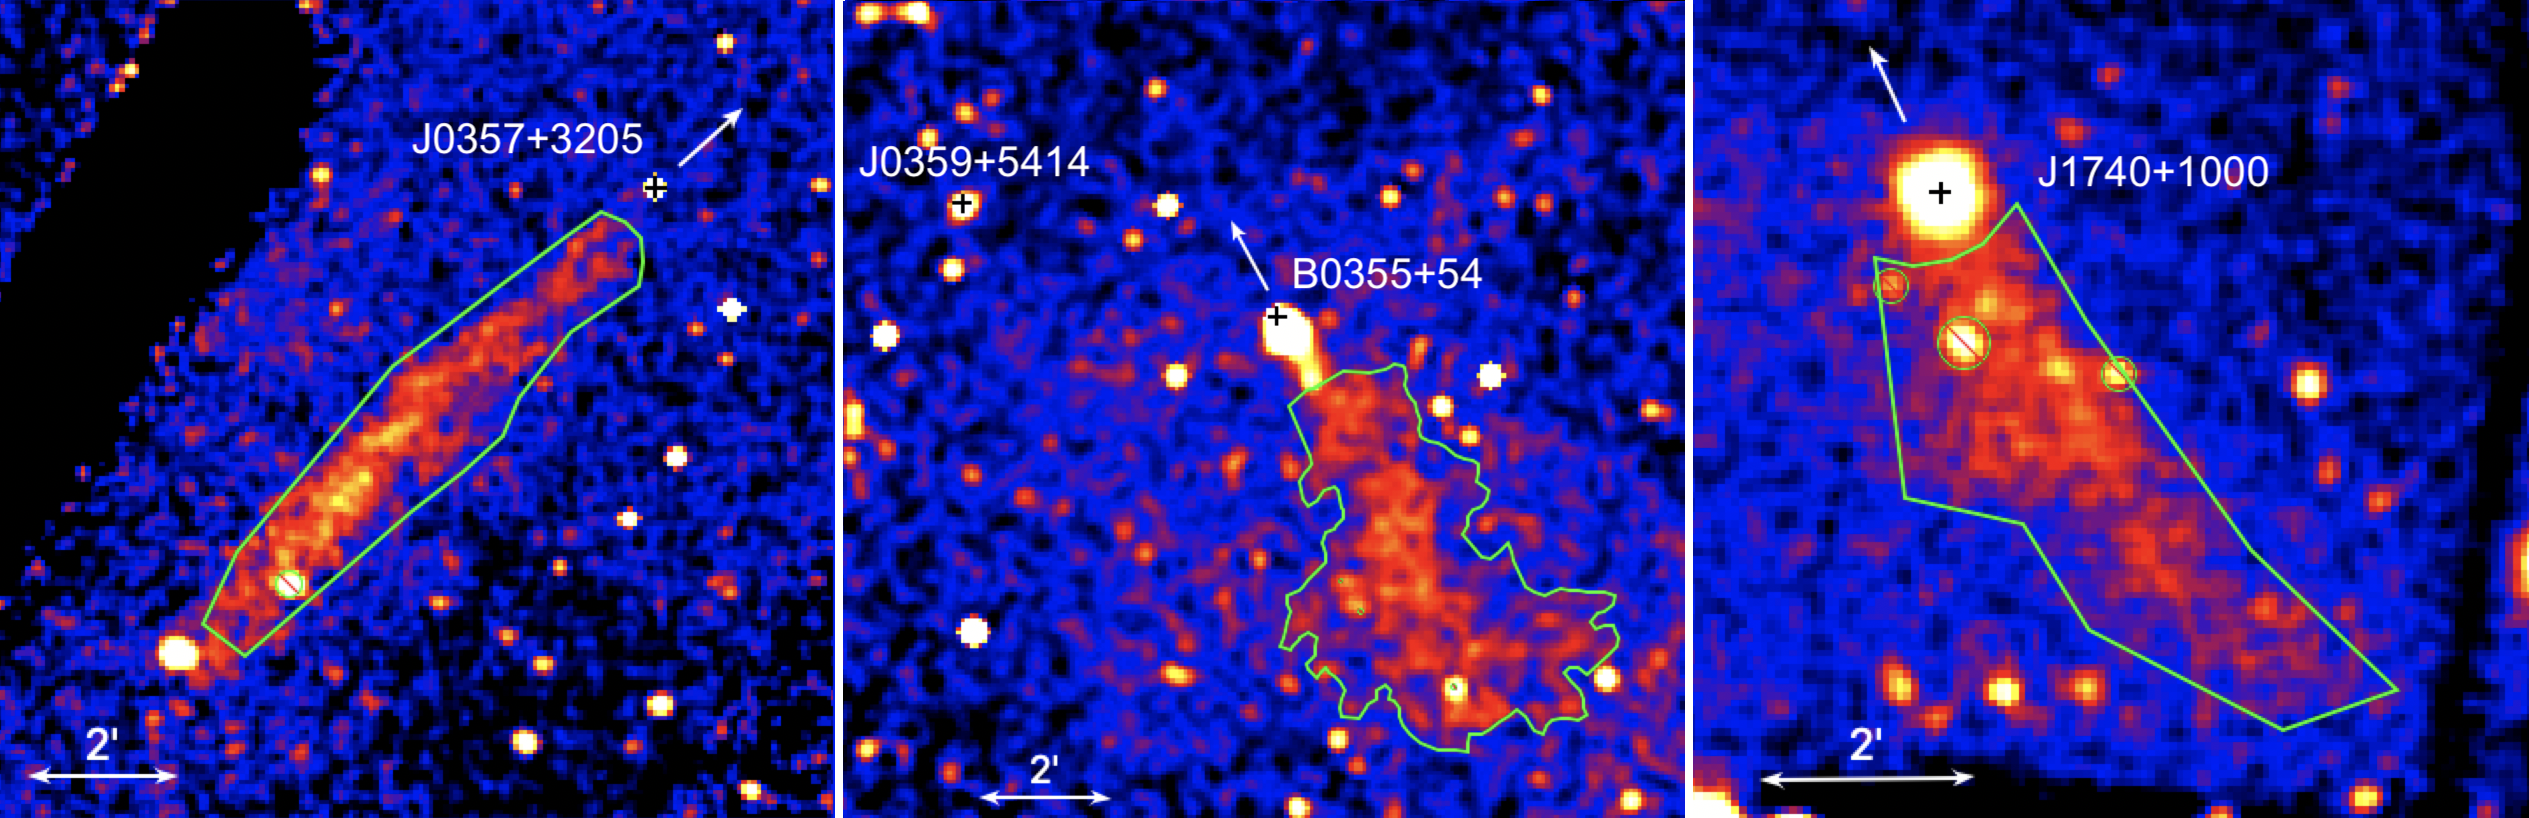
Figure 1: The tails of PSRs J0357+3205 (left, Chandra), B0355+54 and J0359+5414 (center, Chandra), and J1740+1000 (right, XMM-Newton). The X-Ray spectral extraction regions are shown in green, the black crosses mark the pulsar positions, and the white arrows mark their approximate/inferred directions of motion.
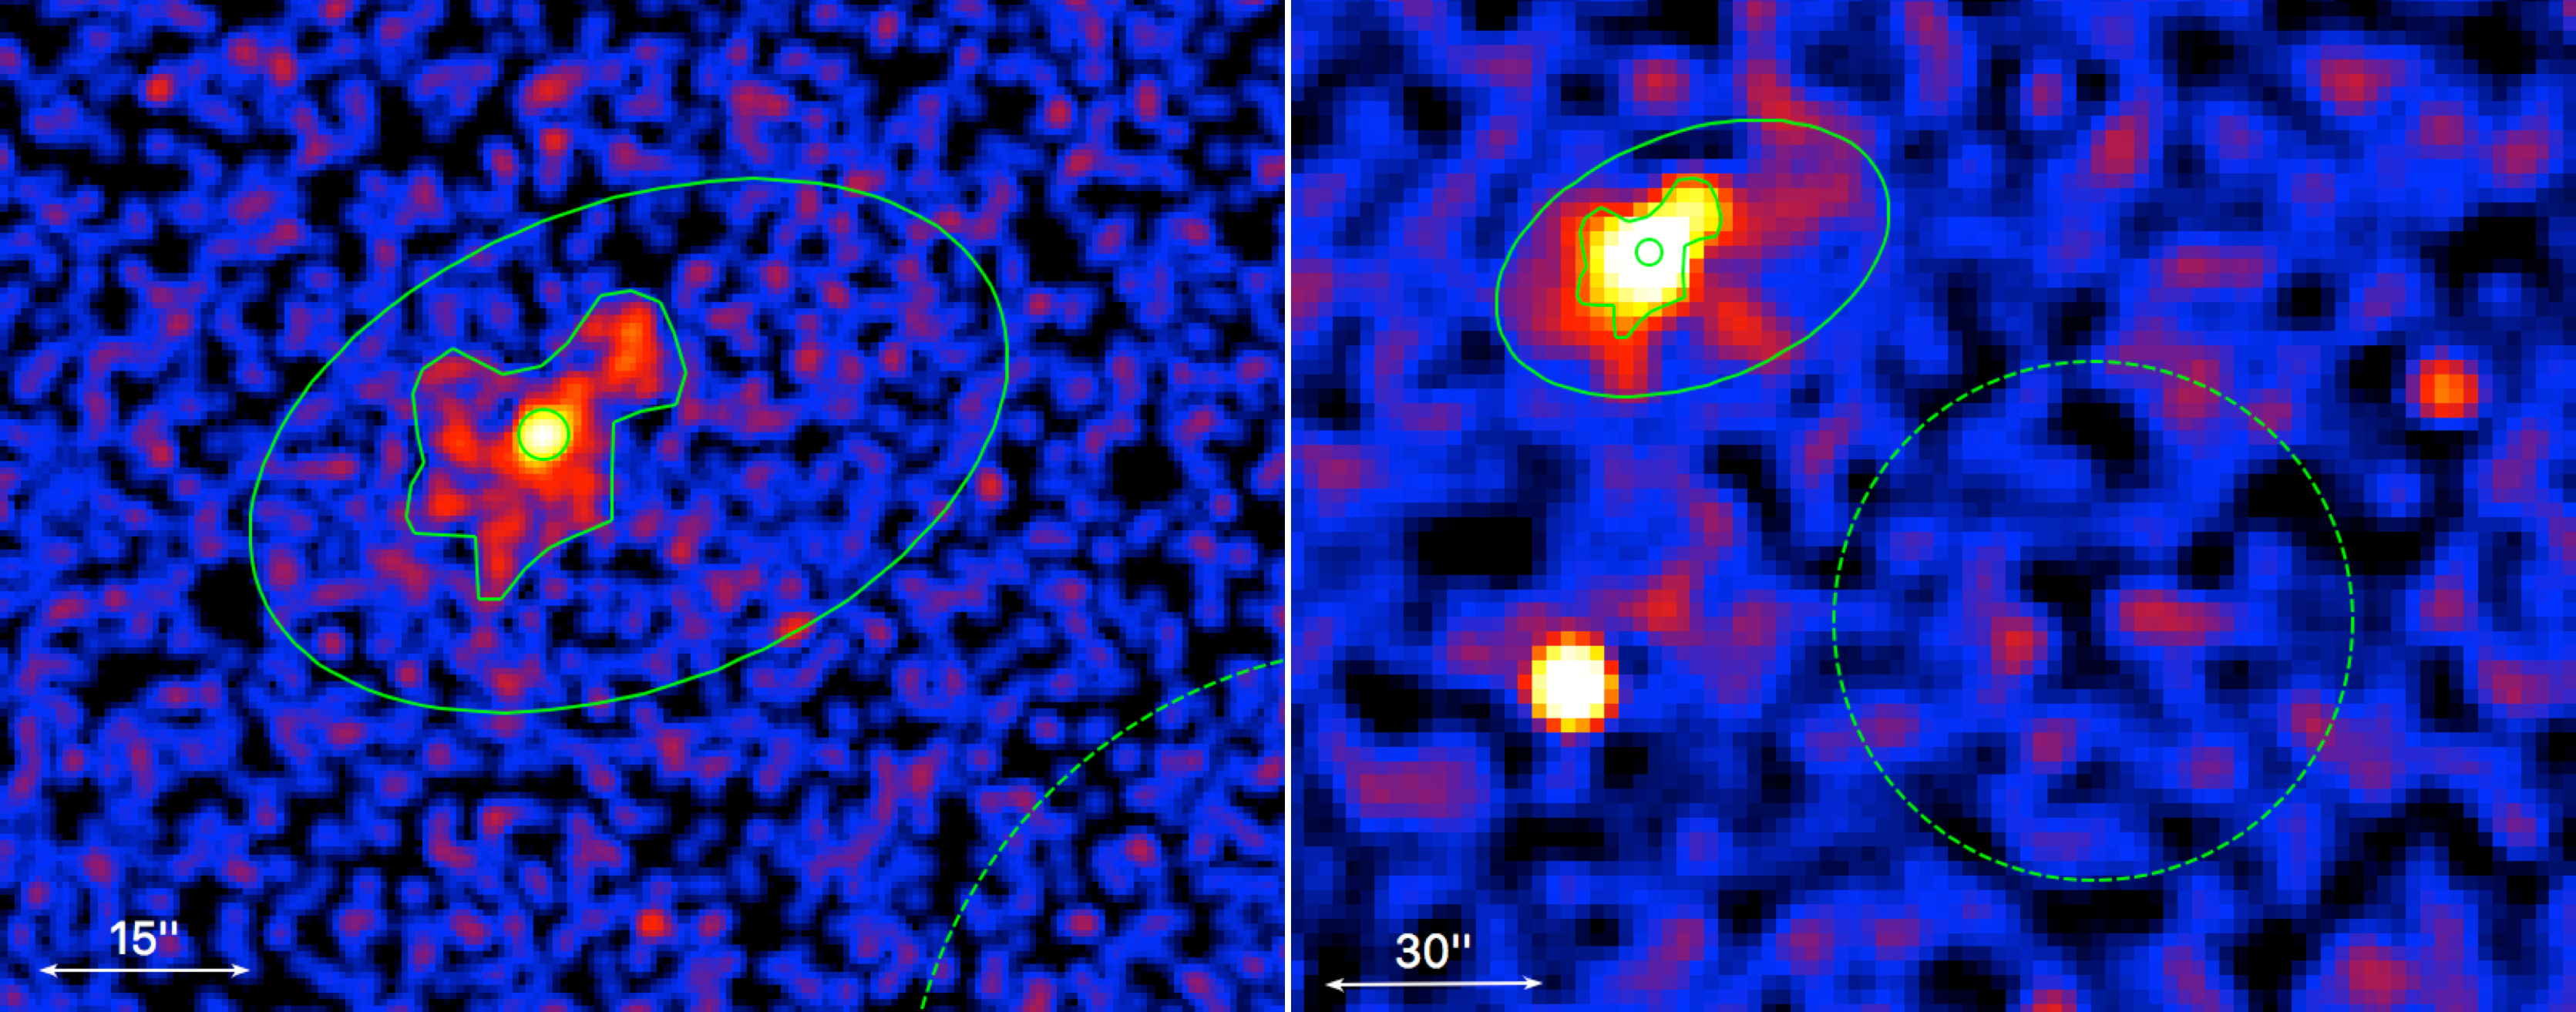
Figure 2: Deep Chandra ACIS-I (0.5-8 keV) images of J0359. Left: Image smoothed with an r = 1."48 Gaussian kernel. Right: image binned by a factor of 4, and smoothed with an r = 5."9 Gaussian kernel to better show the extended emission. The region shown by the r = 1".5 circle is used to exclude the pulsar. The compact nebula (CN) region is shown by the polygon (excluding the pulsar region), and the extended nebula emission region is shown by the ellipse (excluding the CN region). The dashed circle shows the region used for background subtraction.
Figure 3: Plots of 1-10 TeV luminosities Lγ vs E-dot and pulsar age. The green points are confi�rmed TeV PWNe (from Kargaltsev & Pavlov 2010 and the HESS Galactic Plane Survey (HGPS), H. E. S. S. Collaboration et al. 2017, with values from the latter taking precedence for PWNe listed in both papers). The orange points represent candidate PWNe from the HGPS with no incompatible measurements (see HGPS Table 4). The gray arrows are the luminosity upper limits (also calculated at a 95% CL) of pulsars whose PWNe were not detected in the HGPS. The blue points represent the 1-10 TeV luminosities of Geminga and PSR B0656+14 (calculated from HAWC values for the 8-40 TeV range listed in Abeysekara et al. (2017a) by assuming that the measured spectral slope remains the same in the 1-10 TeV range) and the red arrows are the luminosity upper limits of the targets observed in this study (using hard cuts).
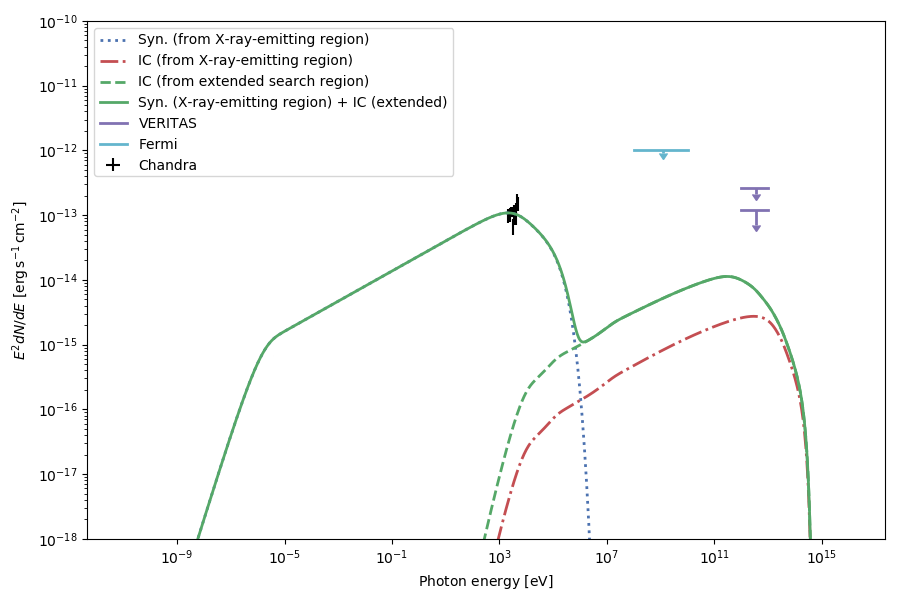
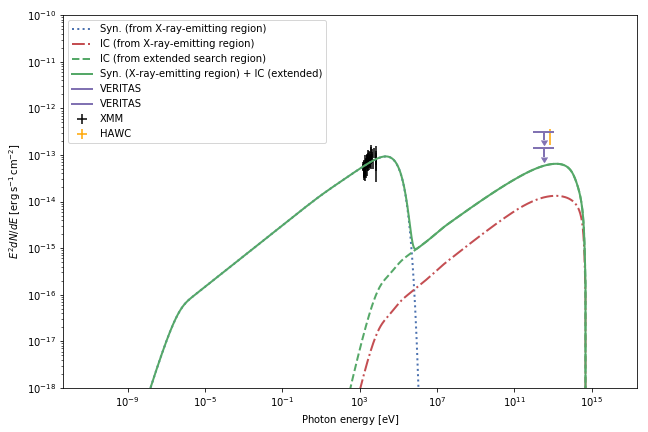
Figure 4: The multiwavelength spectrum of the B0355 tail calculated from the pulsar tail model (see Appendix). The blue (dotted) and red (dotted-dashed) lines represent the synchrotron and IC components (respectively) of the X-ray-emitting region of the tail (i.e., the regions shown in Figure 1). The green (broad dashed) line represents the IC component of the extended tail (see text). Shown in solid green is the sum of the synchrotron component from the X-ray-emitting region of the tail and the IC component of the extended tail (which includes the X-ray-emitting region). Also plotted are the measured Chandra spectrum of the X-ray tail (black data points), the Fermi-LAT upper limit on the B0355 tail (cyan arrow), and the VERITAS upper limits (purple arrows; the `hard cut' limits for the extraction region sizes of r = 0.1o� and r = 0.235o are shown, with the more stringent upper limit corresponding to the smaller region).
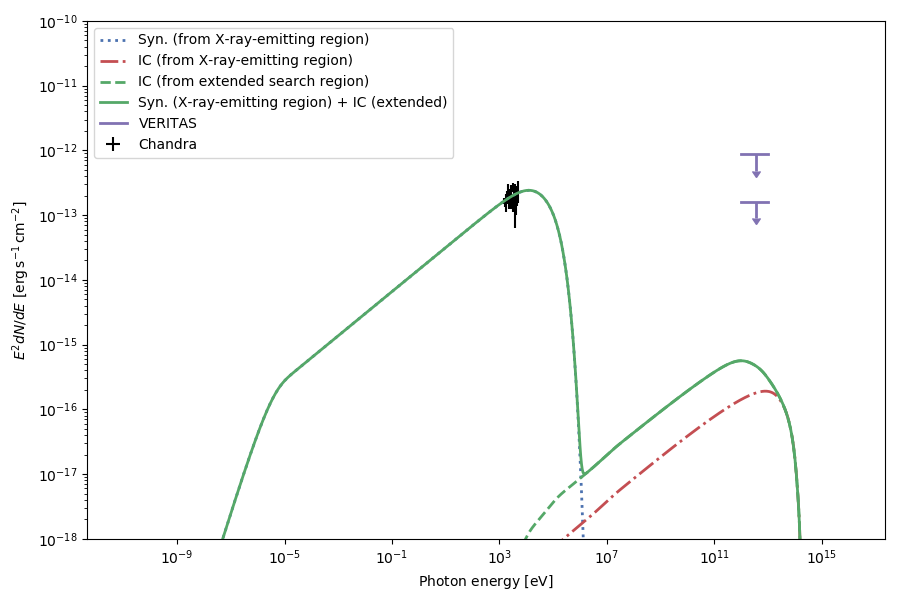
Figure 5: The multiwavelength spectrum of the J0357 tail obtained from our pulsar tail model, with the same labeling scheme as the previous plot. (See text for discussion on the HAWC limit.)
Figure 6: The multiwavelength spectrum of the J1740 tail obtained from our pulsar tail model, with the same labeling scheme as the previous plot.