Since the unexpected detection of the Crab pulsar in very high-energy (VHE) gamma rays by VERITAS and MAGIC (announced in publications in 2011), one important unanswered question in VHE astrophysics has been whether or not the Crab pulsar is the sole VHE gamma-ray-emitting pulsar. Many attempts to model the VHE emission from the Crab have been conducted over the past eight years, though currently no model is capable of explaining all of the features of the observed radiation. From an observational standpoint, detecting more pulsars in the VHE gamma-ray band is therefore motivated by our lack of understanding of the VHE emission from the one confirmed VHE pulsar, and building a population of VHE gamma-ray pulsars remains an important scientific goal.
One way to rank pulsar candidates for VERITAS observations is to scale the total power output of known pulsars by the inverse square of the pulsar's distance from Earth. It turns out that VERITAS has intentionally or incidentally observed the locations of many of the top northern-hemisphere pulsar candidates ranked in this way. In this study, 13 such pulsars appearing in archival VERITAS data were probed for pulsed VHE emission in a large data set totaling over 450 hours of observations.
Analysis of the VERITAS data for the 13 archival pulsars revealed no signature of pulsed emission in all cases. Despite the nondetections, the VERITAS data enable placing constraints in the form of flux upper limits on a possible emission component manifesting at VHEs as is seen for the Crab pulsar. The obtained limits can also be used to attempt to constrain the unknown luminosity function of VHE gamma-ray pulsars, which is essentially a statement of how a pulsar's VHE emission strength scales as a function of its total power output. Finally, the limits obtained in this study can serve as a road map for future pulsar searches in the VHE gamma-ray band with next-generation instruments, such as the Cherenkov Telescope Array that is set to come online within the next few years.
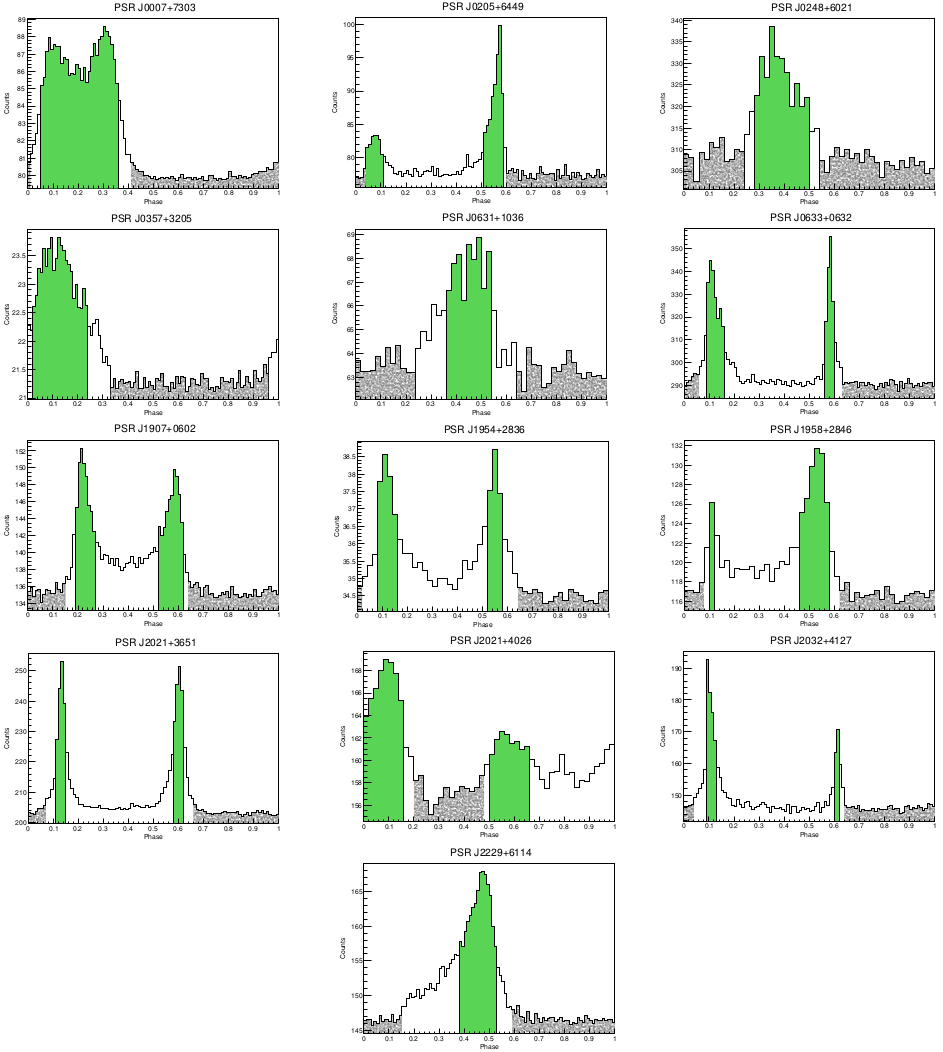
Figure 1: Light curves obtained from the phase-gating procedure (see text) showing the obtained phase-gate definitions for all 13 pulsars appearing in archival VERITAS data. The signal-counting regions, corresponding to the locations of P1 and P2 (where applicable), are shown in green, and the background-counting region is shown in gray (granulized).
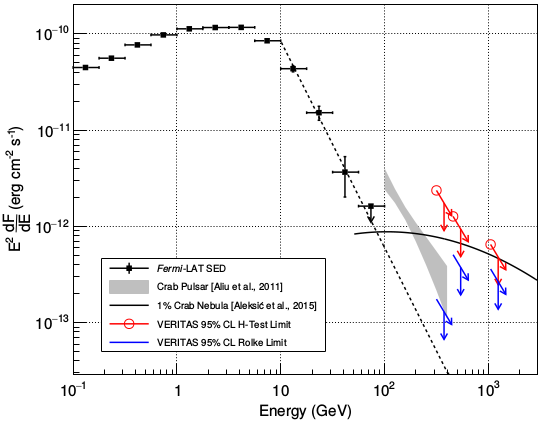
Figure 2: Fermi-LAT spectrum of PSR J0007+7303 (black squares) with VERITAS diff erential flux upper limits from the soft, moderate, and hard-cuts analyses (H-Test limits: red arrows, Rolke limits: blue arrows). A power-law fi t to the Fermi data above 10 GeV is given by the black dashed line.
Figure 3: Fermi-LAT spectra (black squares) with VERITAS diff erential flux upper limits from the soft, moderate, and hard-cuts analyses (H-Test limits: red arrows, Rolke limits: blue arrows) for PSR J0205+6449 (a), PSR J0248+6021 (b), PSR J0357+3205 (c), and PSR J0631+1036 (d).
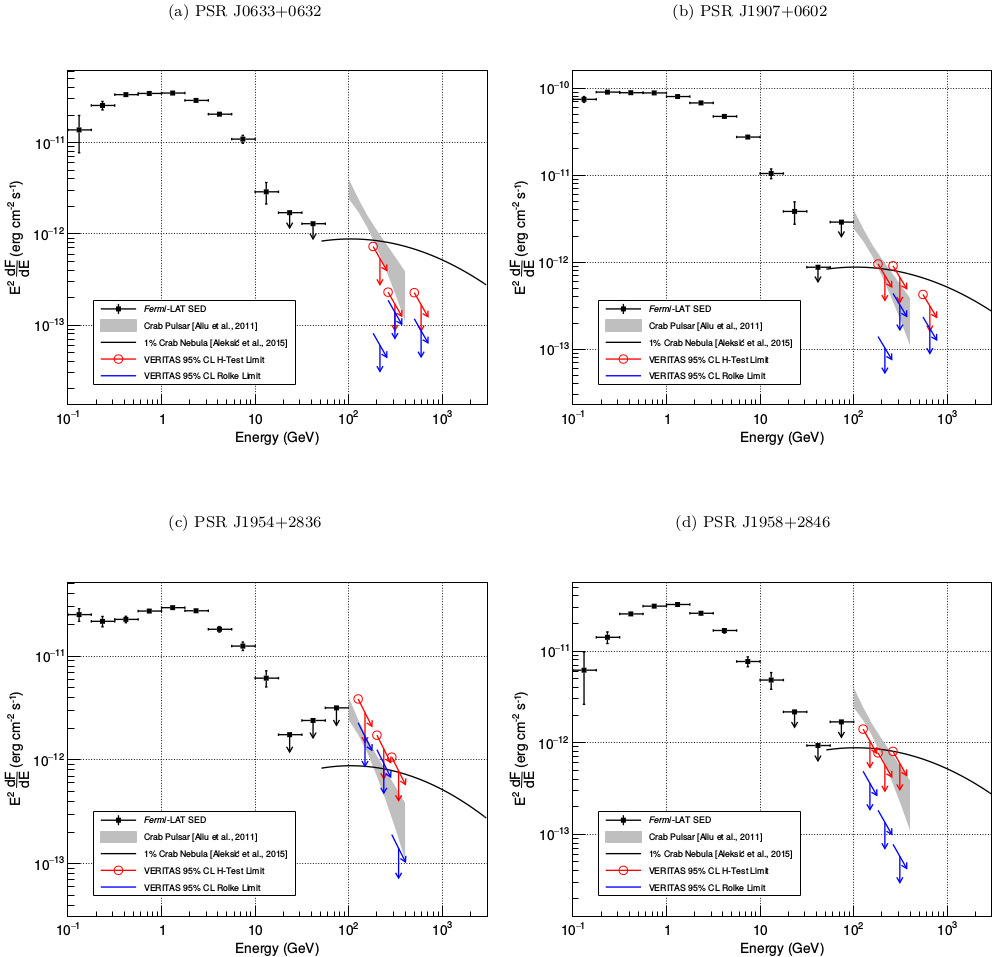
Figure 4: Fermi-LAT spectra (black squares) with VERITAS di fferential flux upper limits from the soft, moderate, and hard-cuts analyses (H-Test limits: red arrows, Rolke limits: blue arrows) for PSR J0633+0632 (a), PSR J1907+0602 (b), PSR J1954+2836 (c), and PSR J1958+2846 (d).
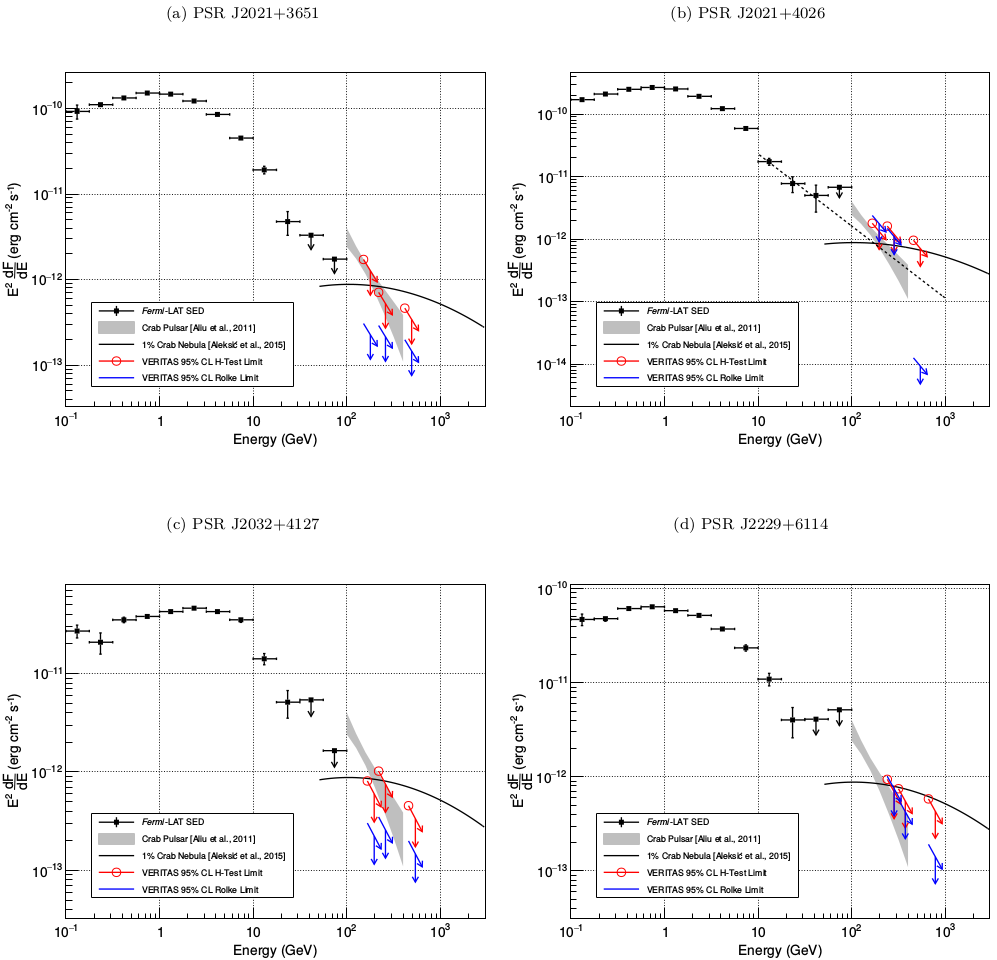
Figure 5: Fermi-LAT spectra (black squares) with VERITAS di fferential flux upper limits from the soft, moderate, and hard-cuts analyses (H-Test limits: red arrows, Rolke limits: blue arrows) for PSR J2021+3651 (a), PSR J2021+4026 (b), PSR J2032+4127 (c), and PSR J2229+6114 (d). A power-law fi t to the Fermi data above 10GeV for PSR J2021+4026 is given by the black dashed line. We note that the highest-energy Rolke
flux UL for PSR J2021+4026 appears to constrain a flux level several orders of magnitude below the other ULs; however, this UL corresponds to a large, unphysical negative excess. See Section 4 for some further discussion.
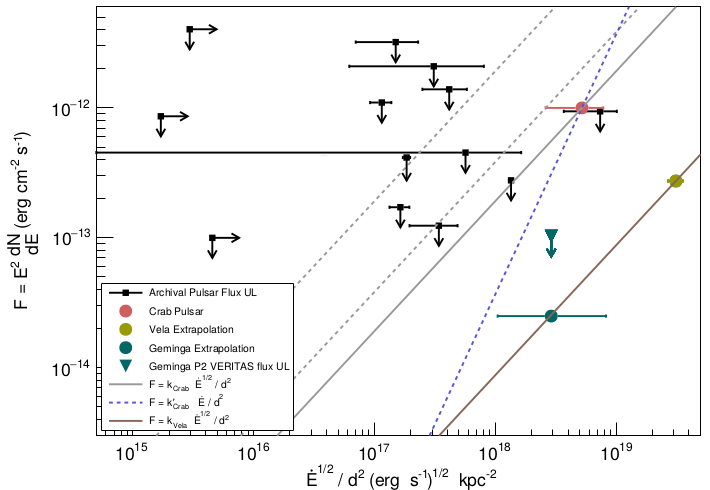
Figure 6: Flux upper limits from the phase-gate test (Rolke method) versus sqrt(E-dot)/d2 for soft cuts. The VHE flux limits are shown by the black squares, and the right-pointing arrows indicate a lower limit on sqrt(E-dot)/p2 for pulsars where only a distance limit is available. Error bars come from propagation of the uncertainty on the distance as given in Table 1. The flux and sqrt(E-dot)/p2 for the Crab pulsar are represented by the red dot. Extrapolated fluxes (see text) for the Geminga and Vela pulsars are shown as a teal and olive circles, respectively. The teal triangle and arrow is a Geminga VHE flux upper limit from VERITAS at 135 GeV from Aliu et al. (2015). The Crab pulsar flux shown here is calculated according to the method given in the text. The solid gray line corresponds to F = kCrabsqrt(E-dot)/d2 (see text). The gray dashed lines have the same proportionality but indicate a flux level of two and ten times the Crab pulsar flux. The blue dashed line corresponds to F = k'Crab E-dot/d2, which is equivalent to the prediction Lγ~ E-dot that has been made for the gamma-ray luminosity in some models (e.g., Lyutikov et al. (2012)). The solid brown line corresponds to F = kVela sqrt(E-dot)/d2 (see text).
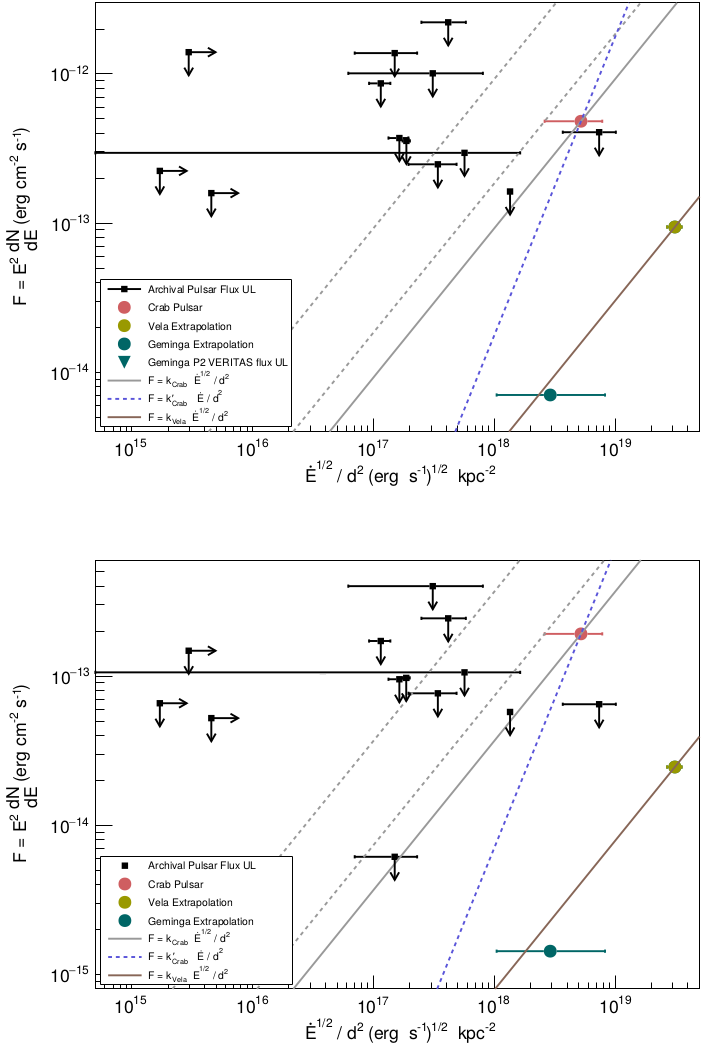
Figure 7: Same as Figure 6 for moderate cuts (top) and hard cuts (bottom). See Figure 6 caption for details.