Markarian 501 is a BL Lacertae (BL Lac) object, a member of the blazar subclass of active galactic nuclei (AGN). At very high energies (VHE; E > 100 GeV) it was first detected by the pioneering Whipple imaging atmospheric-Cherenkov telescope. In 2012, 25 instruments took part in a three month multiwavelength campaign to observe Mrk 501. This included the MAGIC, FACT and VERITAS Cherenkov telescopes, the instruments on board the Swift and Fermi spacecraft, and the telescopes operated by the GASP-WEBT
collaboration.
During this time it was seen to exhibit an unusually hard spectral index which was found to be independent of the flux. This study reports the hardest Mrk 501 VHE spectra measured to date. The VHE gamma-ray flux above 0.2 TeV was found to be ~0.5 times the Crab Nebula flux (CU) for most of the campaign. On June 9th a flare (~3 CU) was observed.
The unprecedentedly hard X-ray and VHE spectra measured imply that their low- and high-energy components peaked above 5 keV and 0.5 TeV, respectively, during a large fraction of the observing campaign, and hence that Mrk 501 behaved like an extreme high-frequency- peaked blazar (EHBL) throughout the 2012 observing season. This suggests that being an EHBL may not be a permanent characteristic of a blazar, but rather a state which may change over time.
Thanks to the excellent coverage from all instruments it was possible to form 17 broad band spectral energy distributions. These were then modelled using a one-zone synchrotron self-Compton model. In an attempt to improve the fit of the flare of June 9th, a two-zone model was also used. The one-zone SSC scenario used can successfully describe the segments of the SED where most energy is emitted, with a significant correlation between the electron energy density and the VHE gamma-ray activity, suggesting that most of the variability may be explained by the injection of high-energy electrons..
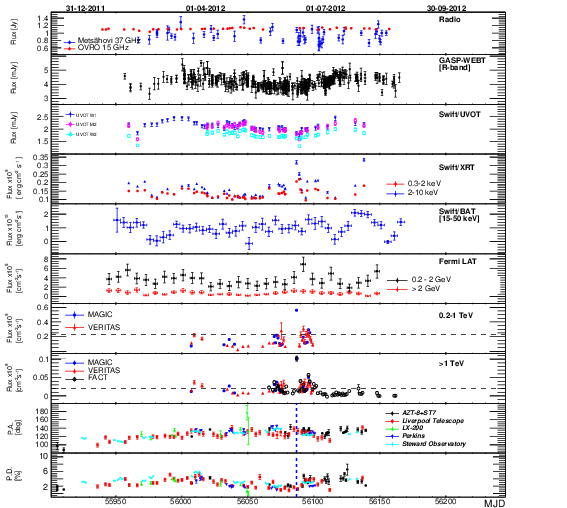
Figure 1: Multiwavelength light curve for Mrk 501 during the 2012 campaign. The bottom two panels report the electric vector polarization angle (P.A.) and polarization degree (P.D.). The correspondence between the instruments and the measured quantities is given in the legends. The horizontal dashed line in the VHE light curves represents 1 CU as reported in Aleksic et al. (2016), and the blue vertical dotted lines in the panels
with the polarization light curves depict the day of the large VHE flare (MJD 56087).
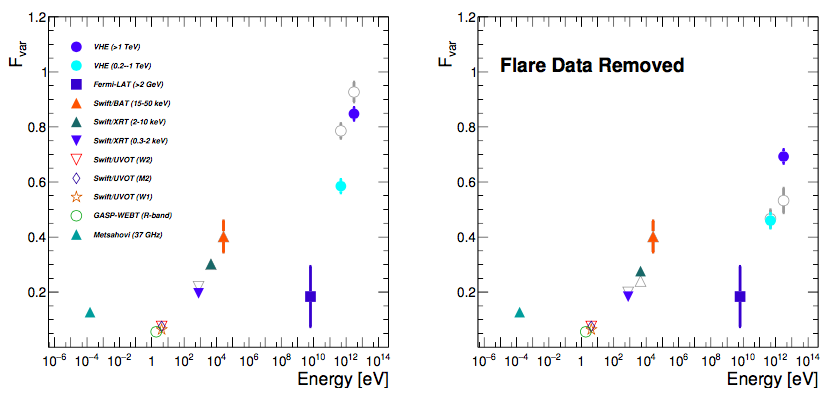
Figure 2: Fractional variability Fvar for each instrument as a function of energy. Left panel includes all data, while the right panel includes all data except for the day of the VHE flare (MJD 56087). Fvar values computed with X-ray and VHE data taken within the same night are shown with gray open markers.
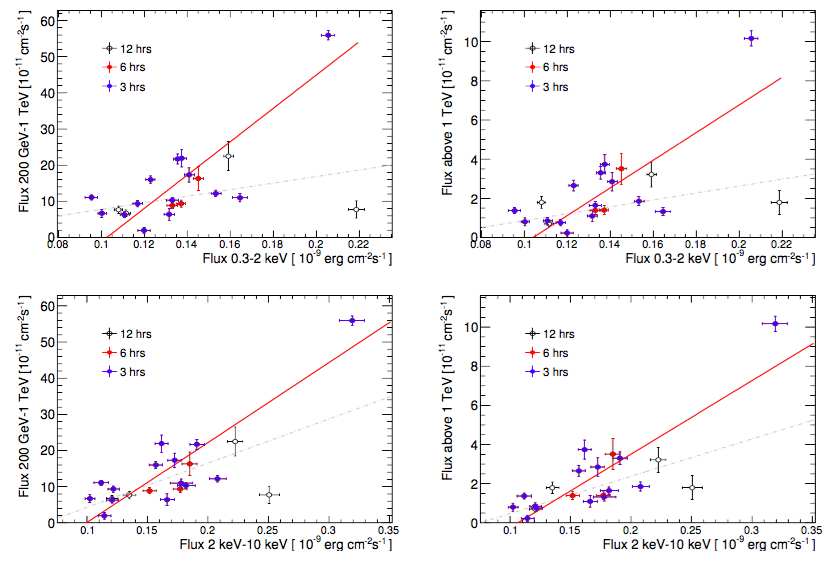
Figure 3: VHE flux as a function of the Swift/XRT flux for the energy ranges shown. Open circles represent data that were taken within 12 hours of each other, red circles within 6 hours and blue circles within 3 hours. In each case, linear fits to the closed circle points (6 hours or less) are depicted with a red line (when considering the June 9 flare) and with a dotted-dashed grey line (when excluding the June 9 flare).
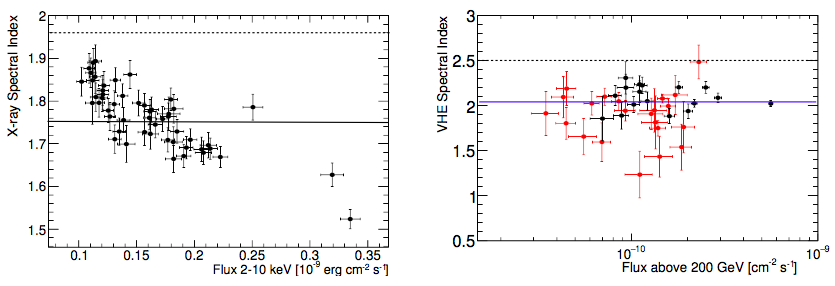
Figure 4: Left Panel: Swift/XRT X-ray power-law spectral index vs flux in the 2-10 keV band. Right Panel: Measured VHE power-law spectral index vs VHE Flux above 0.2 TeV. Red points represent VERITAS data and black points MAGIC data. The data are EBL corrected using Franceschini et al. (2008). The Swift/XRT spectrum of Mrk 501 is often curved, and can be described at keV energies with a spectral index that is typically between 1.8 and 2.1, while the VHE spectral index measured with MAGIC and VERITAS during typical non-flaring activity is about 2.5 (Abdo et al. 2011; Aleksic et al. 2015a). The typical spectral indices at X-ray and VHE are marked with a dashed line. For comparison purposes, the panels depict with solid lines the result of a fit with a constant to the X-ray and VHE spectral indices.
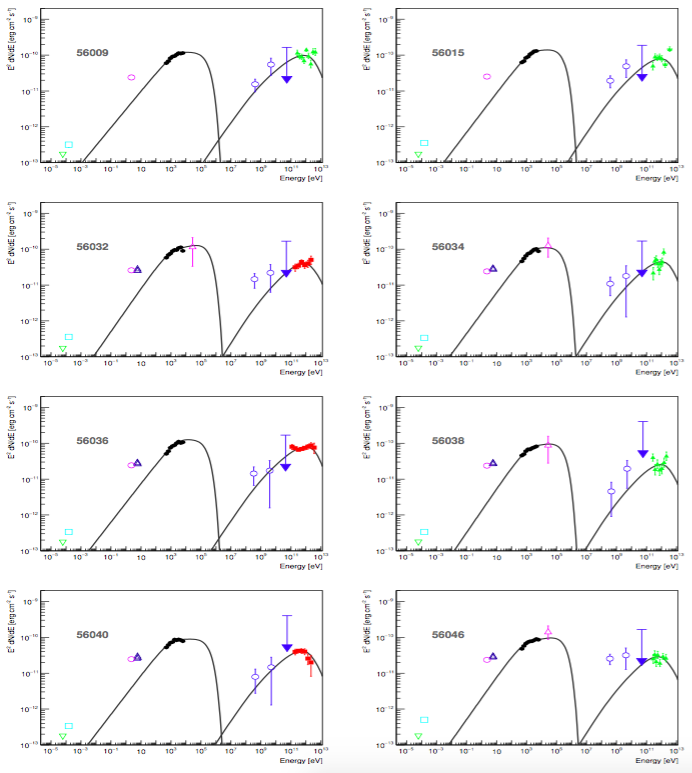
Figure 5: Spectral energy distributions (SED) for 8 observations between MJD 56009 and MJD 57046. The markers match the following experiments; the green open triangle OVRO (radio 15 GHz), blue open square Metshovi (radio 37 GHz), red open circle (R–band optical, corrected for host galaxy), blue open triangles Swift/UVOT (UV), black filled circles Swift/XRT (X–ray), pink open triangles Swift/BAT (X–ray), blue open circles Fermi–LAT (gamma rays) and red/green filled squares/triangles MAGIC/VERITAS (VHE gamma rays). VHE data are EBL–corrected using Franceschini et al. (2008). The BAT energy flux relates to a one-day average, while the Fermi–LAT energy flux relates to three-day average centered at the VHE observation. Filled markers are those fit by the theoretical model, while open markers are not. The black line represents the best fit with a one–zone SSC model, with the results of the fit reported in Table 2.

Figure 6: Spectral energy distributions (SED) for 8 observations between MJD 57061 and MJD 57095. See Figure 5 for explanation of markers and other details. The black line represents the best fit with a one–zone SSC model, with the results of the fit reported in Table 2.
Figure 7: Broadband SED for MJD 56087 (VHE flare from 2012 June 9), fitted with a one-zone SSC model (top) and a two-zone SSC model (bottom). See Figure 5 for explanation of markers and other details. In the bottom panel, the green line depicts the emission of the first (large) zone responsible for the baseline emission, and the red line the emission from the second (smaller) zone, that is responsible for the flaring state. The fit results from the one-zone SSC model fit are reported in Table 2, while those from the two-zone SSC model fit are reported in Table 3.
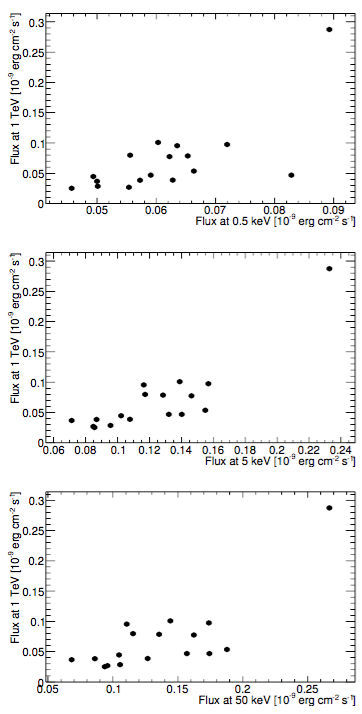
Figure 8: Flux-flux plots derived from the one-zone SSC model used to fit 17 broadband SEDs (see Section 6). The SSC model flux at 1 TeV is compared to the SSC model flux at 0.5 keV (top), 5 keV (middle) and 50 keV (bottom). The data point with the highest X-ray and VHE activity corresponds to the one-zone SSC model for the June 9 flare (MJD 56087).
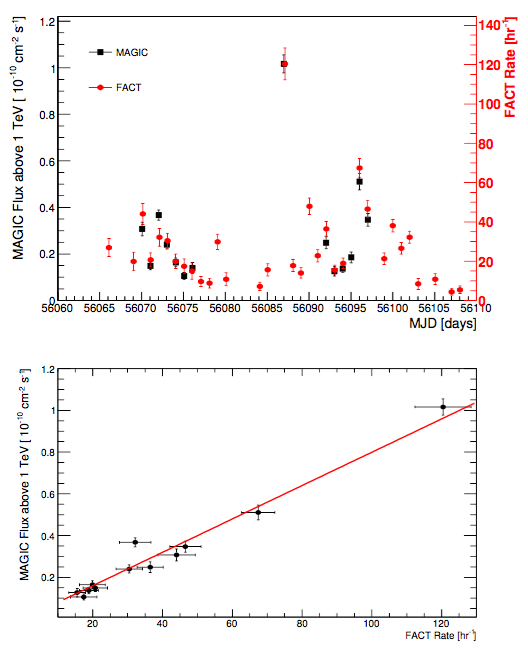
Figure 9: Top panel: superposition of the FACT excess rates and MAGIC light curve above 1 TeV. Bottom panel: correlation between the FACT excess rate and the MAGIC flux above 1 TeV on the 12 days when data
were taken by both instruments.