VERITAS joined the largest multi-wavelength campaign to observe one of the historic TeV galaxies known as Mrk 501. This source, known to be a gamma-ray emitting galaxy for more than 20 years, still remains to be understood. The observations occurred in 2013, and included observations at very low energies (radio) all the way to the highest energies (gamma ray observations with VERITAS). Notably, the efforts were matched by the relatively new space based X-ray instrument NuSTAR, which is the most sensitive hard X-ray instrument in orbit around Earth.
With the observations from the more than 10 instruments involved in the campaign, the physical mechanism responsible for the observed photons from the source was explored. The emission was observed to vary during the observations, being consistent with a possible episode of magnetic reconnection where relativistic charged particles were accelerated up to even higher energies for approximately 24 hours.
During the observation period in 2013 the galaxy showed characteristics which are different than the previous observations which have occurred over the years, making it clear that gamma-ray galaxies, and more specifically gamma-ray galaxies like Mrk 501 (with relativistic jets beamed directly at us) undergo chaotic episodes that seem to be independent events. In order to get a solid understanding of the physical characteristics and how the gamma-ray photons are produced within Mrk 501, additional observation campaigns such as this one are necessary, but will likely show new, never-before observed periods of activity.
Figure 1: The spectral energy distributions of Mrk 501 derived from the Nu-STAR observations, showing the PL (red), BKNPL (green) and LP (blue) models fitted to each observation. The NuSTAR observations show significant detection of the blazar up to at least 65 keV in each observation. The data-to-model ratios are shown in the bottom panel of each plot, with the spectral fit parameters summarized in Table 2. Spectra have been/ rebinned for figure clarity.
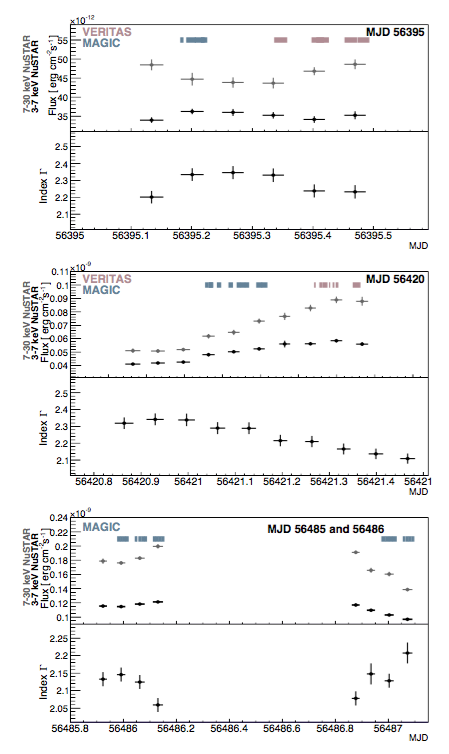
Figure 2: The NuSTAR orbit-binned light curves, with 3-7 keV (black) and 7-30 keV (grey) integral flux values (top panel of each plot) and the log-parabolic indices (Γ, lower panel) with the curvature parameters (β) fixed to the value found for the full NuSTAR exposure. The third and fourth observations are shown in the third plot. The periods where simultaneous quality-selected observations with MAGIC and VERITAS occurred are highlighted in the top panel of each plot with color coded bands. We note that the vertical axes are set differently for each observation to allow a clear view of the orbit-to-orbit variability and that the light curve for the full campaign is shown in Figure 5.
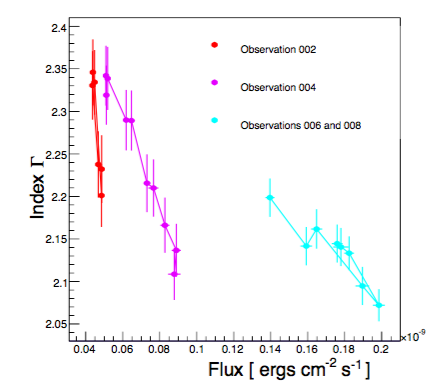
Figure 3: The log-parabolic fit index Γ at 10 keV versus the 7-30 keV integral flux for NuSTAR, binned by orbit. The first exposure is shown in red, the second in violet, and the last two in cyan, with solid lines meant to guide the eye along the parameter evolution over the full observations. In all three cases, the spectrum hardens when the intensity increases; in the fourth observation, the spectrum then softens as the intensity decreases.
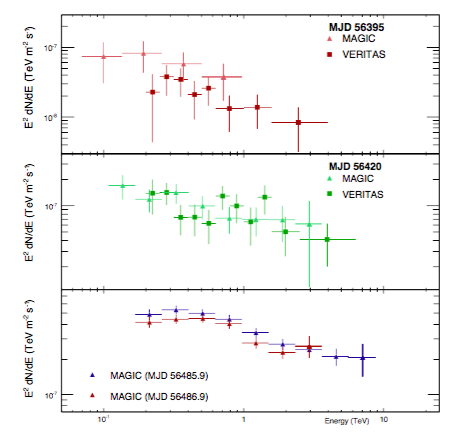
Figure 4: MAGIC and VERITAS spectra averaged over epochs with simultaneous NuSTAR exposures. The power-law spectral fitting parameters for the VHE data are summarized in Table 3. Only statistical (1ó) error bars are shown for each of the spectral points.
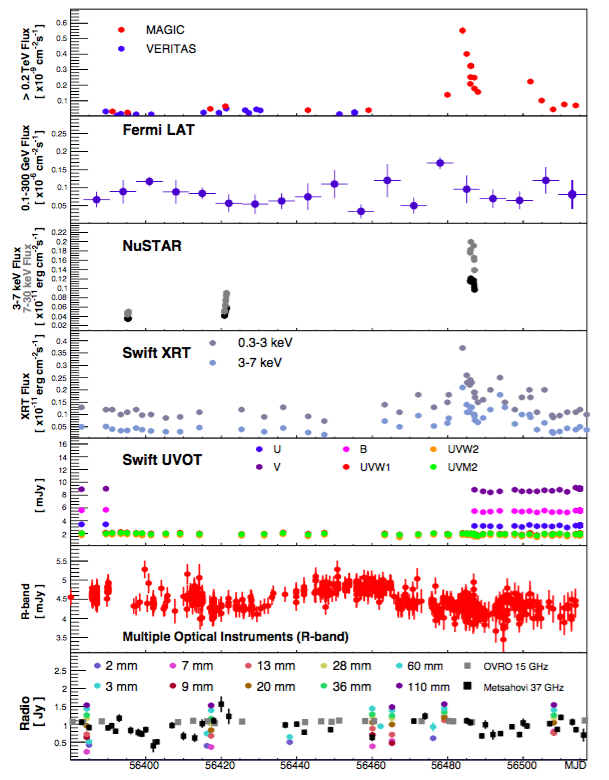
Figure 5: The broadband light curves of Mrk 501 from MJD 56380 to 56520. The VHE data are shown with statistical error bars only. Optical data are corrected as described in Section 3.4. All radio light curve points for 2-110mm are provided by the F-Gamma consortium.
Figure 6: The broadband light curve zoomed in to the period of the elevated X-ray and VHE gamma-ray state.
Figure 7: The power-law index versus 3-7 keV flux values fit to the Swift XRT observations of Mrk 501.
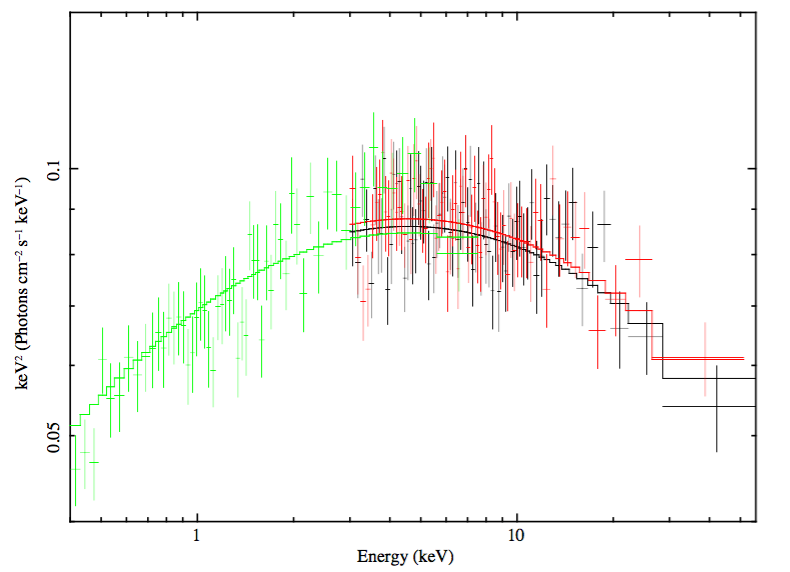
Figure 8: Example of a broadband X-ray spectrum of Mrk 501 in the crucial region where the synchrotron peak (in the E × F(E) representation) is located. The spectra result from a simultaneous observation with Swift (green) and NuSTAR (FPMA: red, FPMB: black) on 2013 July 12-13. The spectral fit used a log-parabolic model (see the text) with Galactic column density of 1.55 × 1020 cm−2. For the purpose of illustrating the intrinsic spectrum of the source, the solid lines which represent the fit to the Swift and NuSTAR data show the spectrum before the Galactic absorption. The normalizations of the Swift and NuSTAR data were allowed to be free, and the offset between them was less than 10%, thus illustrating generally good cross-calibration of the two instruments.
Figure 9: The fractional variability (Fvar) calculated for each instrument separately.
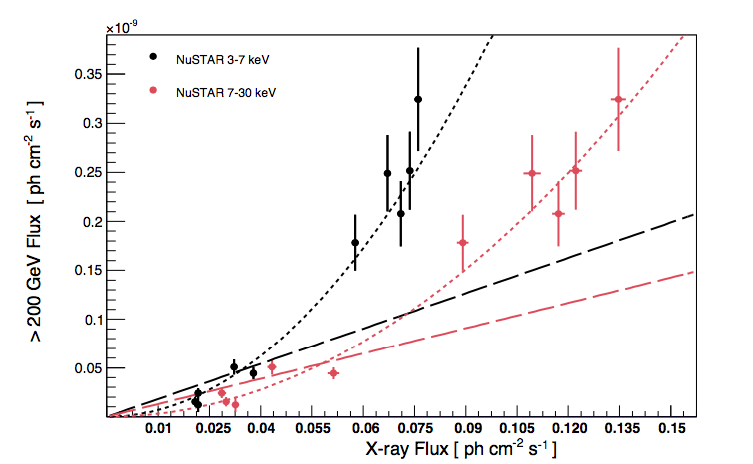
Figure 10: NuSTAR X-ray photon flux versus simultaneous > 200 GeV flux from MAGIC and VERITAS. The dotted lines show quadratic fits to the data, while the dashed lines show linear fits to the 3-7 keV and 7-30 keV bands.
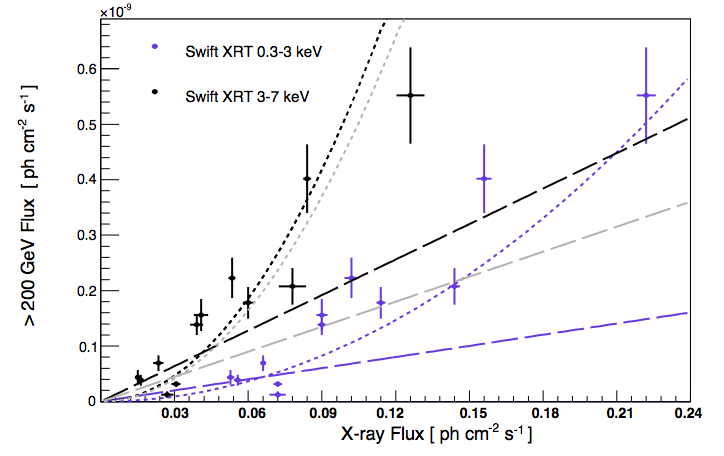
Figure 11: Swift 0.3-3 and 3-7 keV X-ray photon flux values versus simultaneously measured > 200 GeV flux from MAGIC and VERITAS. The black and blue dotted lines show quadratic fits to the 3-7 keV and 0.3-3 keV data, respectively, while the black and blue dashed lines show linear fits to the 0.3-3 keV and 3-7 keV bands, respectively. For completeness, we also compare the linear and quadratic fits of the simultaneous 3-7 keV NuSTAR and > 200 GeV flux from MAGIC and VERITAS summarized in Figure 10 (light grey dashed and dotted line).
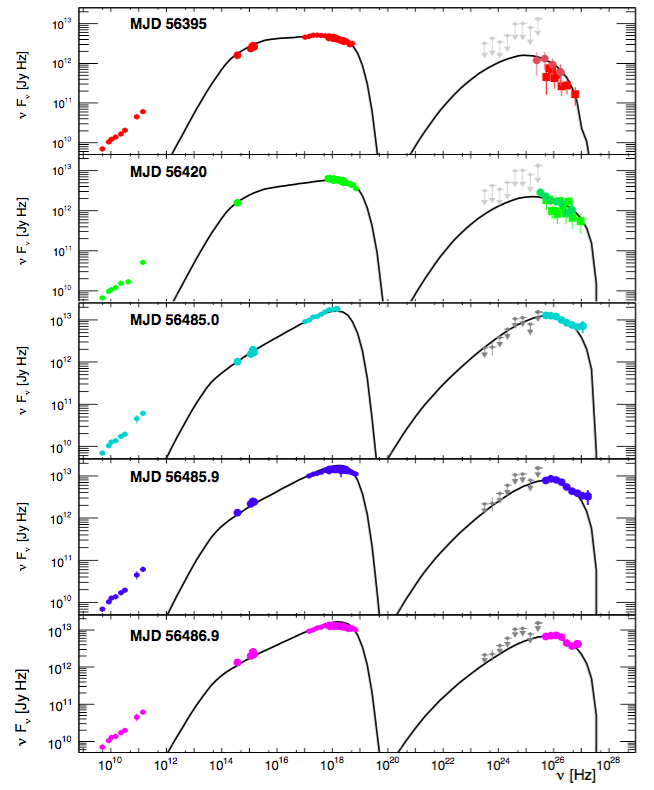
Figure 12: Observed broadband SEDs of Mrk 501 on each of the days where NuSTAR observations occurred (red, green, blue and pink data). Additionally we include observations from MJD 56485.0 (turquoise, center panel), which show the SED one day after the most elevated flux state observed during this campaign. The broadband data are represented with a single-zone SSC model (solid line), with the model parameters summarized in Table 6. The Fermi LAT limits shown in the top two panels are taken from analysis of data between MJD 56381 and 56424, while the bottom three panels show Fermi results produced from analysis of data between MJD 56471 and 56499.
