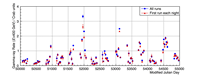
Mrk421 gamma-ray flux (E > 400 GeV) for each darkrun from 1995 to 2009. For details, see Figure 12 below.
Reference: V. Acciari et al. (The VERITAS Collaboration), Astroparticle Physics 54: 1, 2014
Markarian 421 (Mrk 421) was the first extragalactic object detected at very high energy (VHE, above ~100 GeV). The detection, in 1992, was made with the 10 m atmospheric-Cherenkov imaging telescope (“Whipple 10 m”) at the F. L. Whipple Observatory in southern Arizona. Sadly, this venerable instrument was decommissioned in 2011 after more than 40 years of operation, and it was finally dismantled in 2013. Here we present a record of 878.4 hours of Mrk 421 observations with the Whipple 10 m on 783 nights from December 1995 to June 2009. During this period, the 10 m camera underwent various modifications; moreover, at the start of each observing season, the hardware trigger setting was adjusted to compensate for changes in mirror and PMT performance. Thus, to compare observations over the 14-yr span, Mrk 421 fluxes are given in “Crab units”, i.e., in units of the VHE flux of the Crab Nebula, considered a “standard candle” in the VHE regime. Above the 400 GeV energy threshold of the Whipple 10 m, the Mrk 421 spectrum is similar to that of the Crab Nebula, so rates expressed in Crab units are valid for all but the very highest Mrk 421 fluxes.
We discuss three aspects: flux variability, correlation with X-rays, and flares.
Variability: The VHE flux from Mrk 421 varies on timescales from minutes to years. The average flux over the 14 years is 0.446 Crab units, but average yearly rates vary between 0.23 and 1.86 Crab units. On a nightly basis, the average flux ranges up to ~7 Crab units; on shorter timescales, fluxes up to 13 Crab units are seen. One-third of all 28-min observing runs have flux >1 Crab unit; 3.5% of runs have flux >3 Crab units. At the same time, the variations exhibit no discernible pattern: we see no evidence for periodicity on any timescale up to 7 years.
Correlations: X-ray observations of Mrk 421 with the all-sky monitor (ASM) on the RXTE satellite for the 1995-2009 epoch show good correlation with the VHE observations on month and year timescales, complementing previous results for shorter timescales during flaring episodes. For the timescales presented here, any temporal offset between VHE and X-ray is less than 15 days.
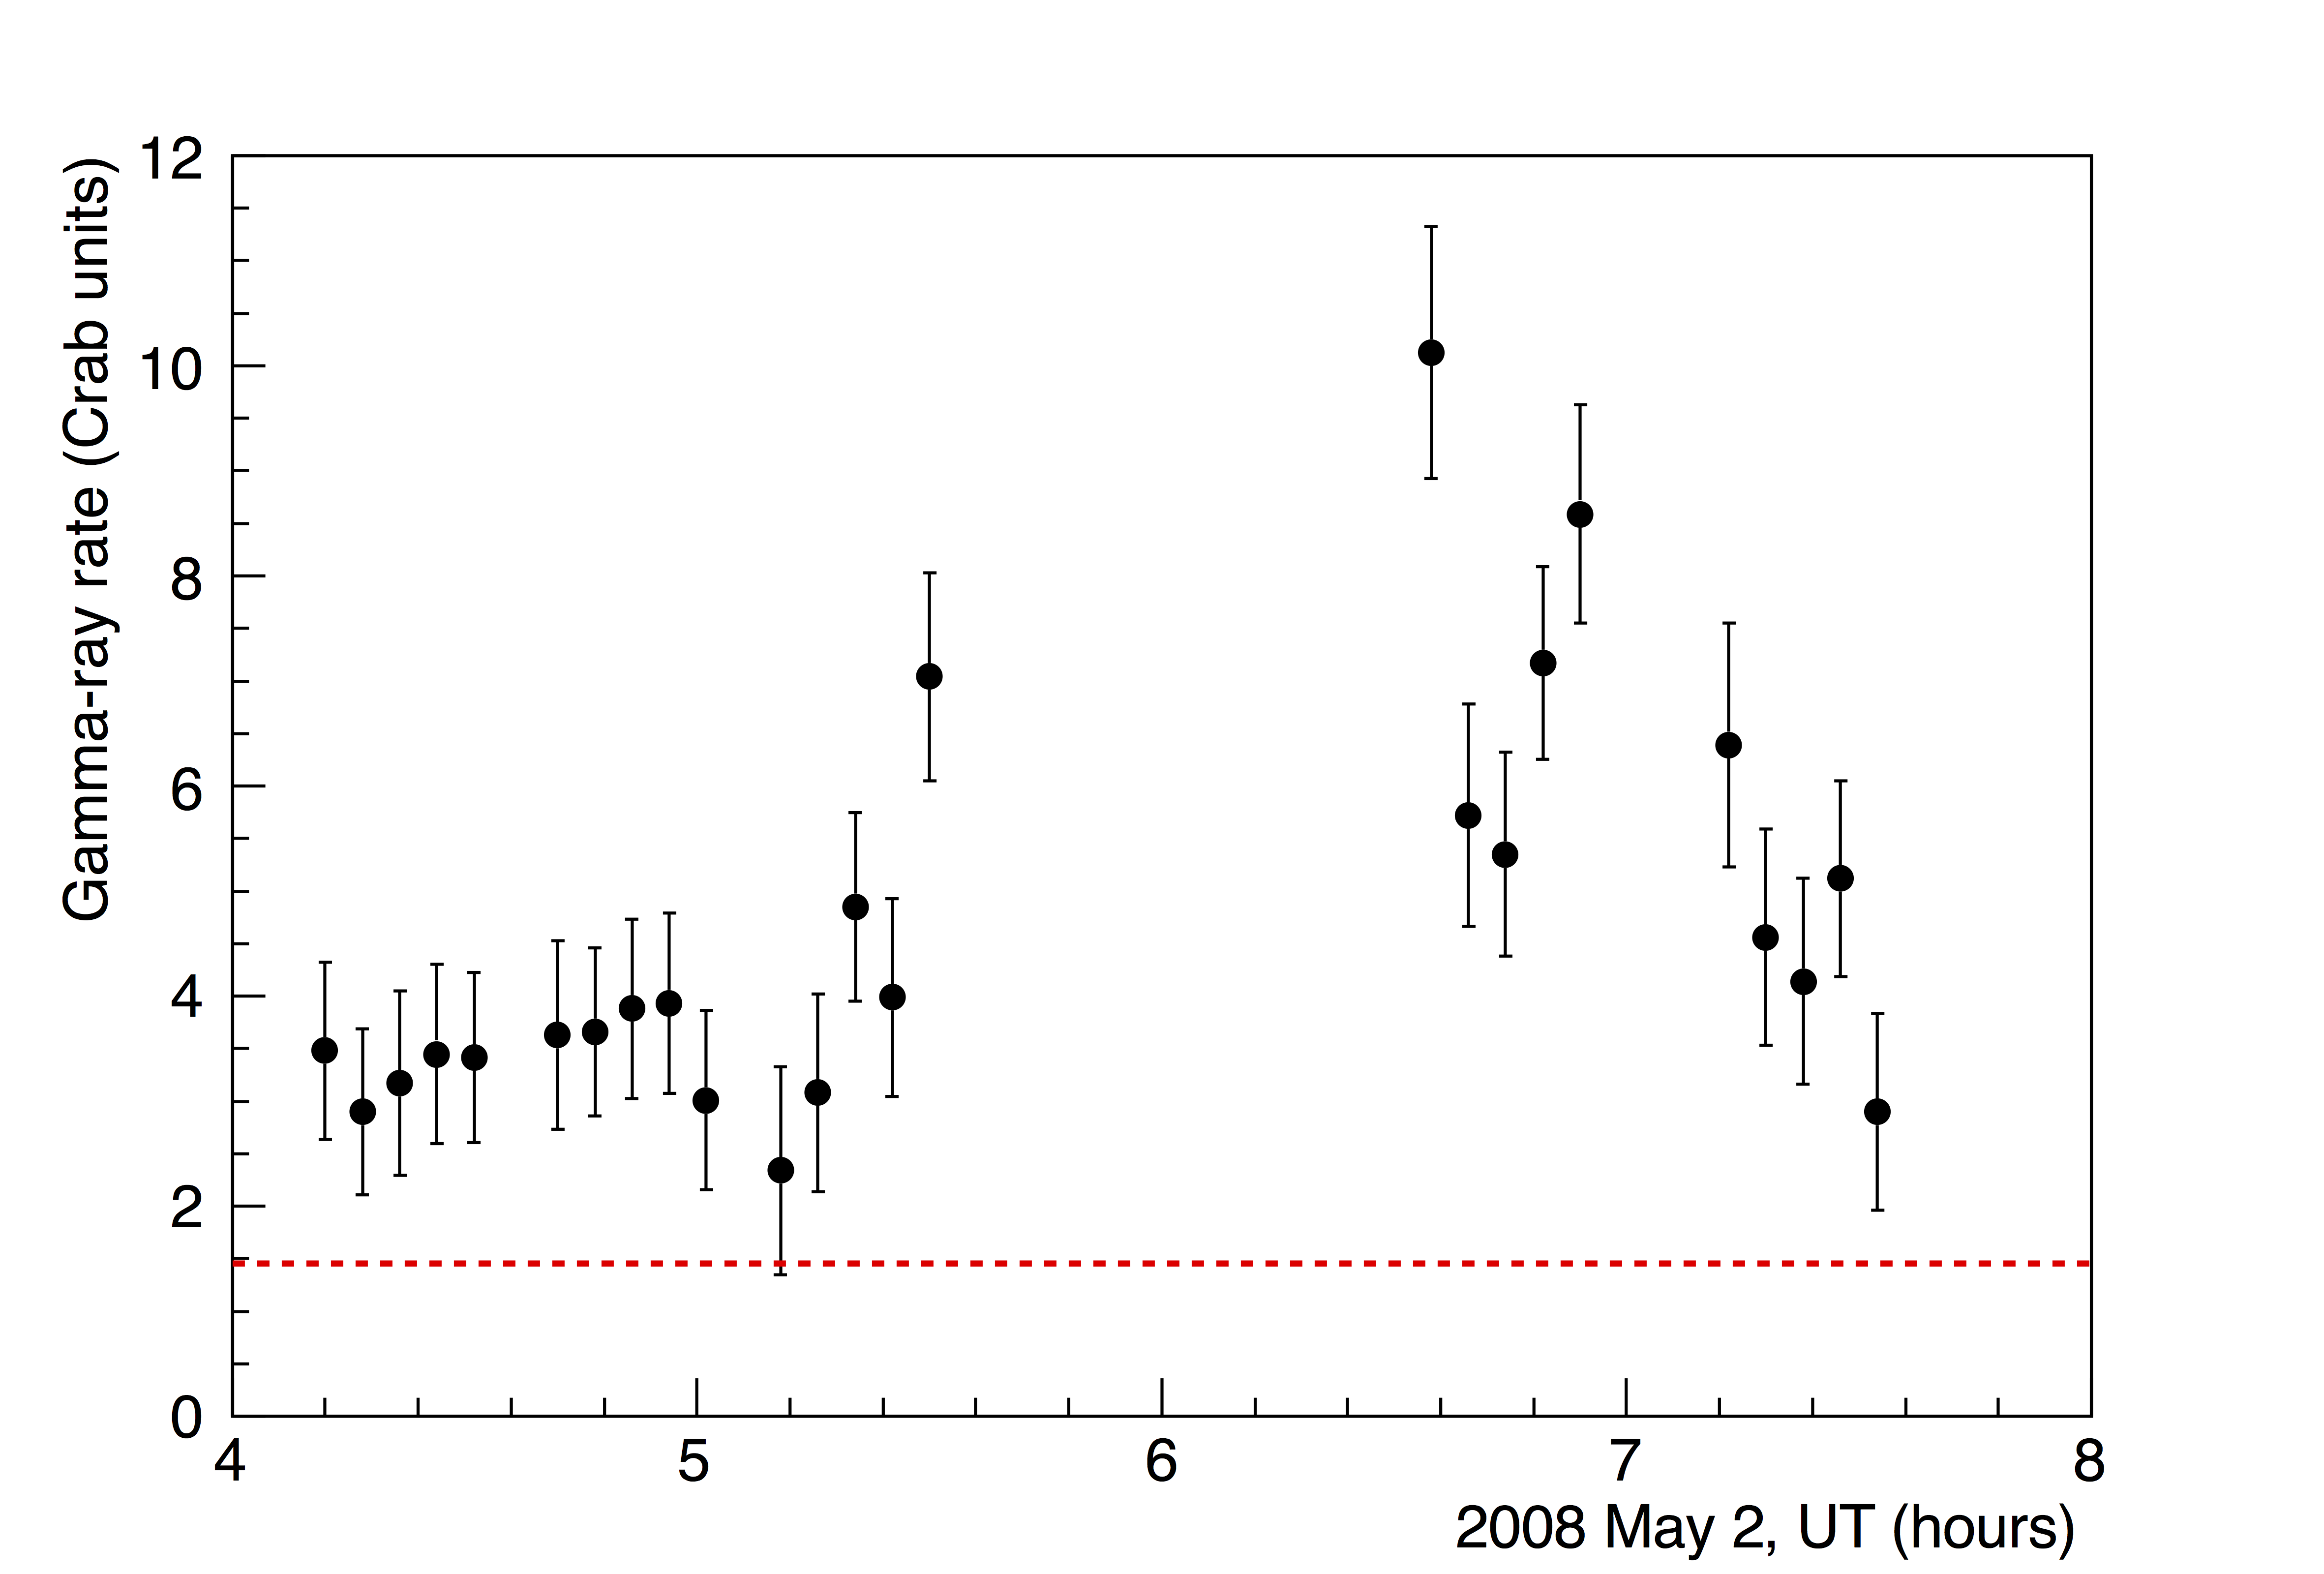
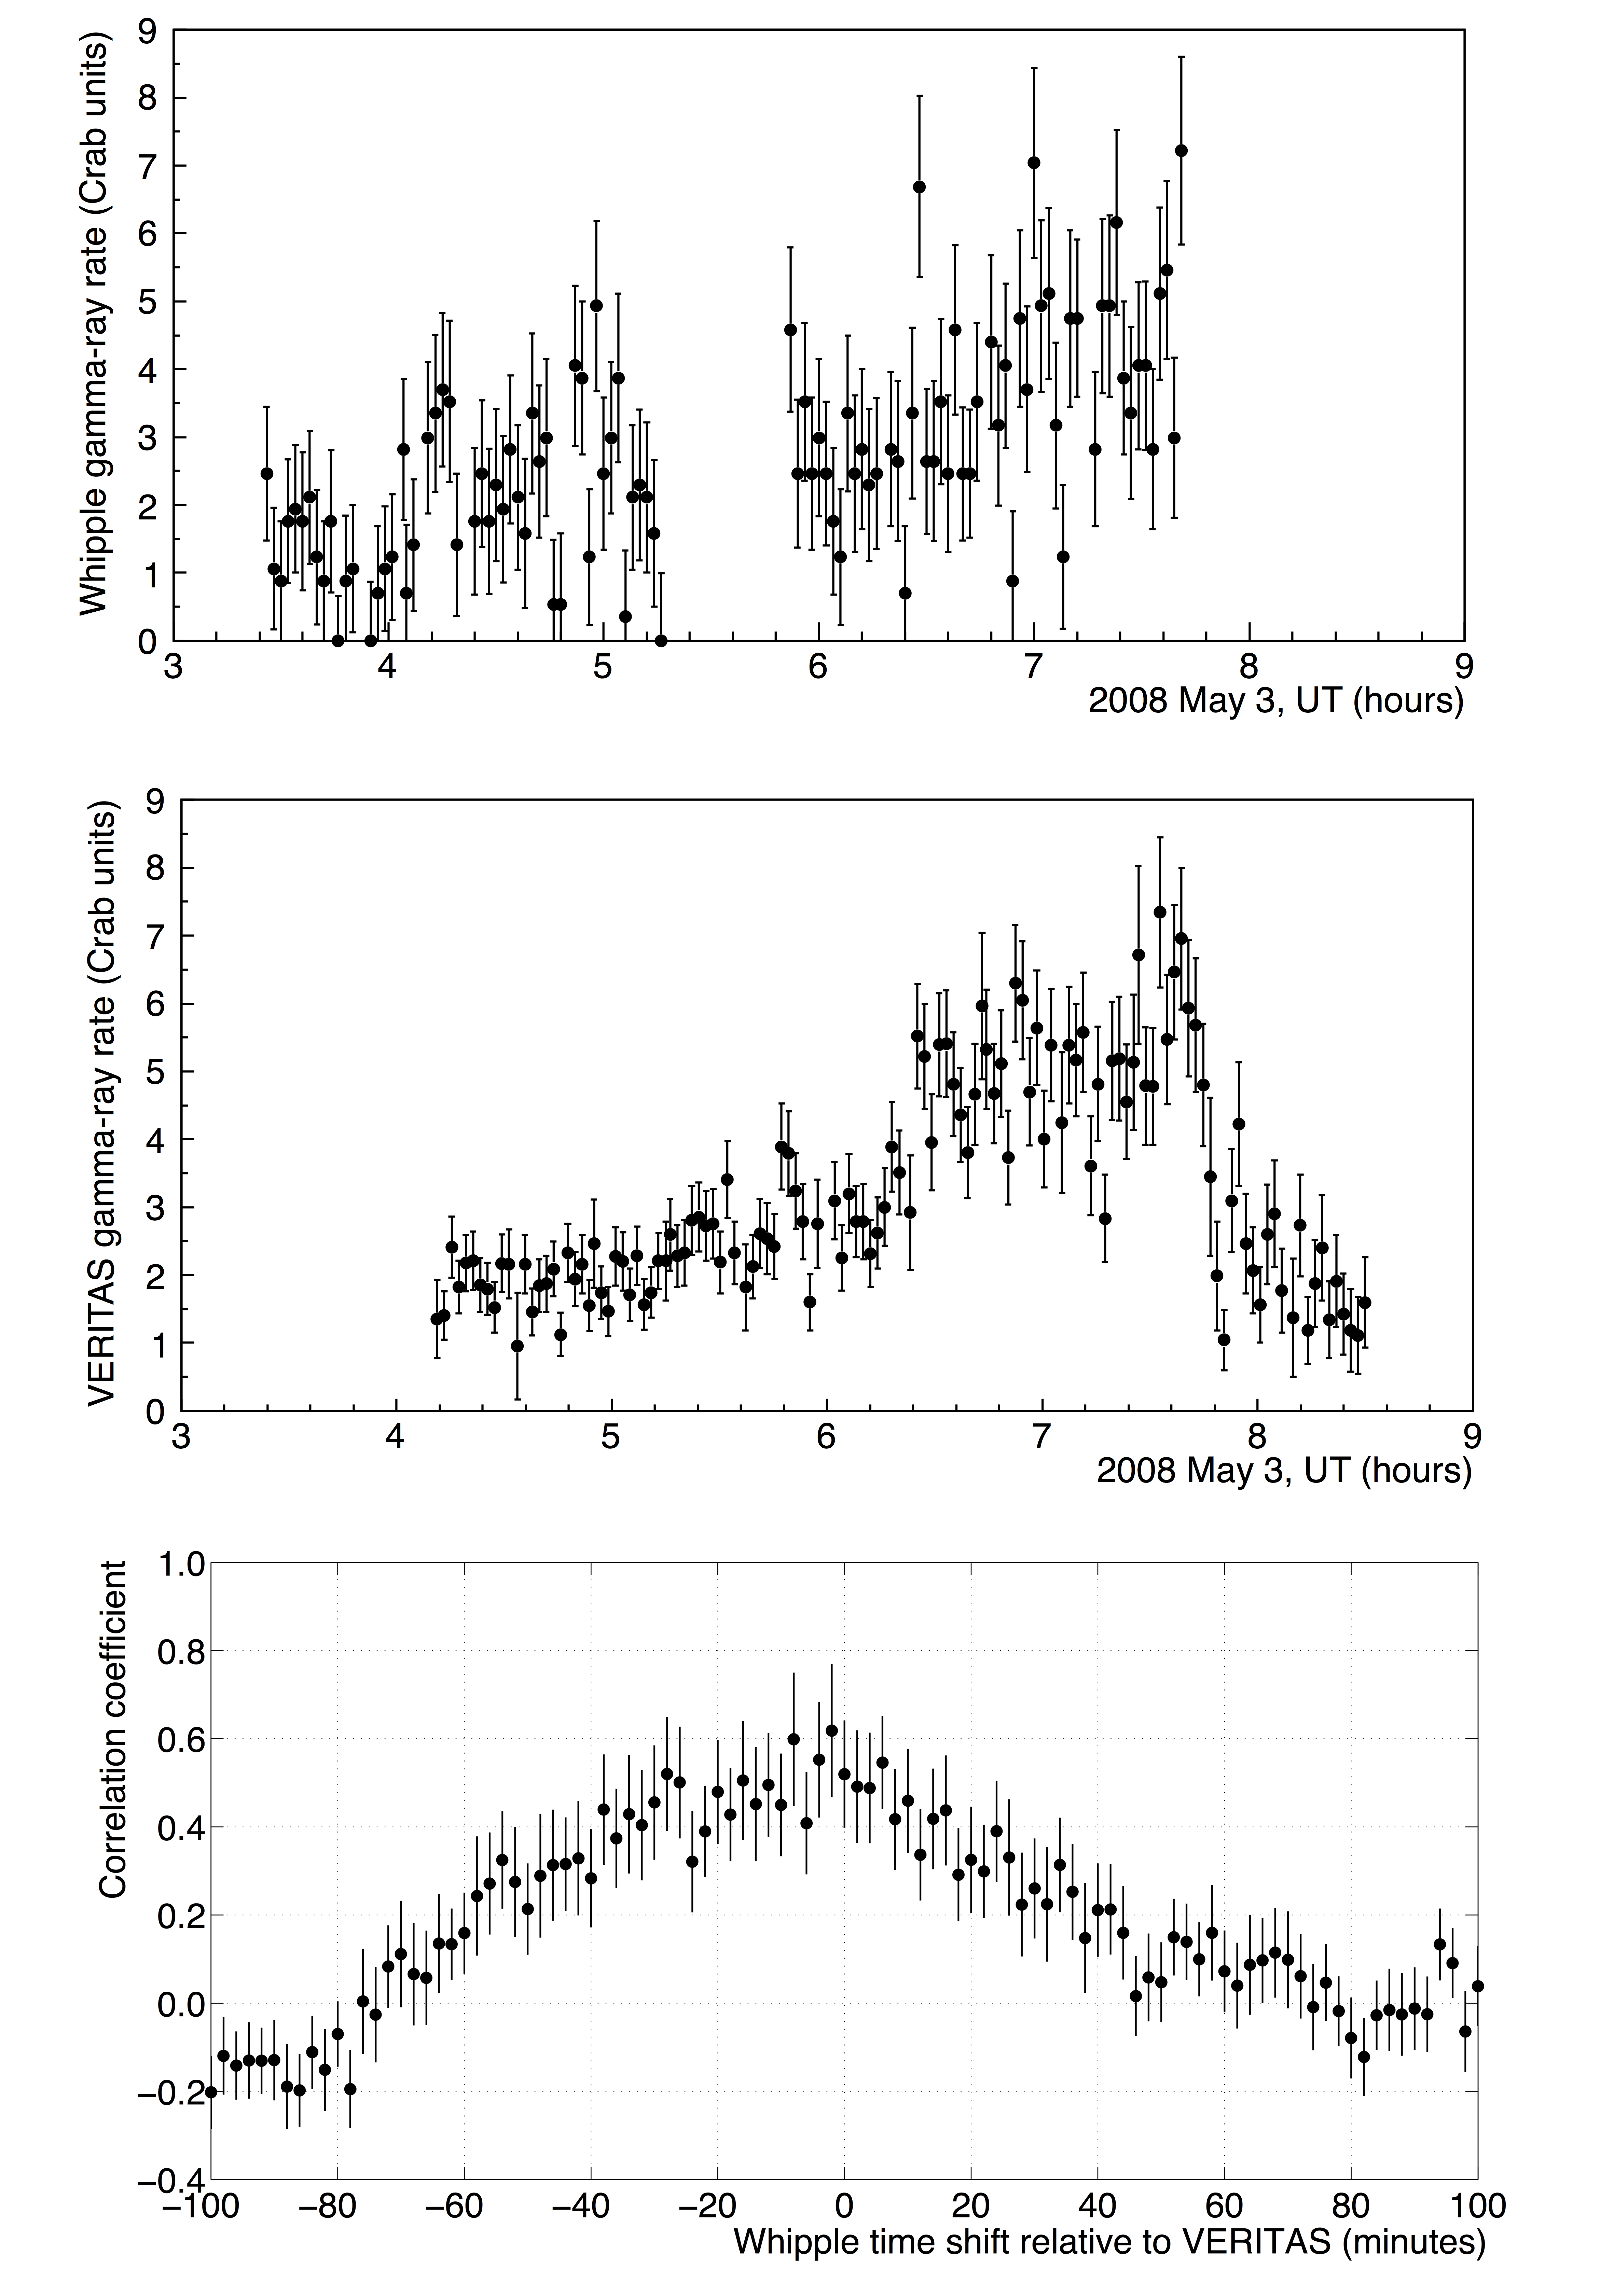
Flares: We summarise results for intense VHE flaring of Mrk 421 in 1996, 2001, and 2008. The 1996 episode comprised two short flares; the first flare (May 7), was very intense (>10 Crab units) and lasted some hours, while the second flare, eight days later, was contained within a single 28-min observing run. For the high-flux state in 2001, we present a light curve showing elevated flux extending from January to March. In 2008, flares were detected on May 2 and May 3; for the May 3 flare, overlapping observations with the VERITAS 4-telescope array show clear correlation with the Whipple 10 m data. The VERITAS and Whipple systems are separated by 7 km, their triggering and timing arrangements are independent of one another, and they have different energy thresholds, so this correlation shows that the atmospheric-Cherenkov technique really does work!
ASCII file of full light curve here.
FITS files: Excess map (Figure 1); spectrum (Figure 2).
Figures from paper (click to get full size image):
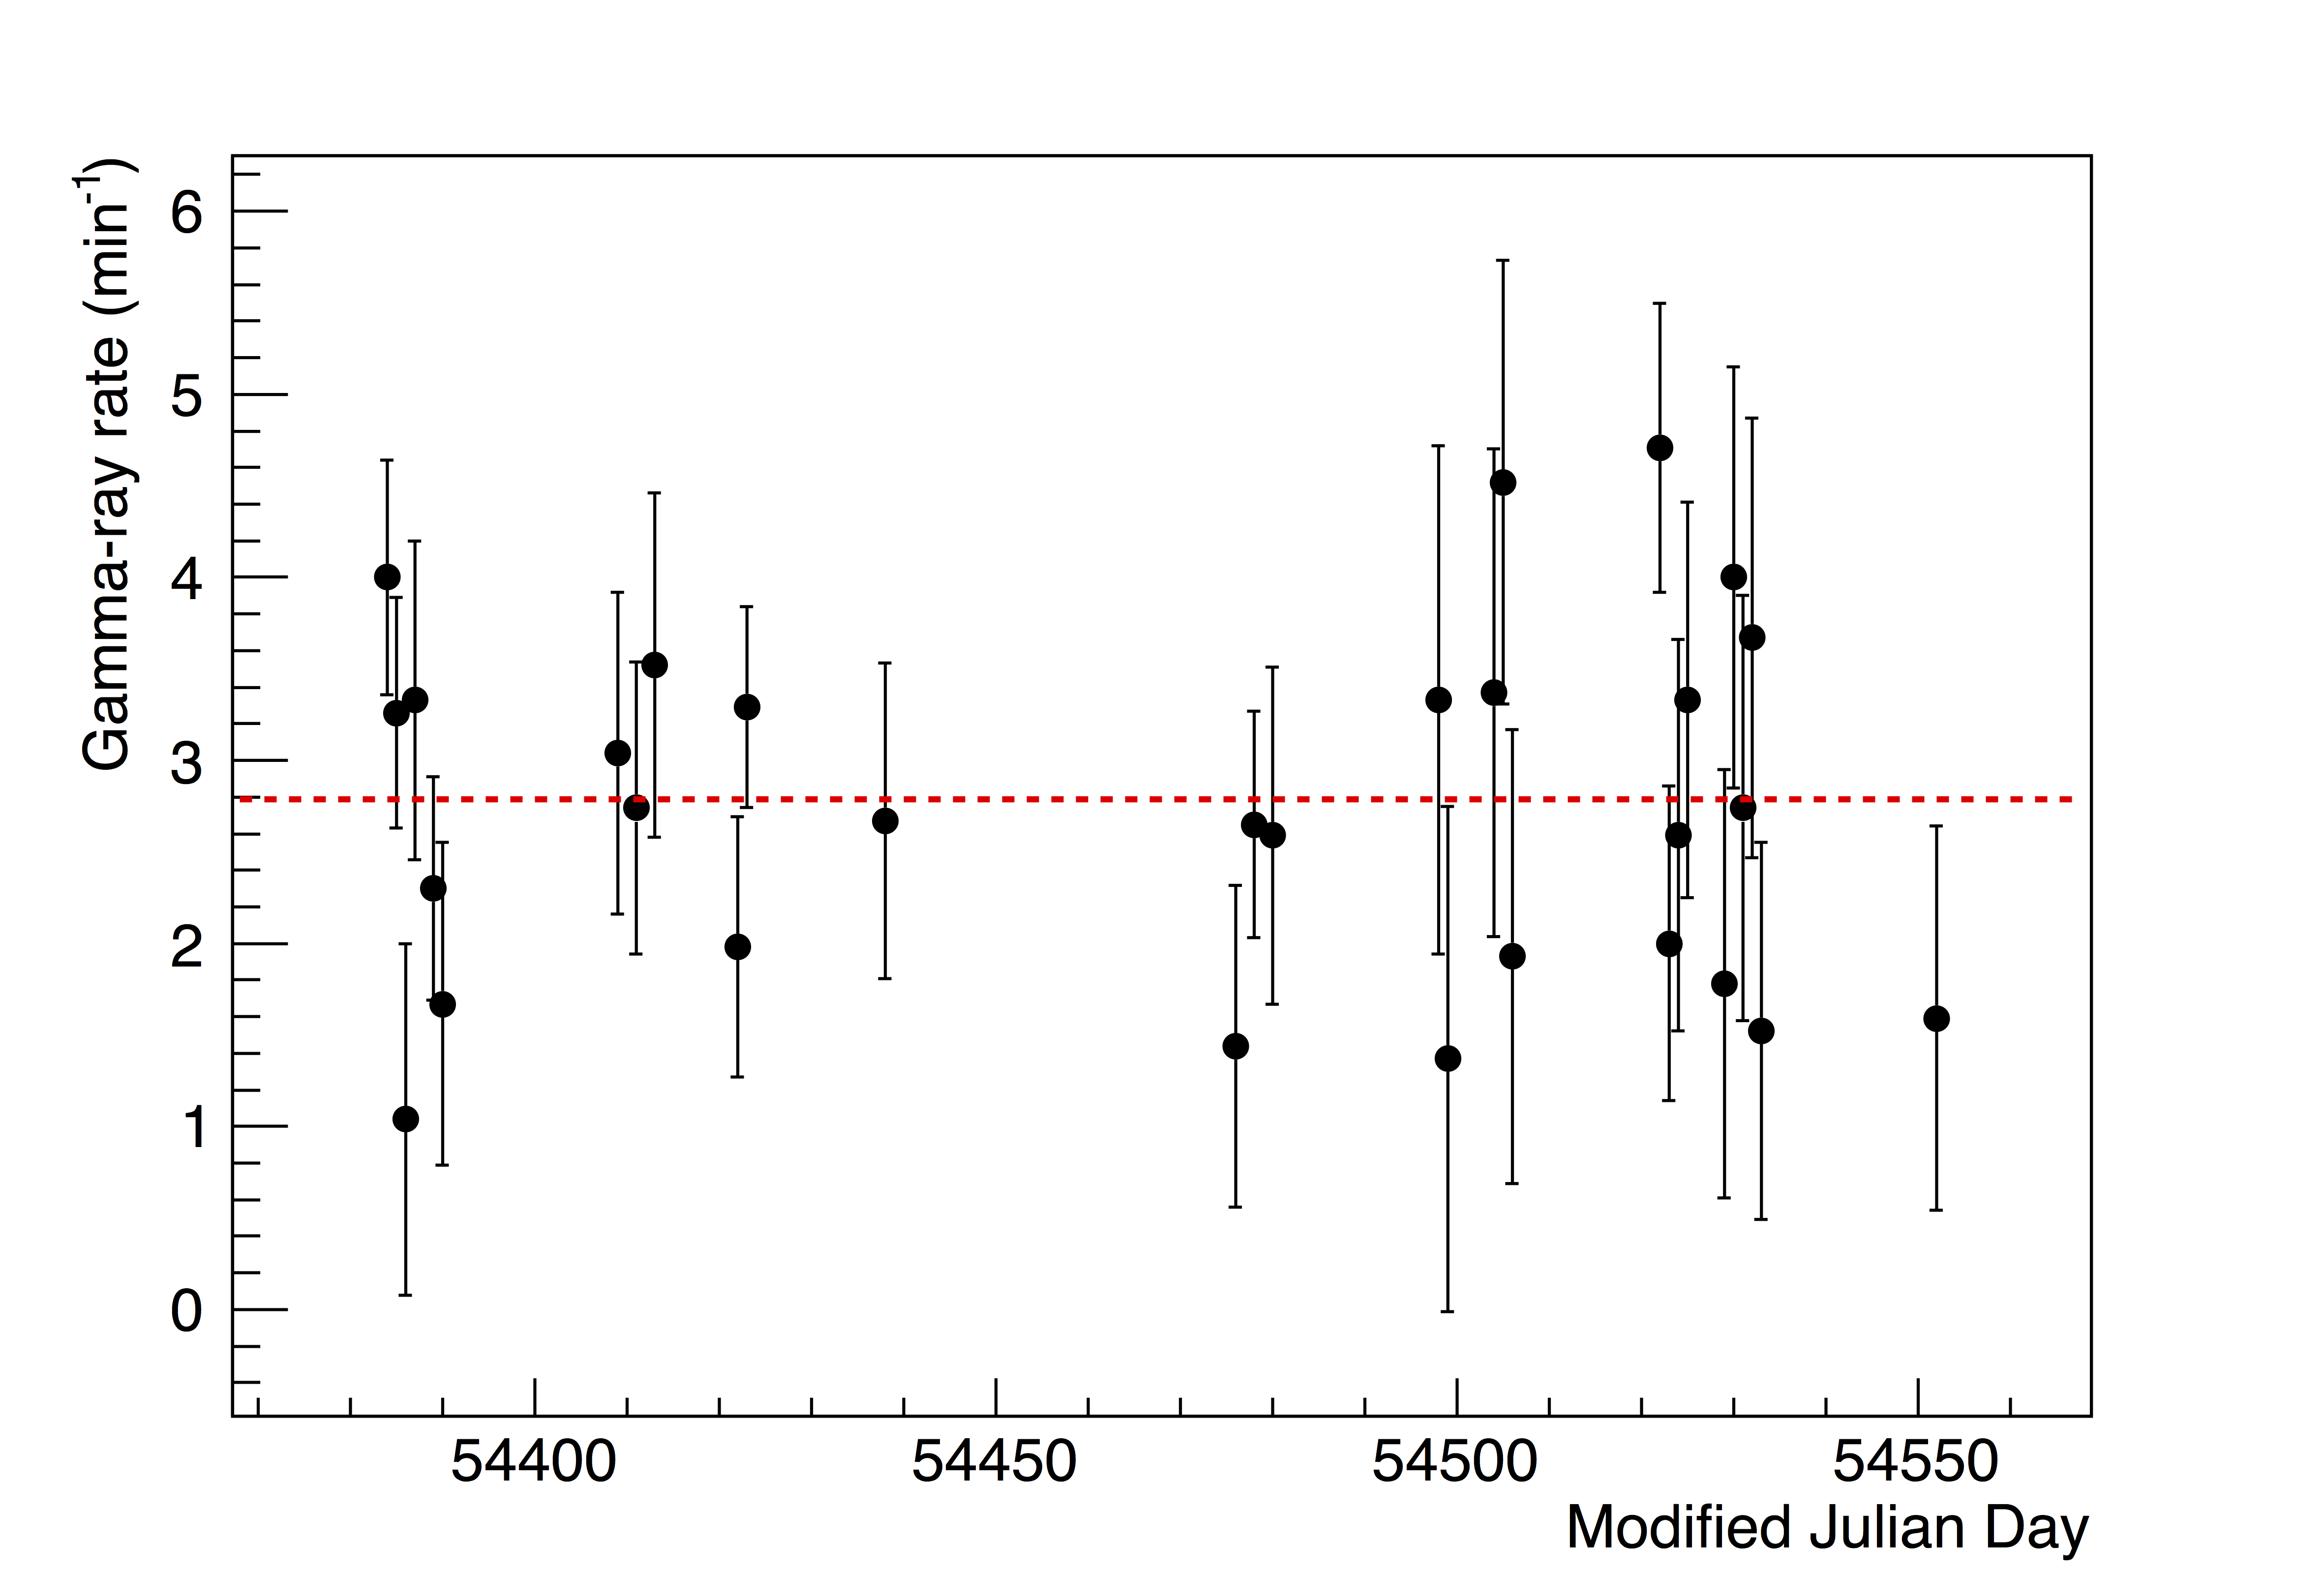
Figure 1: Nightly gamma-ray rate from the Crab Nebula from October 2007 to March 2008 at energies E > 400 GeV. The mean rate for the season is represented by the dashed line. The Χ2 value is 31.6 for 29 degrees of freedom, giving a probability of 34% that the rate is constant.
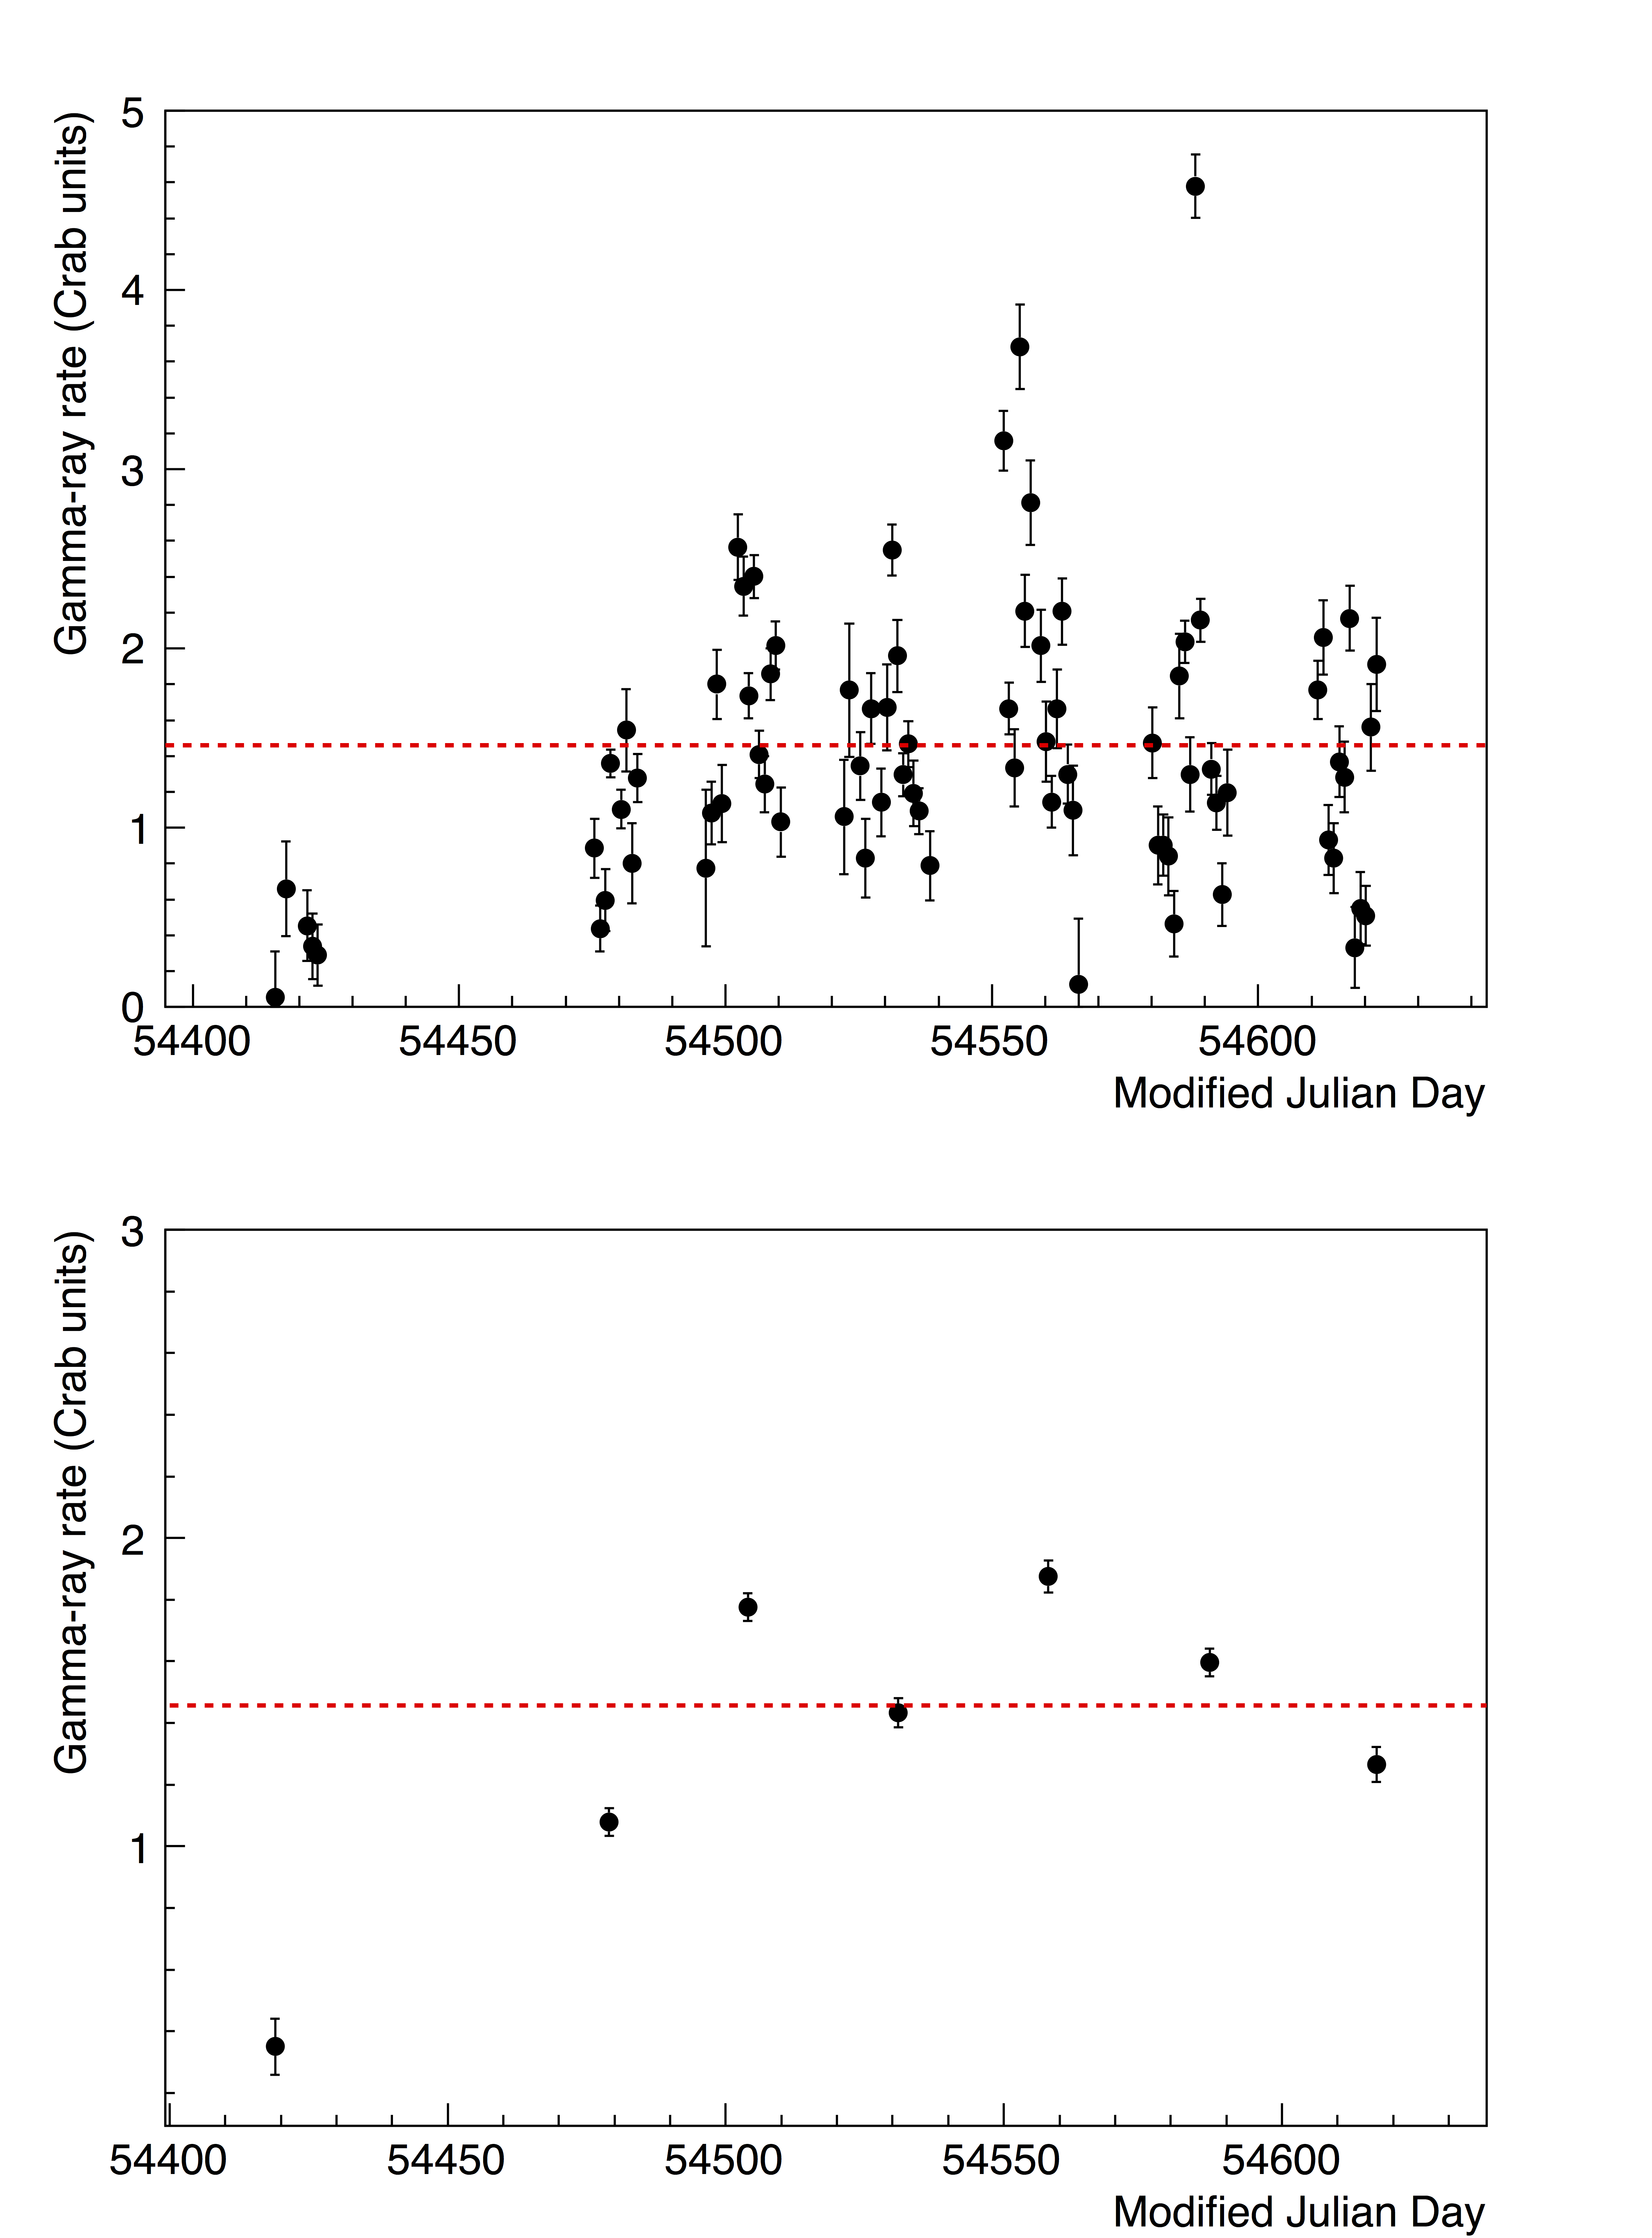
Figure 2: The gamma-ray light curve for Mrk421 at energies E > 400 GeV for the 2007–2008 observing season. Top: daily gamma-ray rate; bottom: monthly gamma-ray rate.
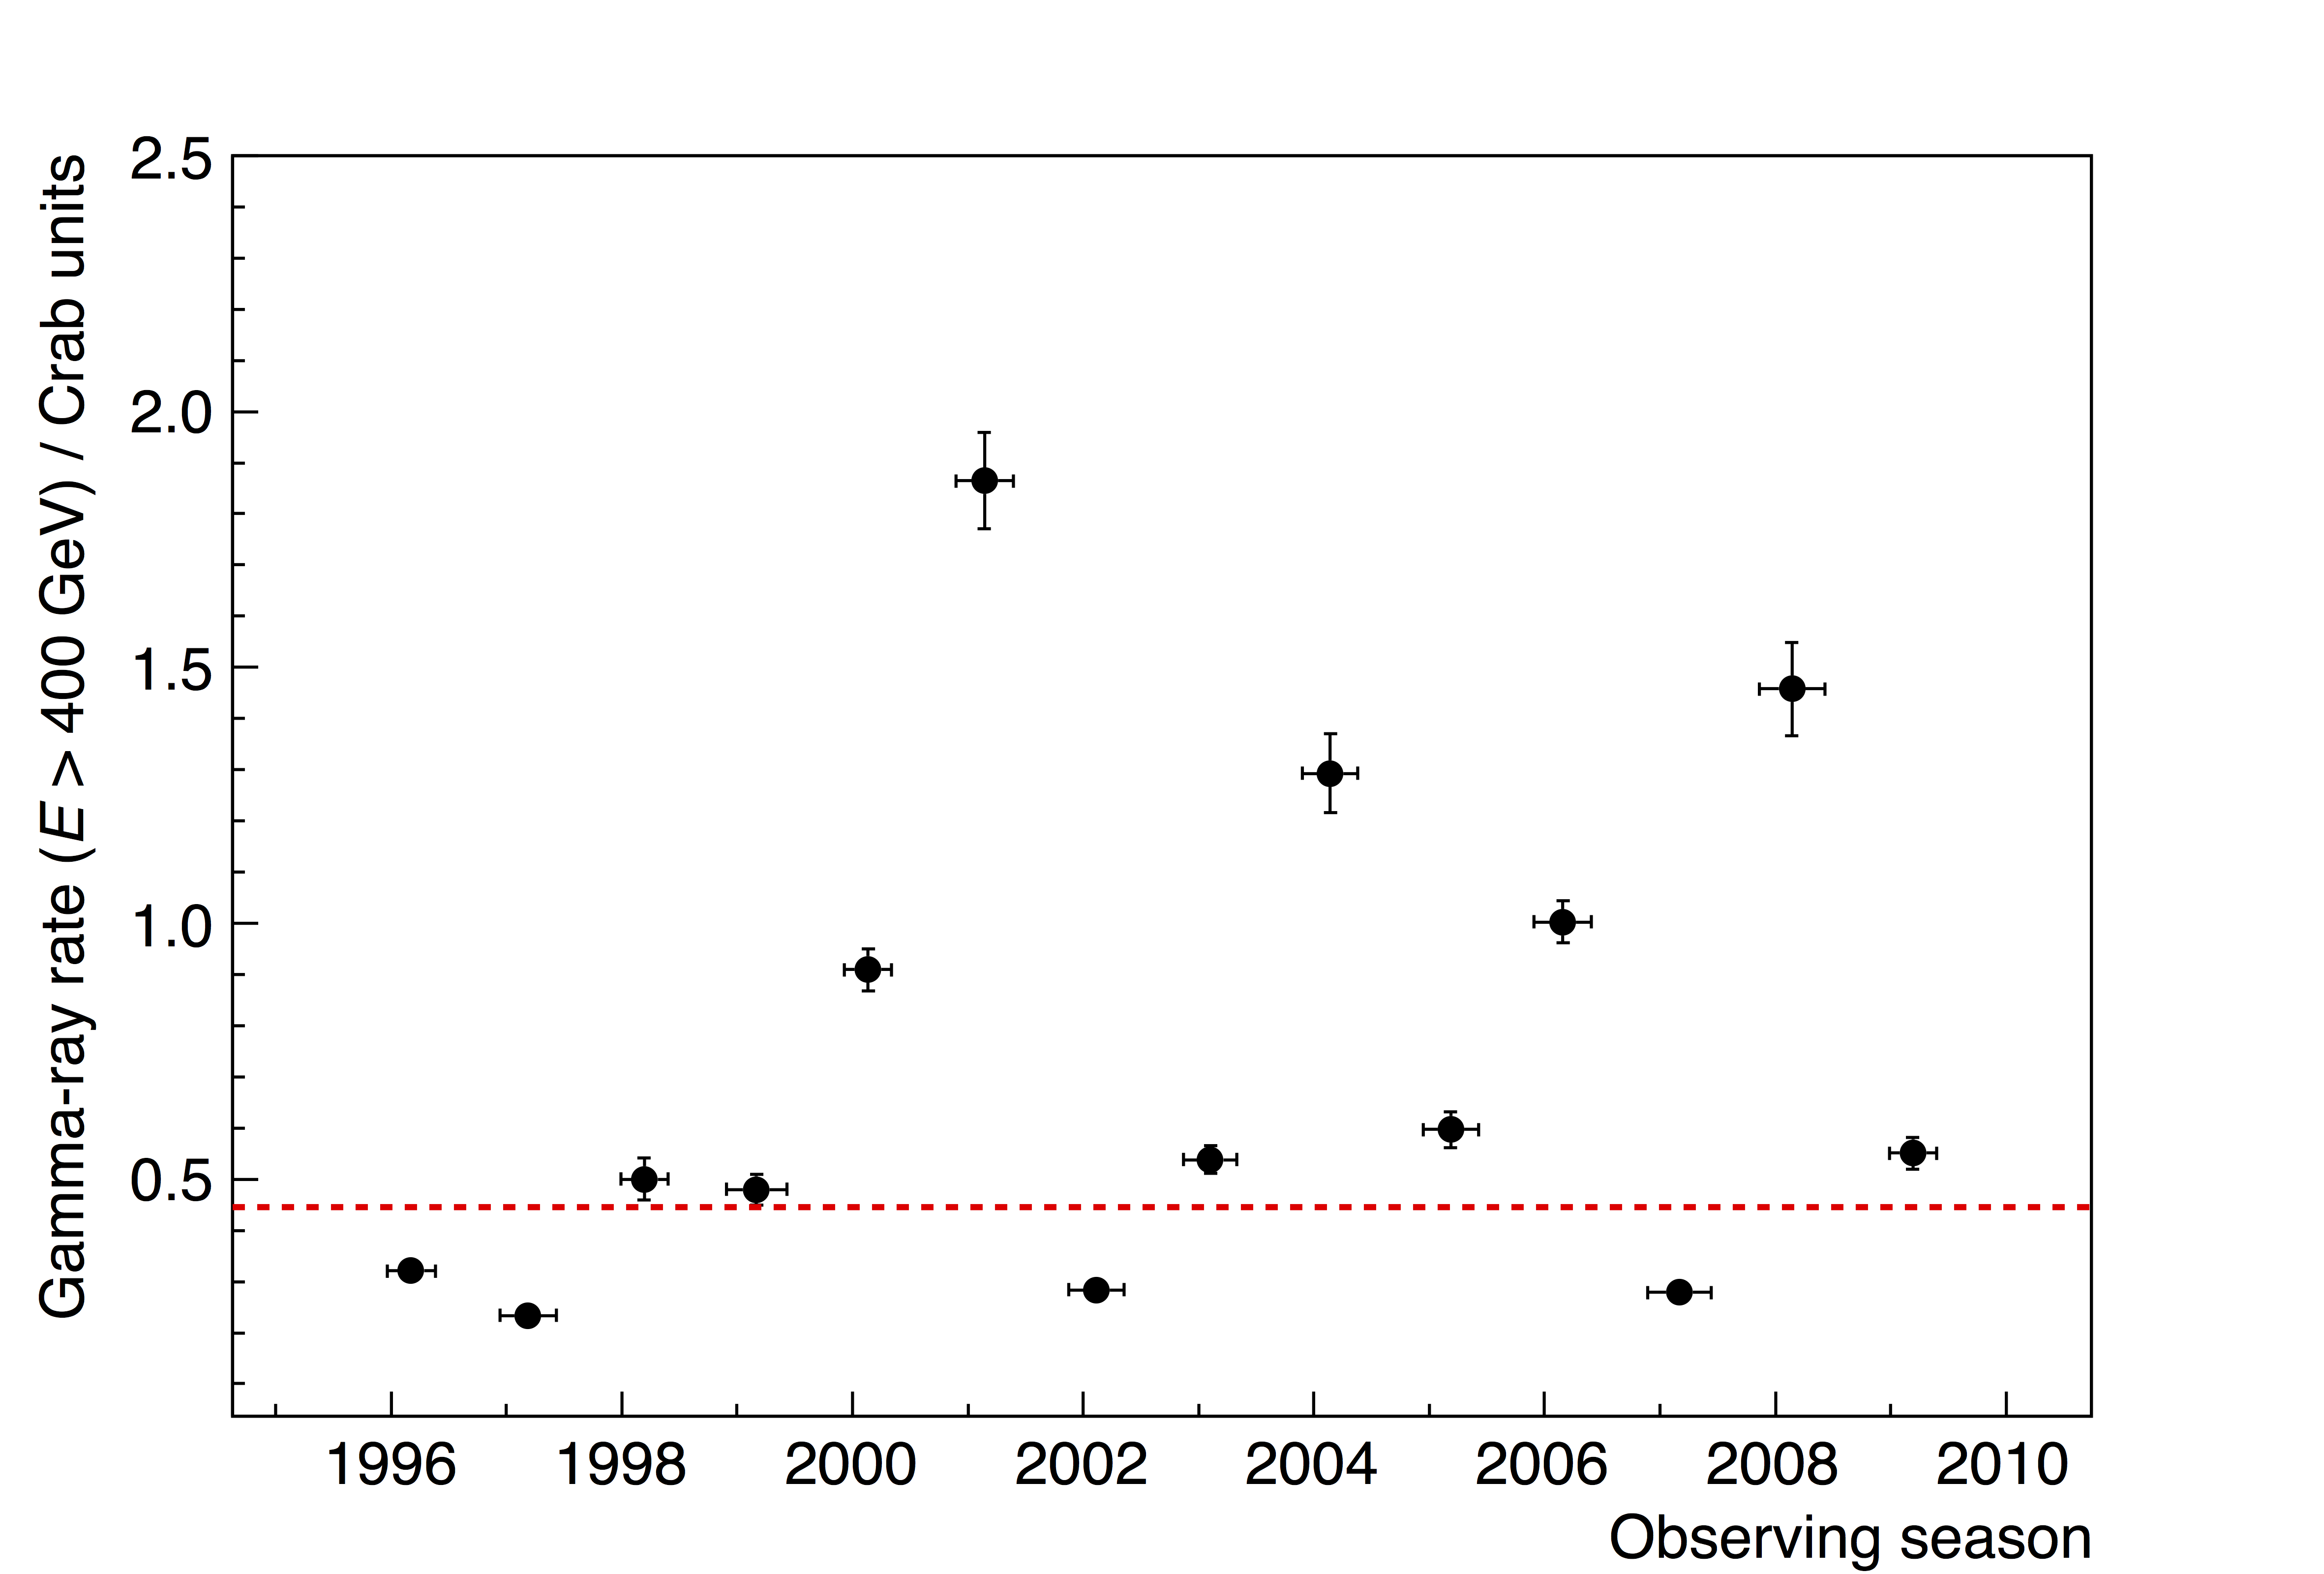
Figure 3: The gamma-ray light curve for Mrk421 at energies E > 400 GeV from 1995 to 2009, showing the mean rate for each observing season; the horizontal bar on each point indicates the duration of the observing season. The dashed line represents the mean gamma-ray rate (0.446 ± 0.008 Crab units) for the entire 14-year dataset.
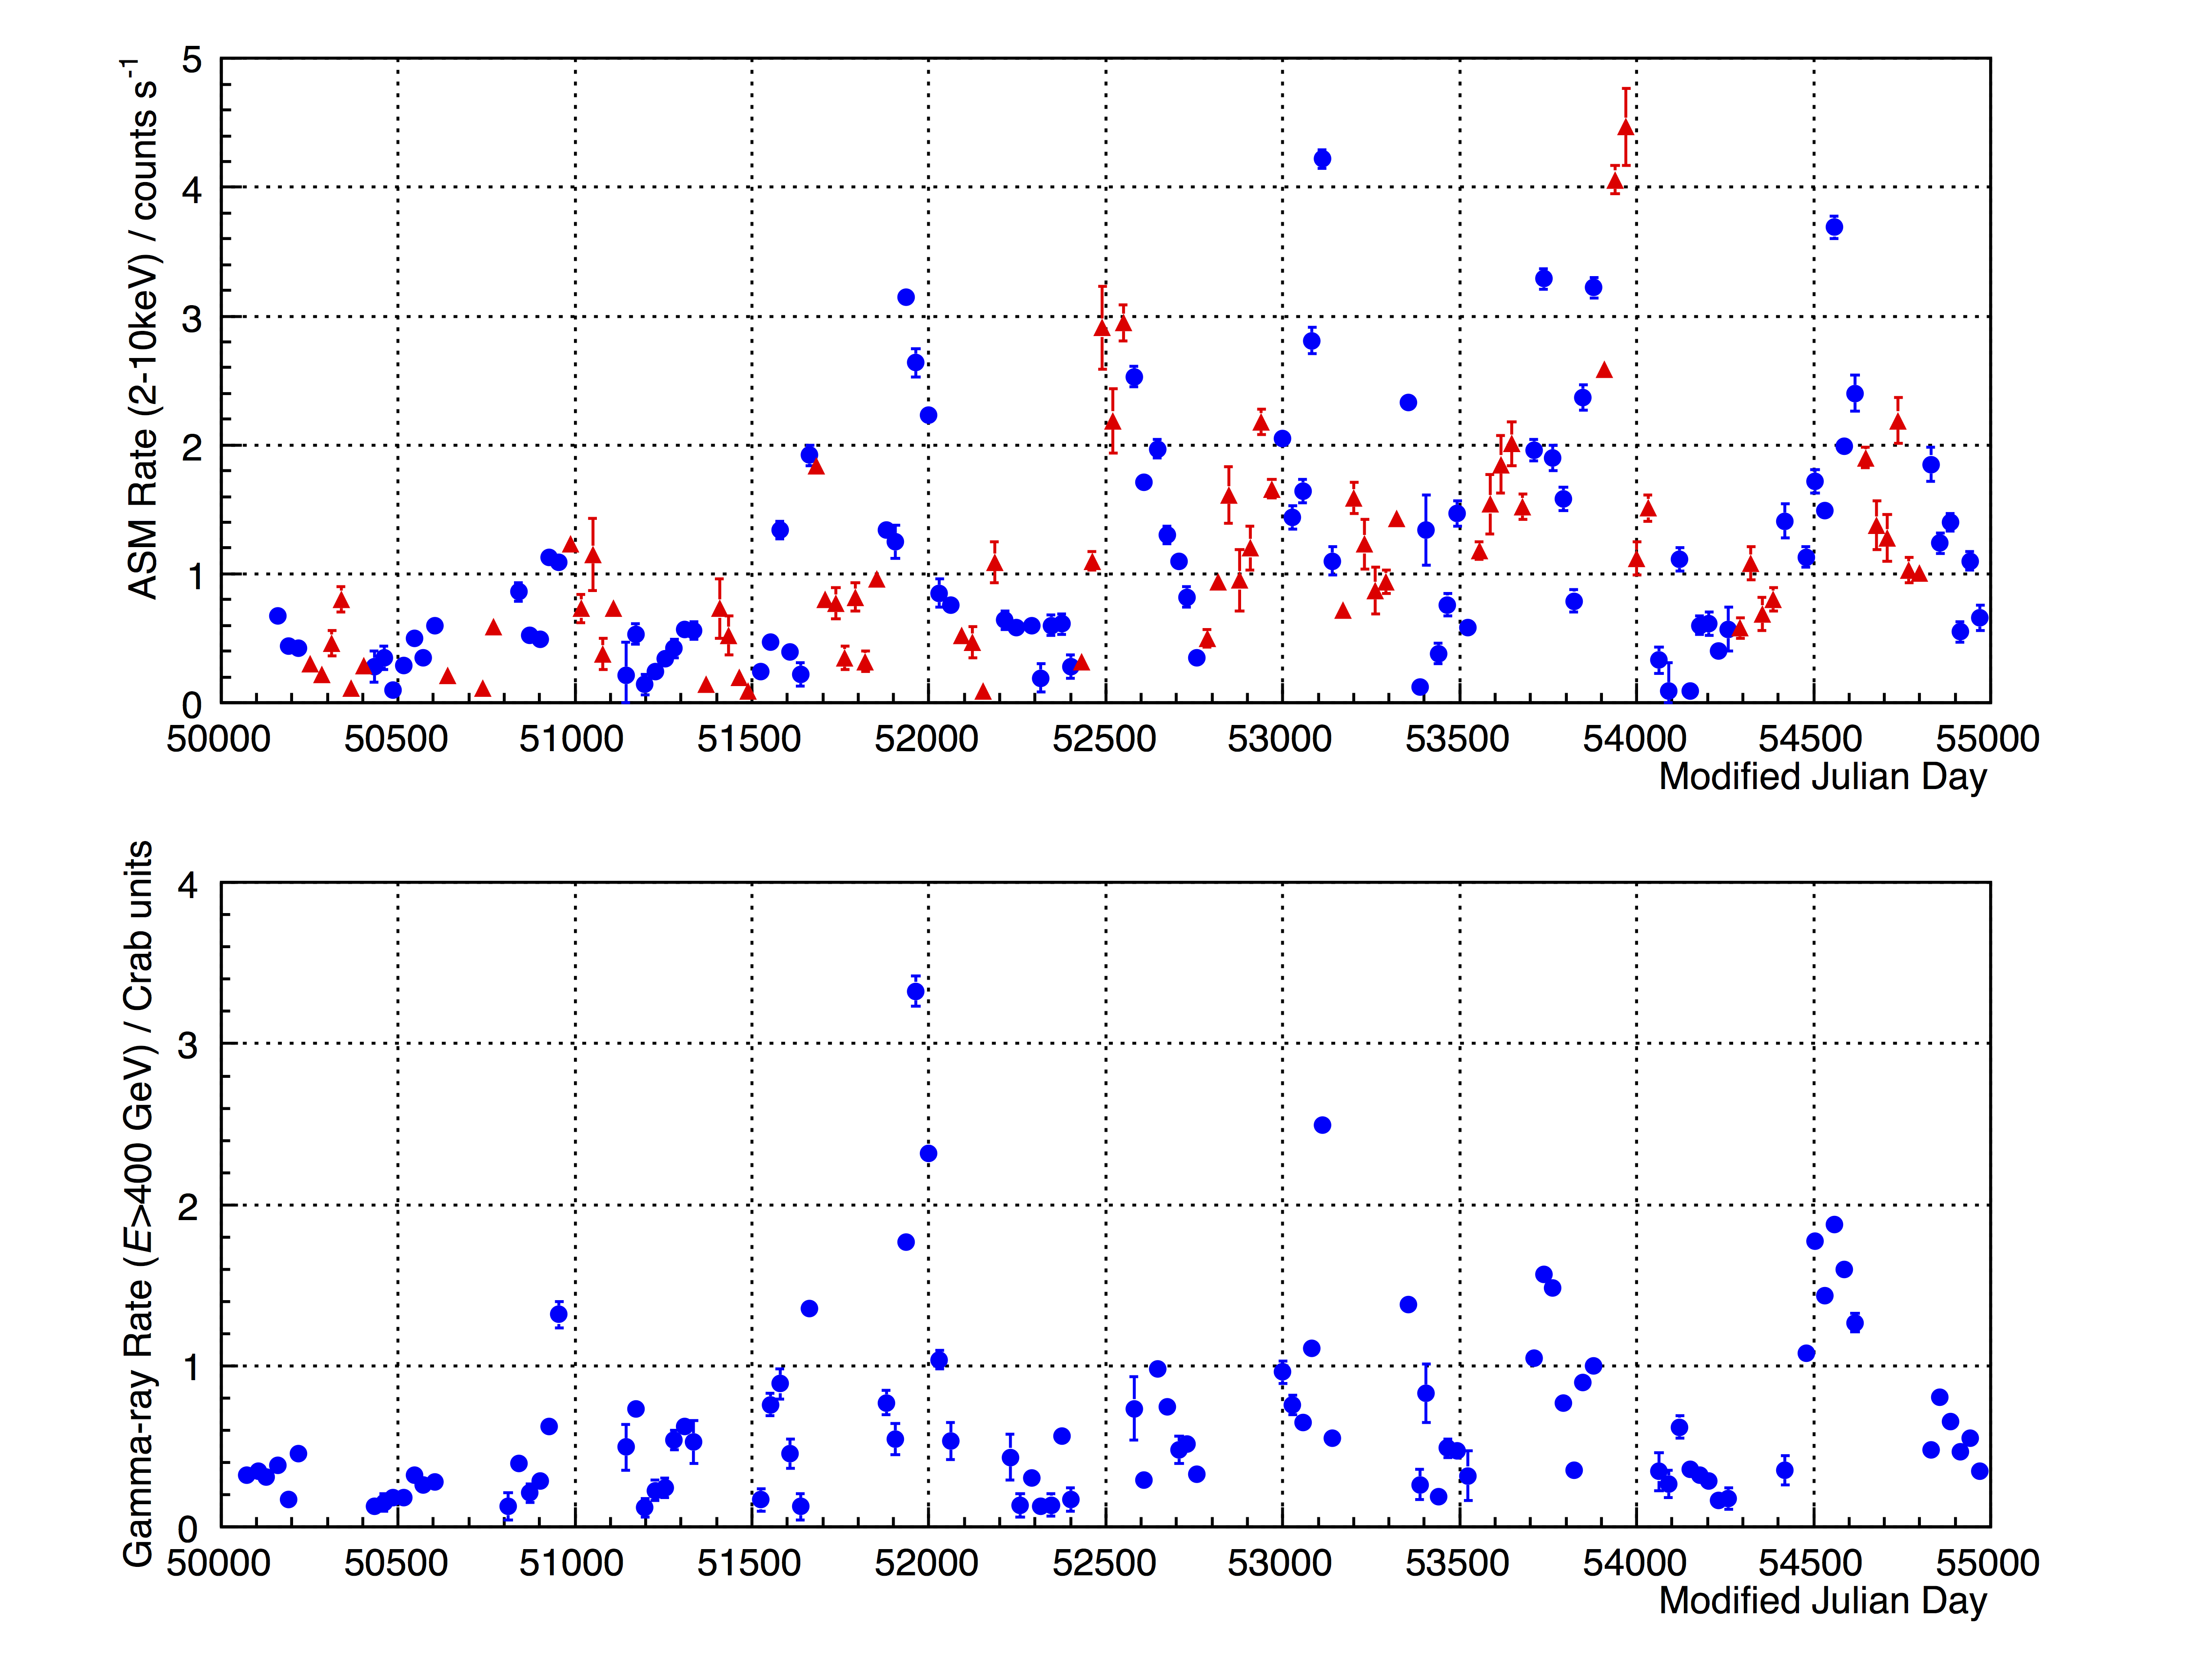
Figure 4: The monthly X-ray and gamma-ray light curves for Mrk421 (1995–2009). Top: RXTE ASM (2–10 keV); bottom: Whipple 10 m telescope (> 400 GeV). The RXTE data are shown as circles for periods during which Mrk421 was observable with the Whipple 10 m telescope (typically from November-December to May-June each season) and as triangles for intervals when it was not.
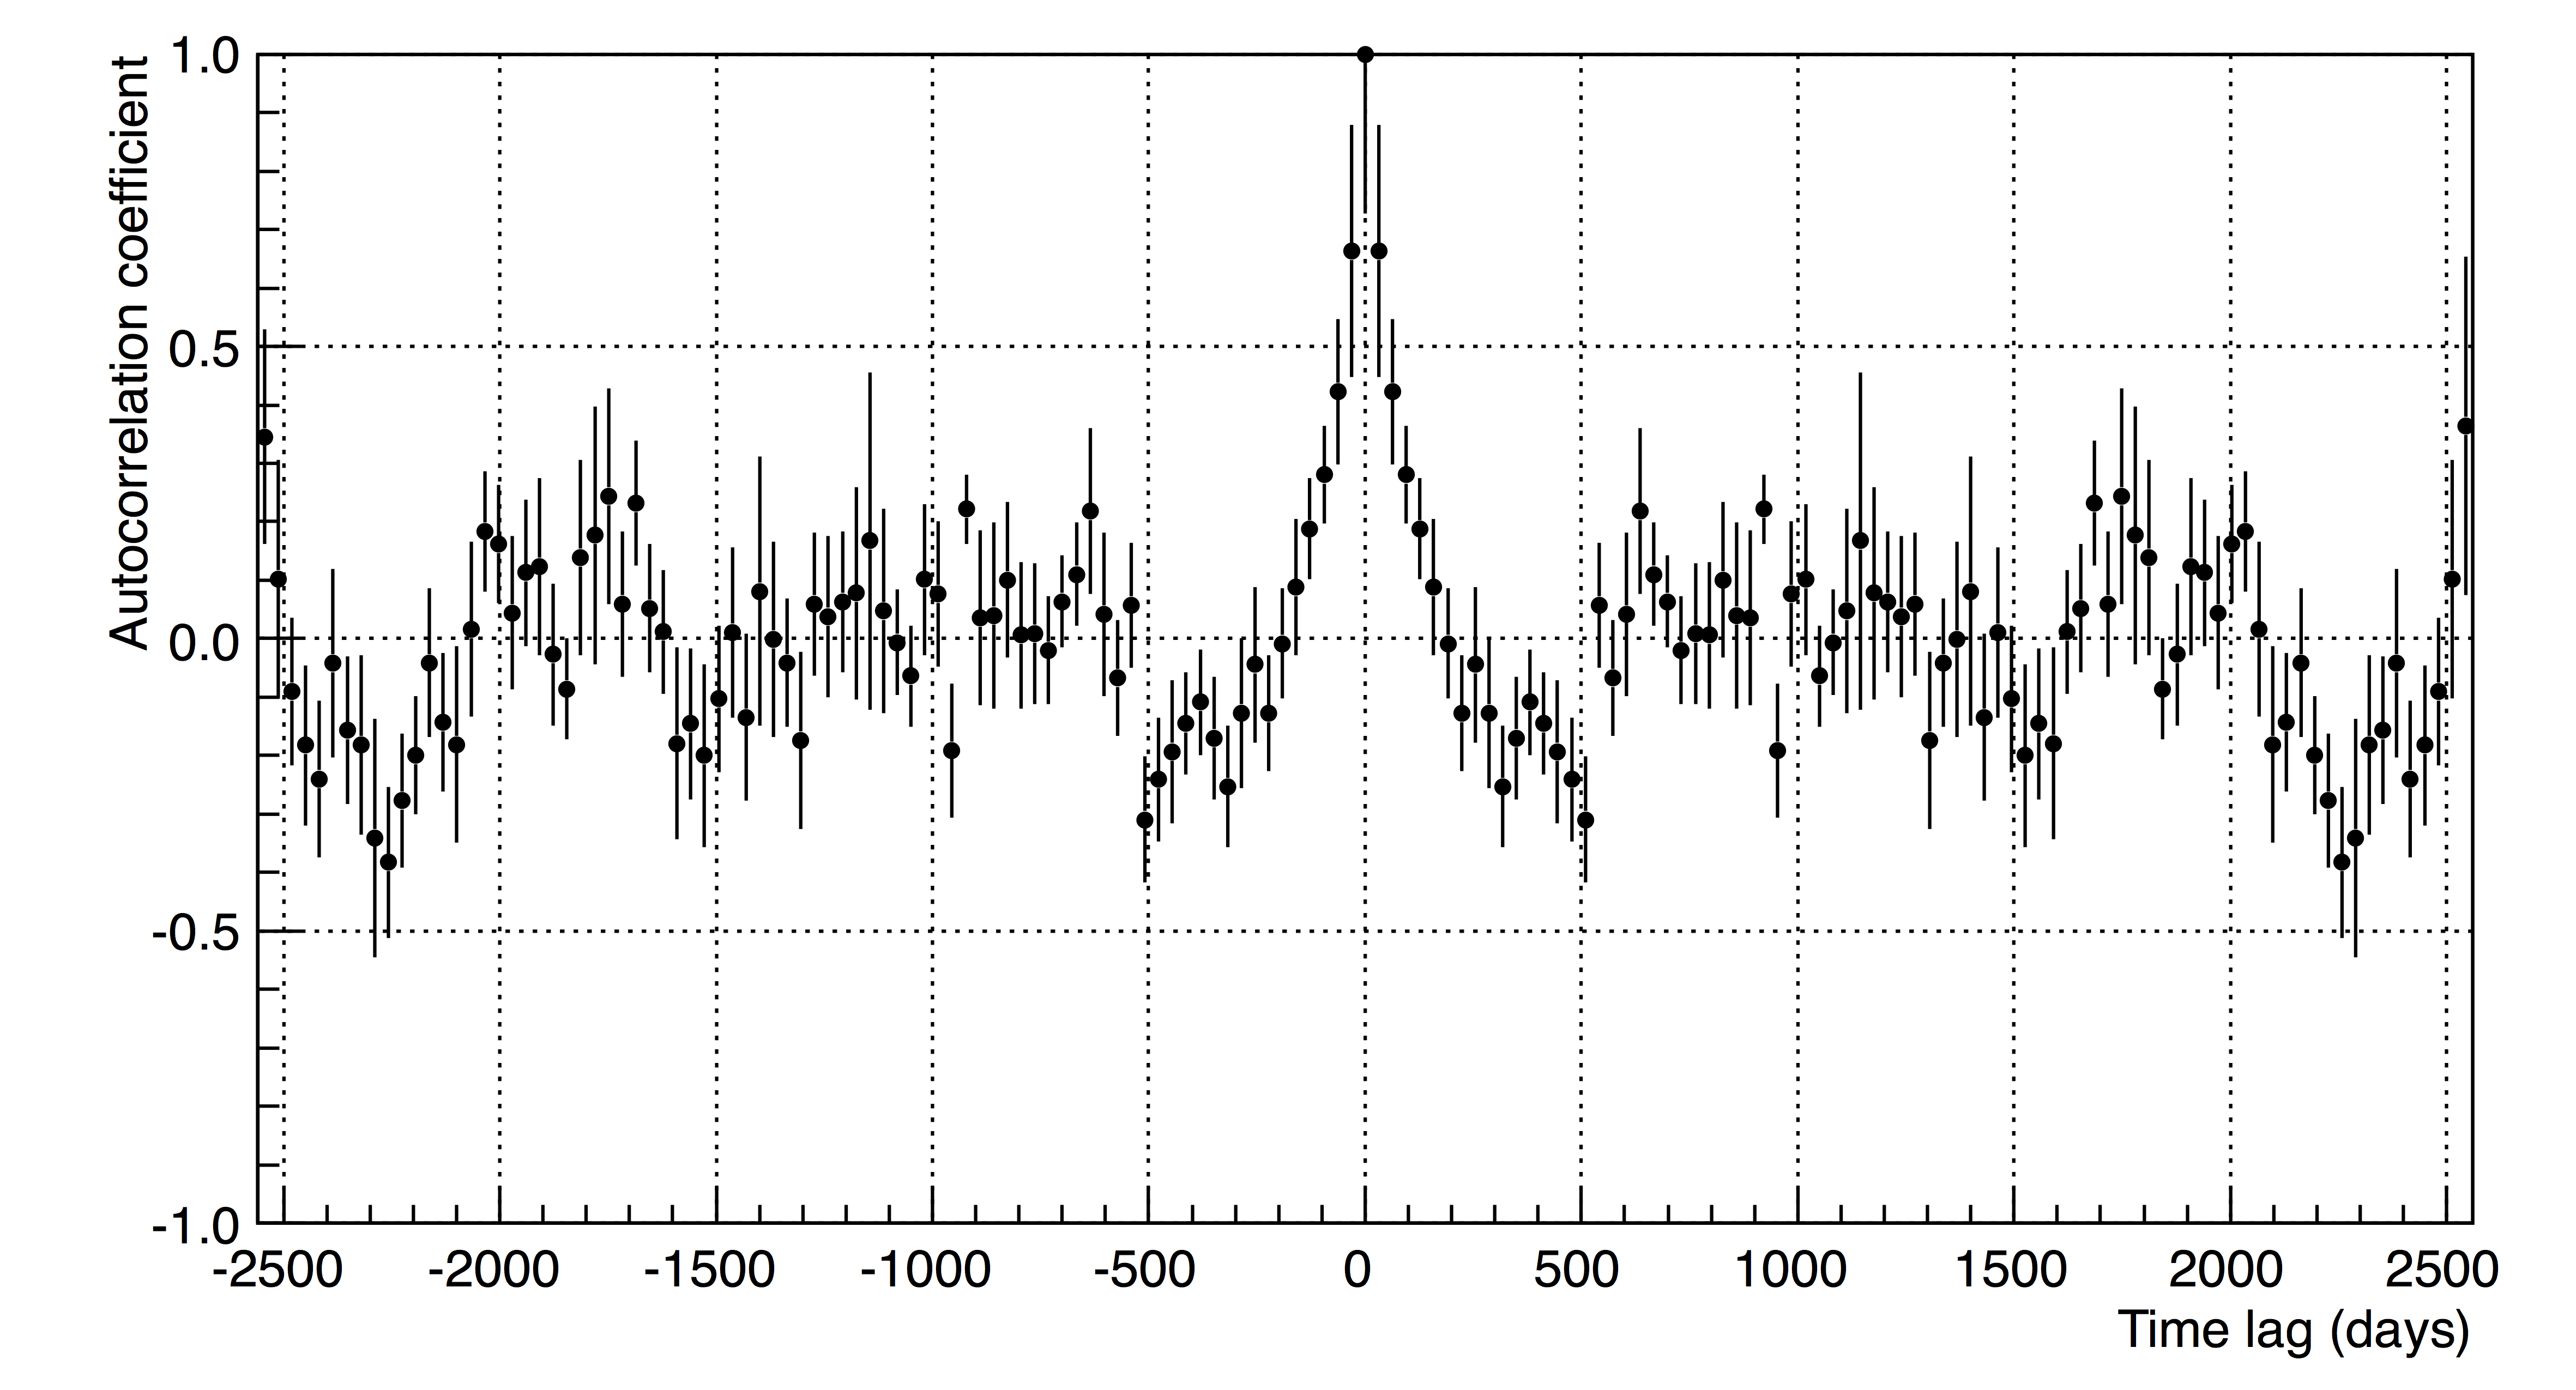
Figure 5: The discrete autocorrelation function for the monthly-binned Mrk421 Whipple gamma-ray database.
Figure 6: Flux-flux correlation for the Whipple 10 m (> 400 GeV) and RXTE ASM (2–10 keV) Mrk421 data on two different timescales. The dashed lines are the best-fit straight lines. Top: monthly-binned gamma-ray and RXTE ASM data (the best-fit line has slope 1.63 and correlation coefficient R = 0.75); bottom: annual-binned gamma-ray and RXTE ASM data (slope 2.43, R = 0.89).
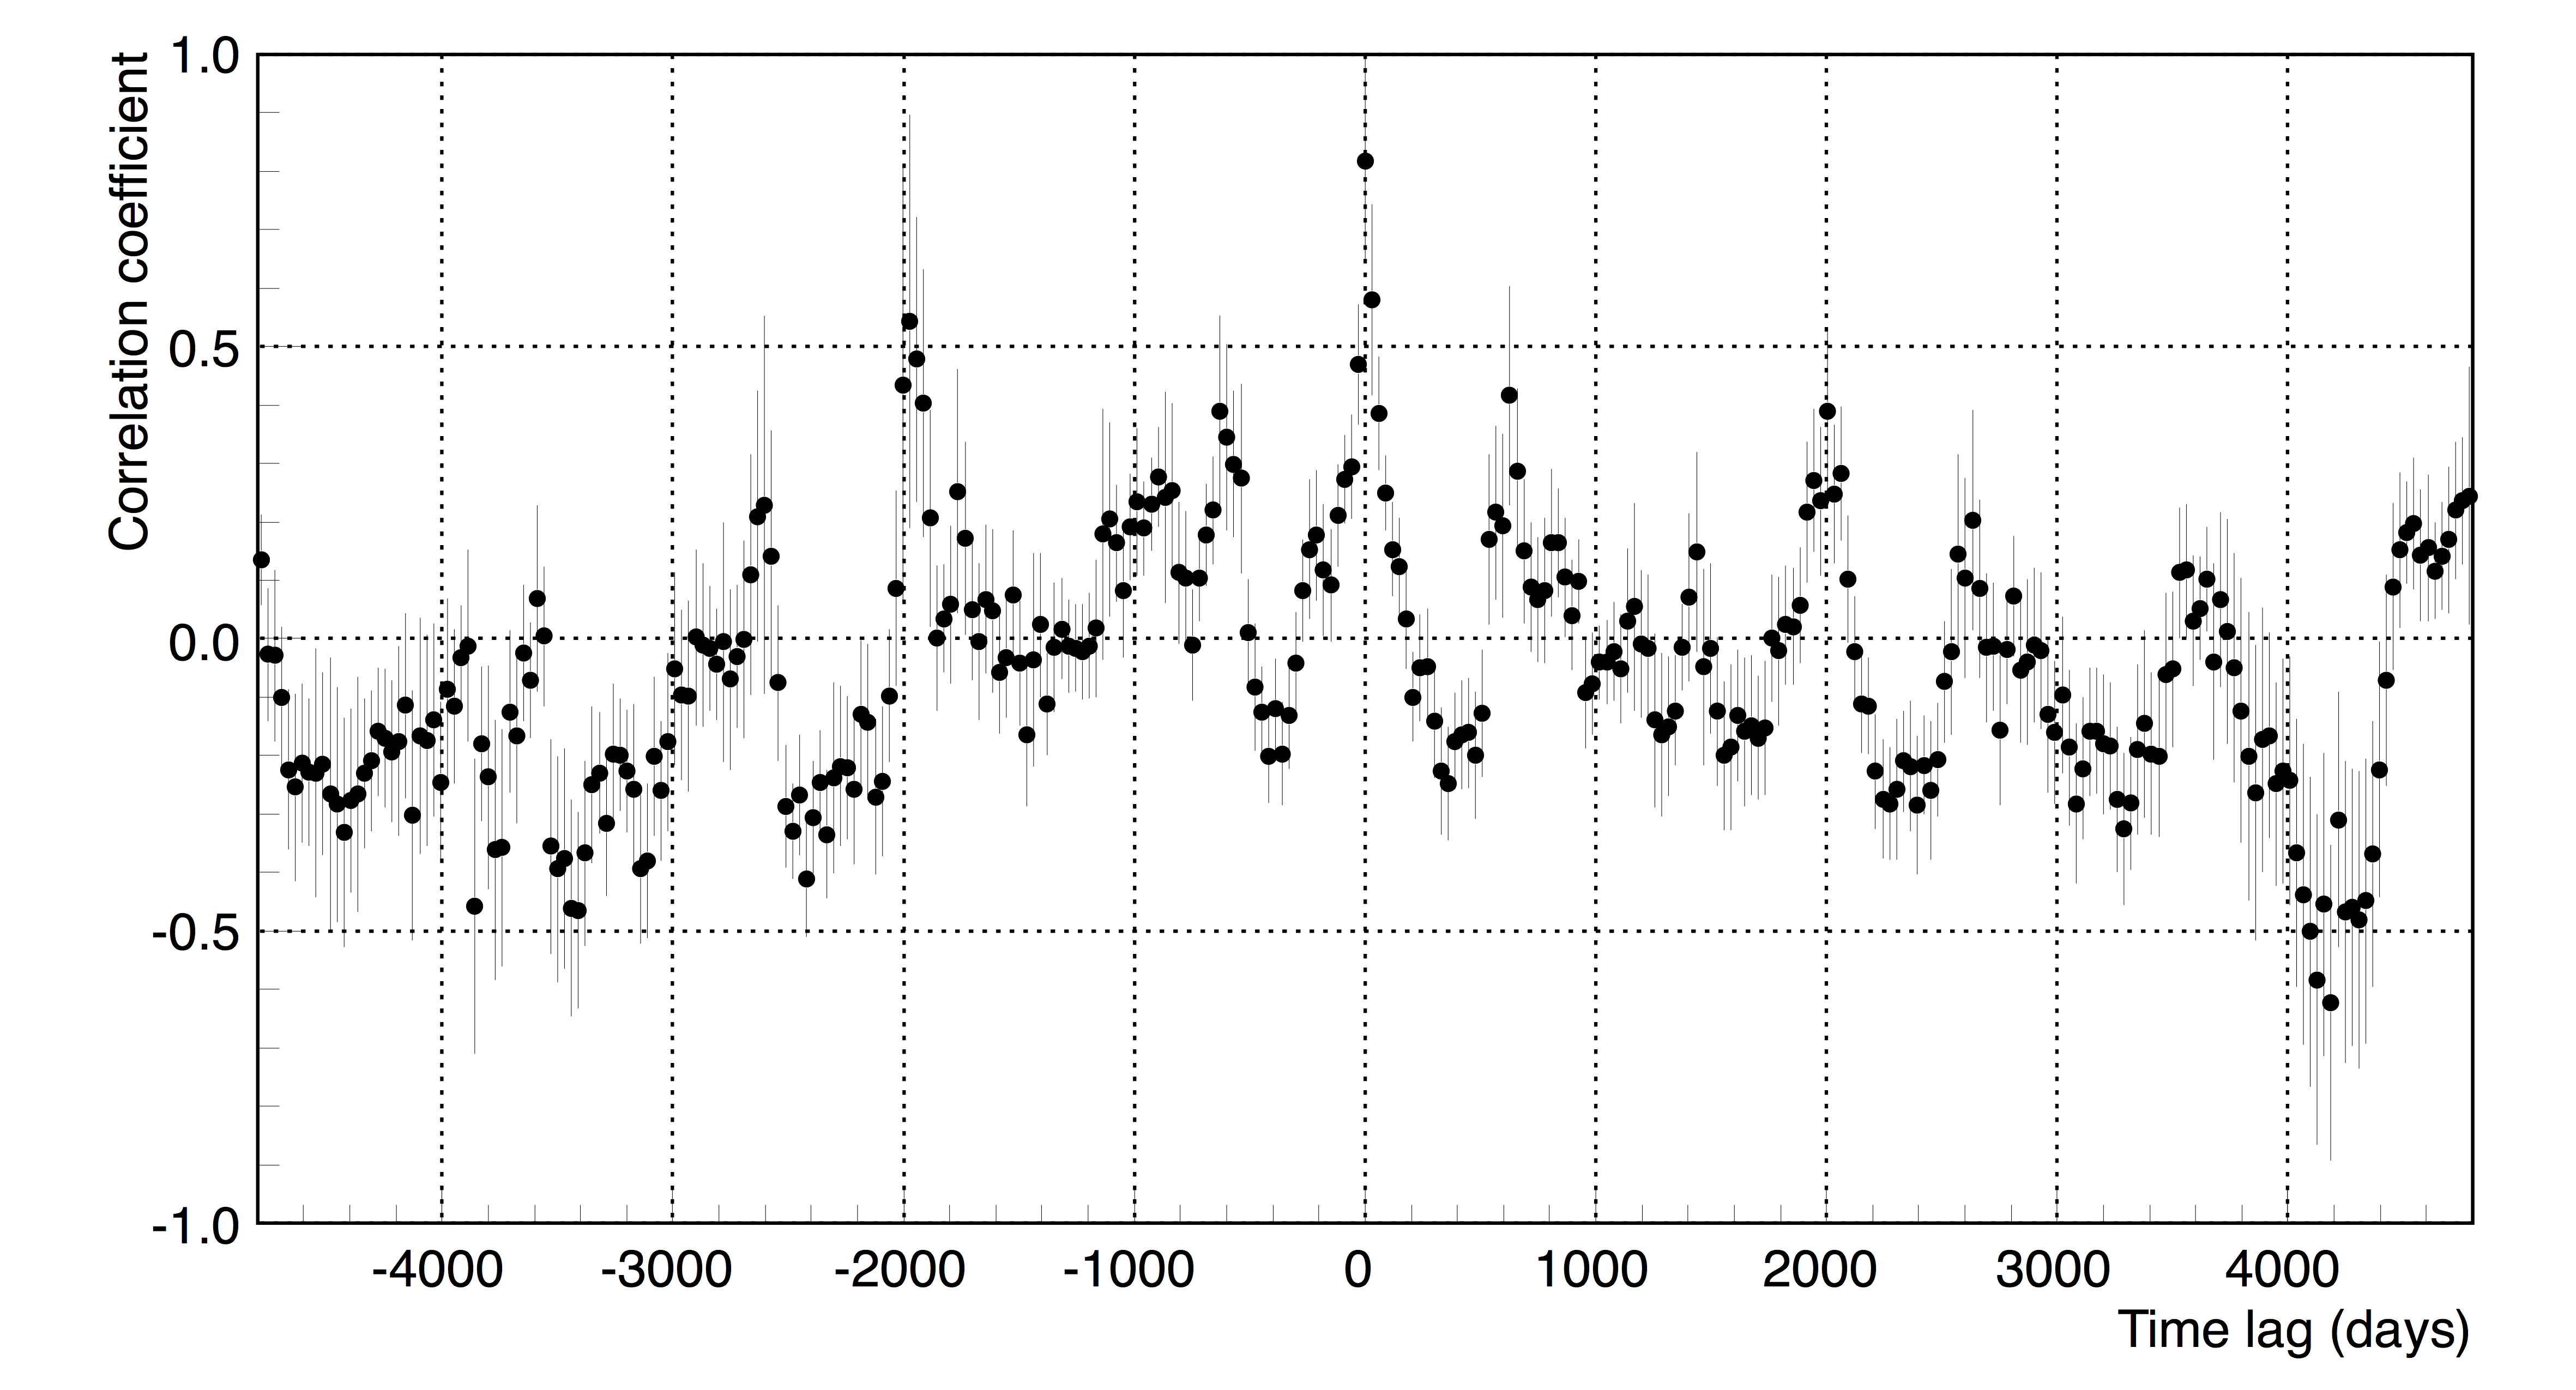
Figure 7: The discrete correlation function between Mrk421 X-ray (2–20 keV) and gamma-ray (> 400 GeV) light curves.
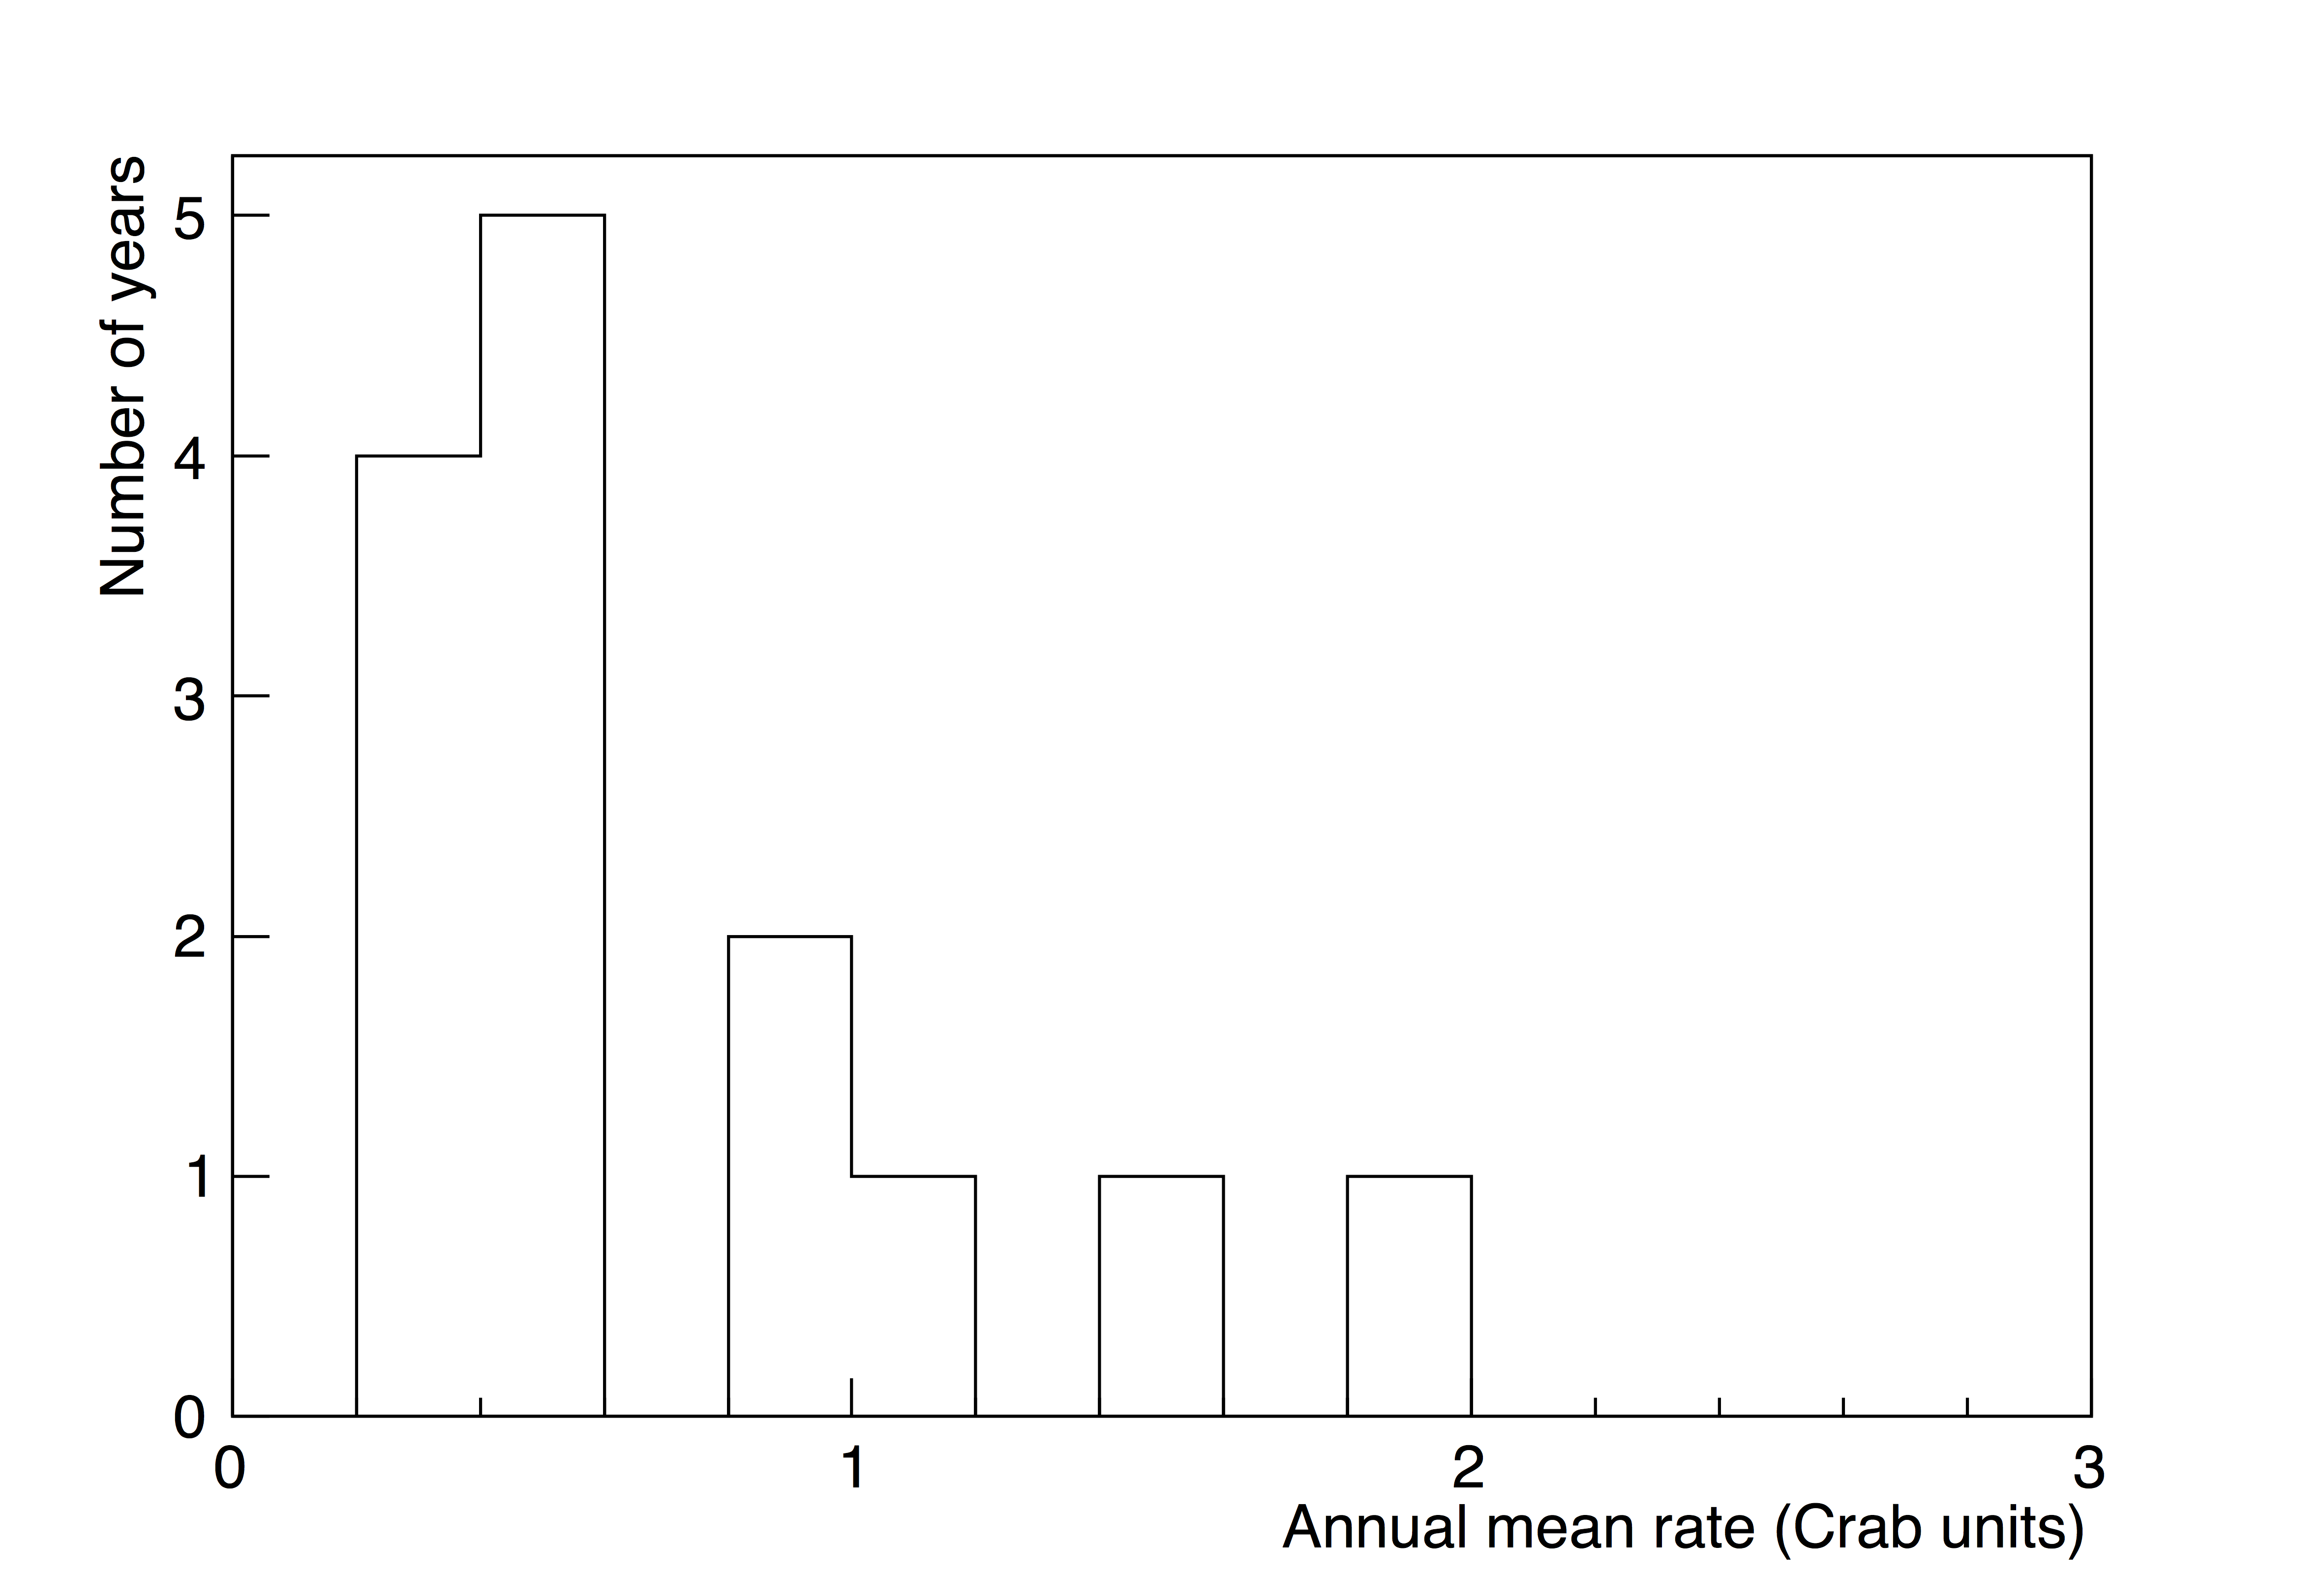
Figure 8: Distribution of the yearly-binned Mrk421 gamma-ray rate (E > 400 GeV) for 14 years of data (1995–2009).
Figure 9: Distribution of the monthly-binned Mrk421 gamma-ray rate (E > 400 GeV) for 95 months (darkruns), representing 14 years of data (1995–2009).
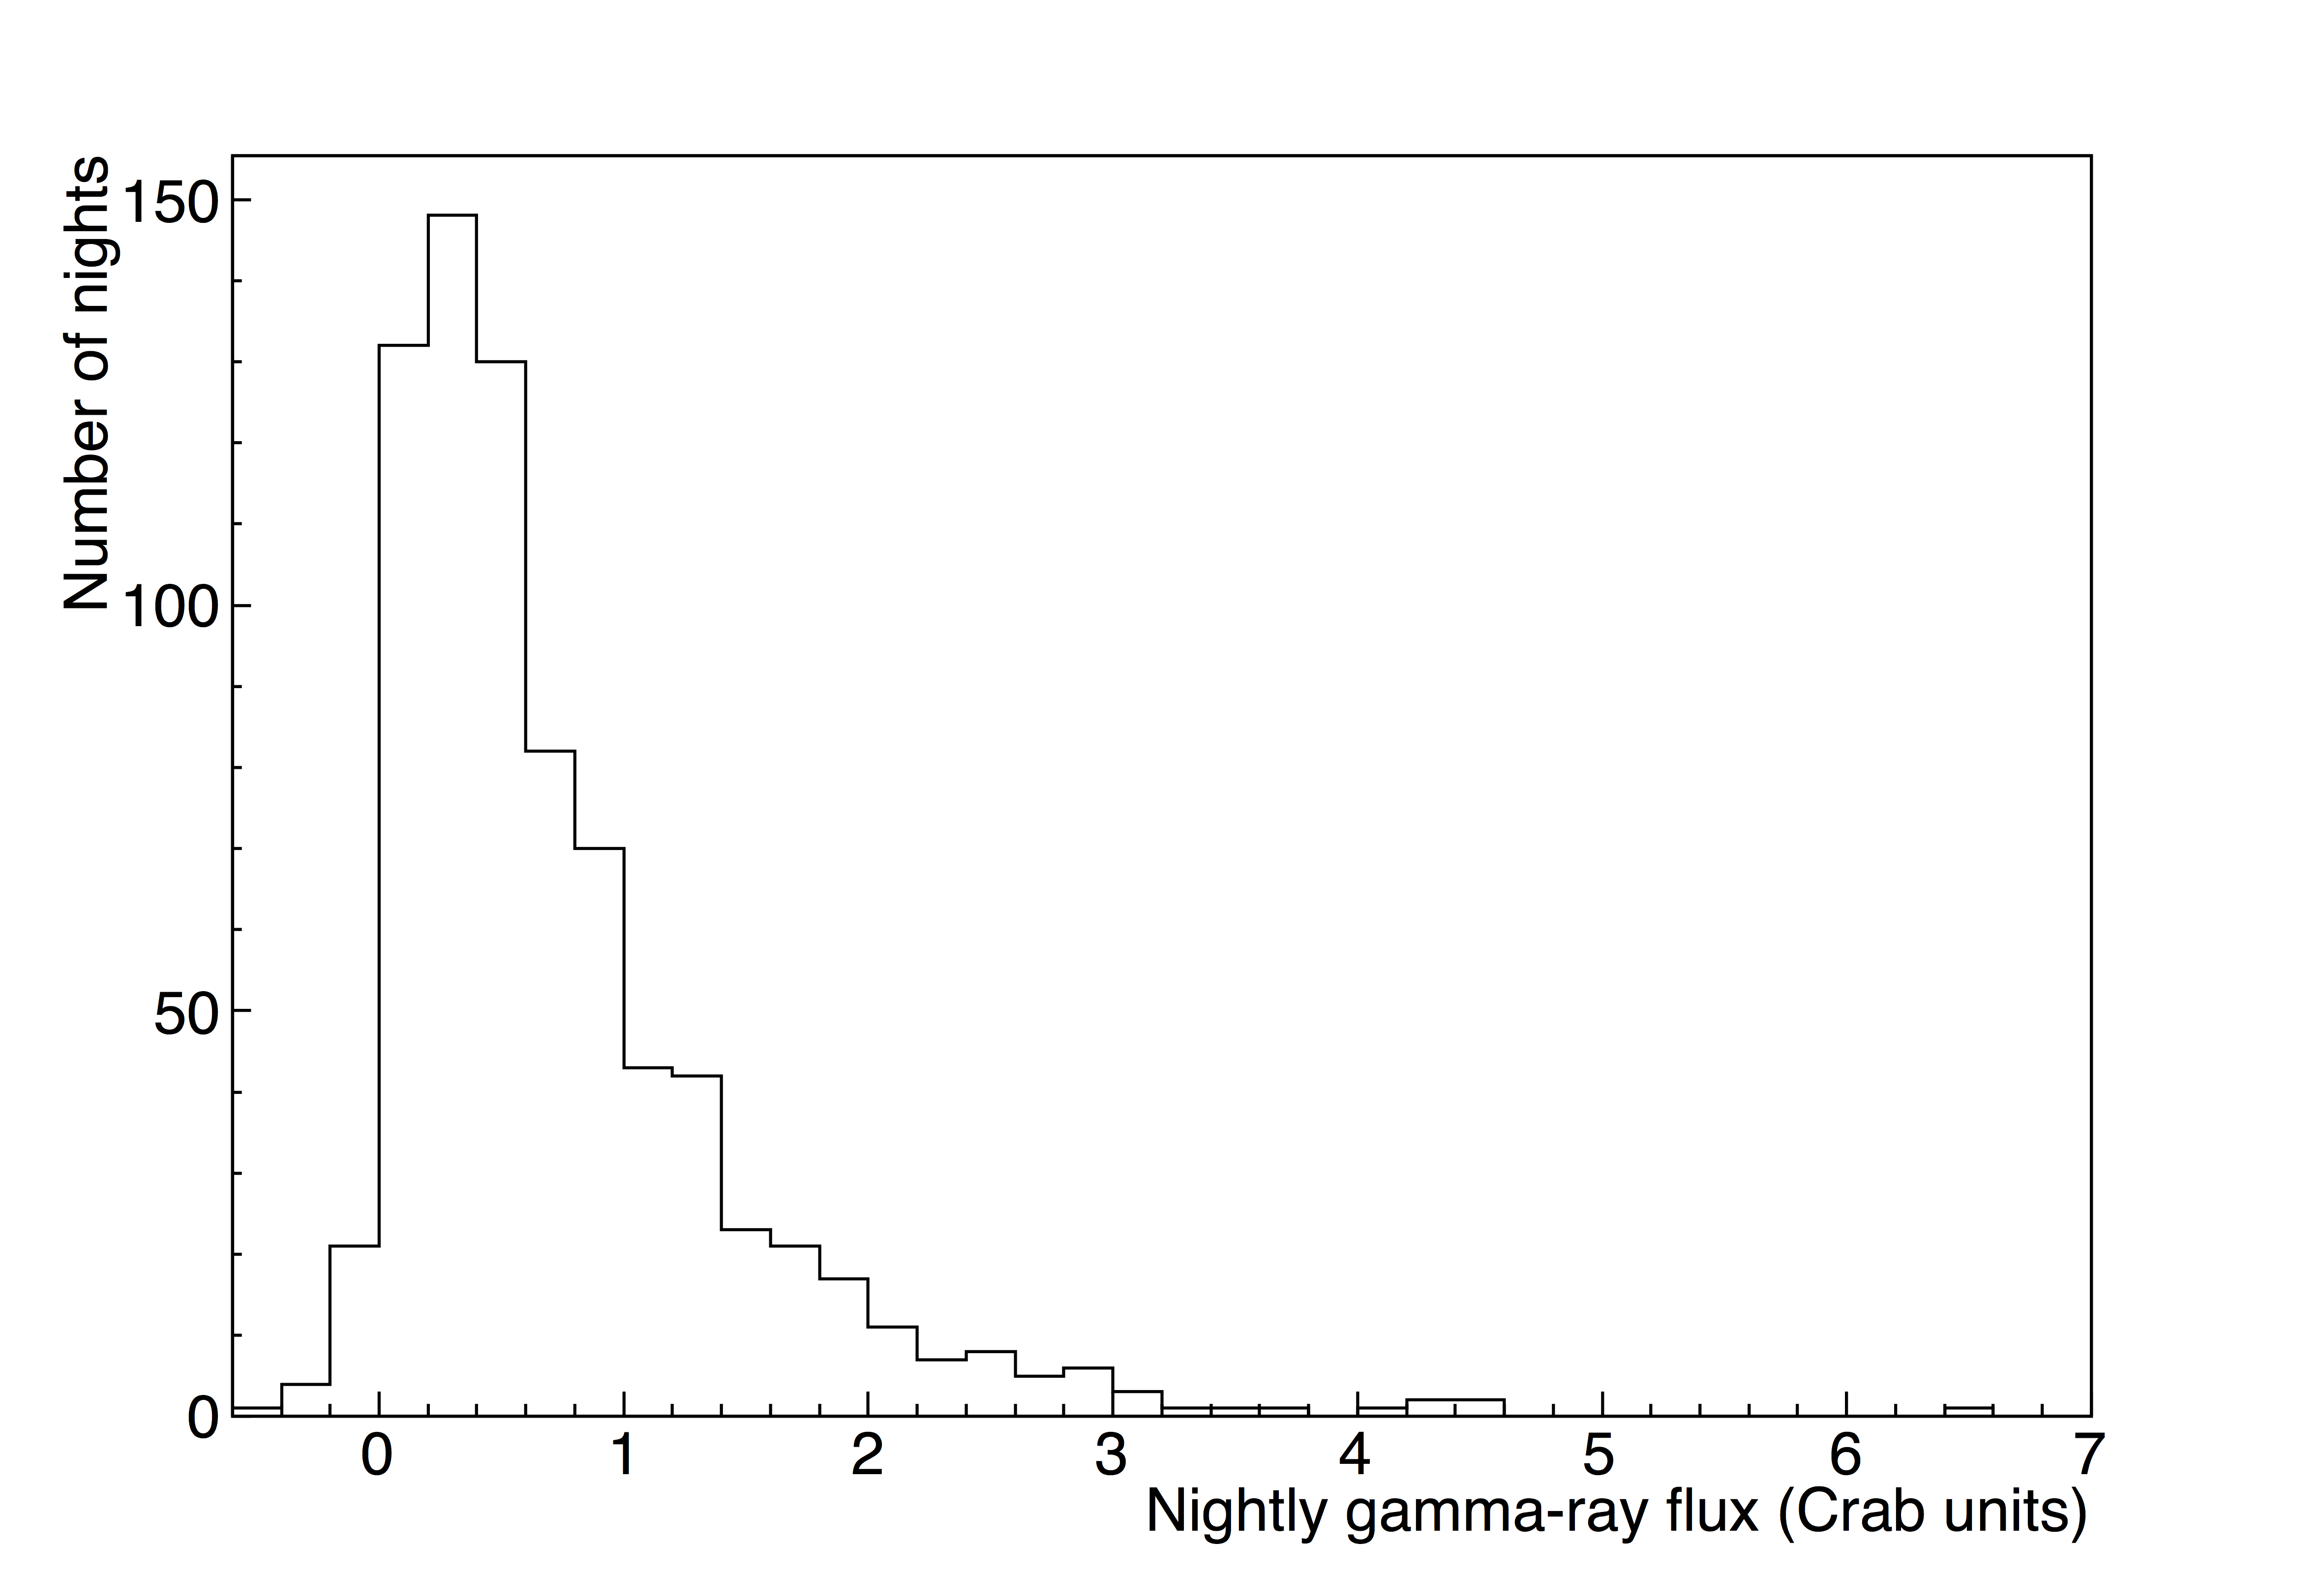
Figure 10: Distribution of the nightly-binned Mrk421 gamma-ray rate (E > 400 GeV) for 14 years of data (1995–2009), covering 783 nights.
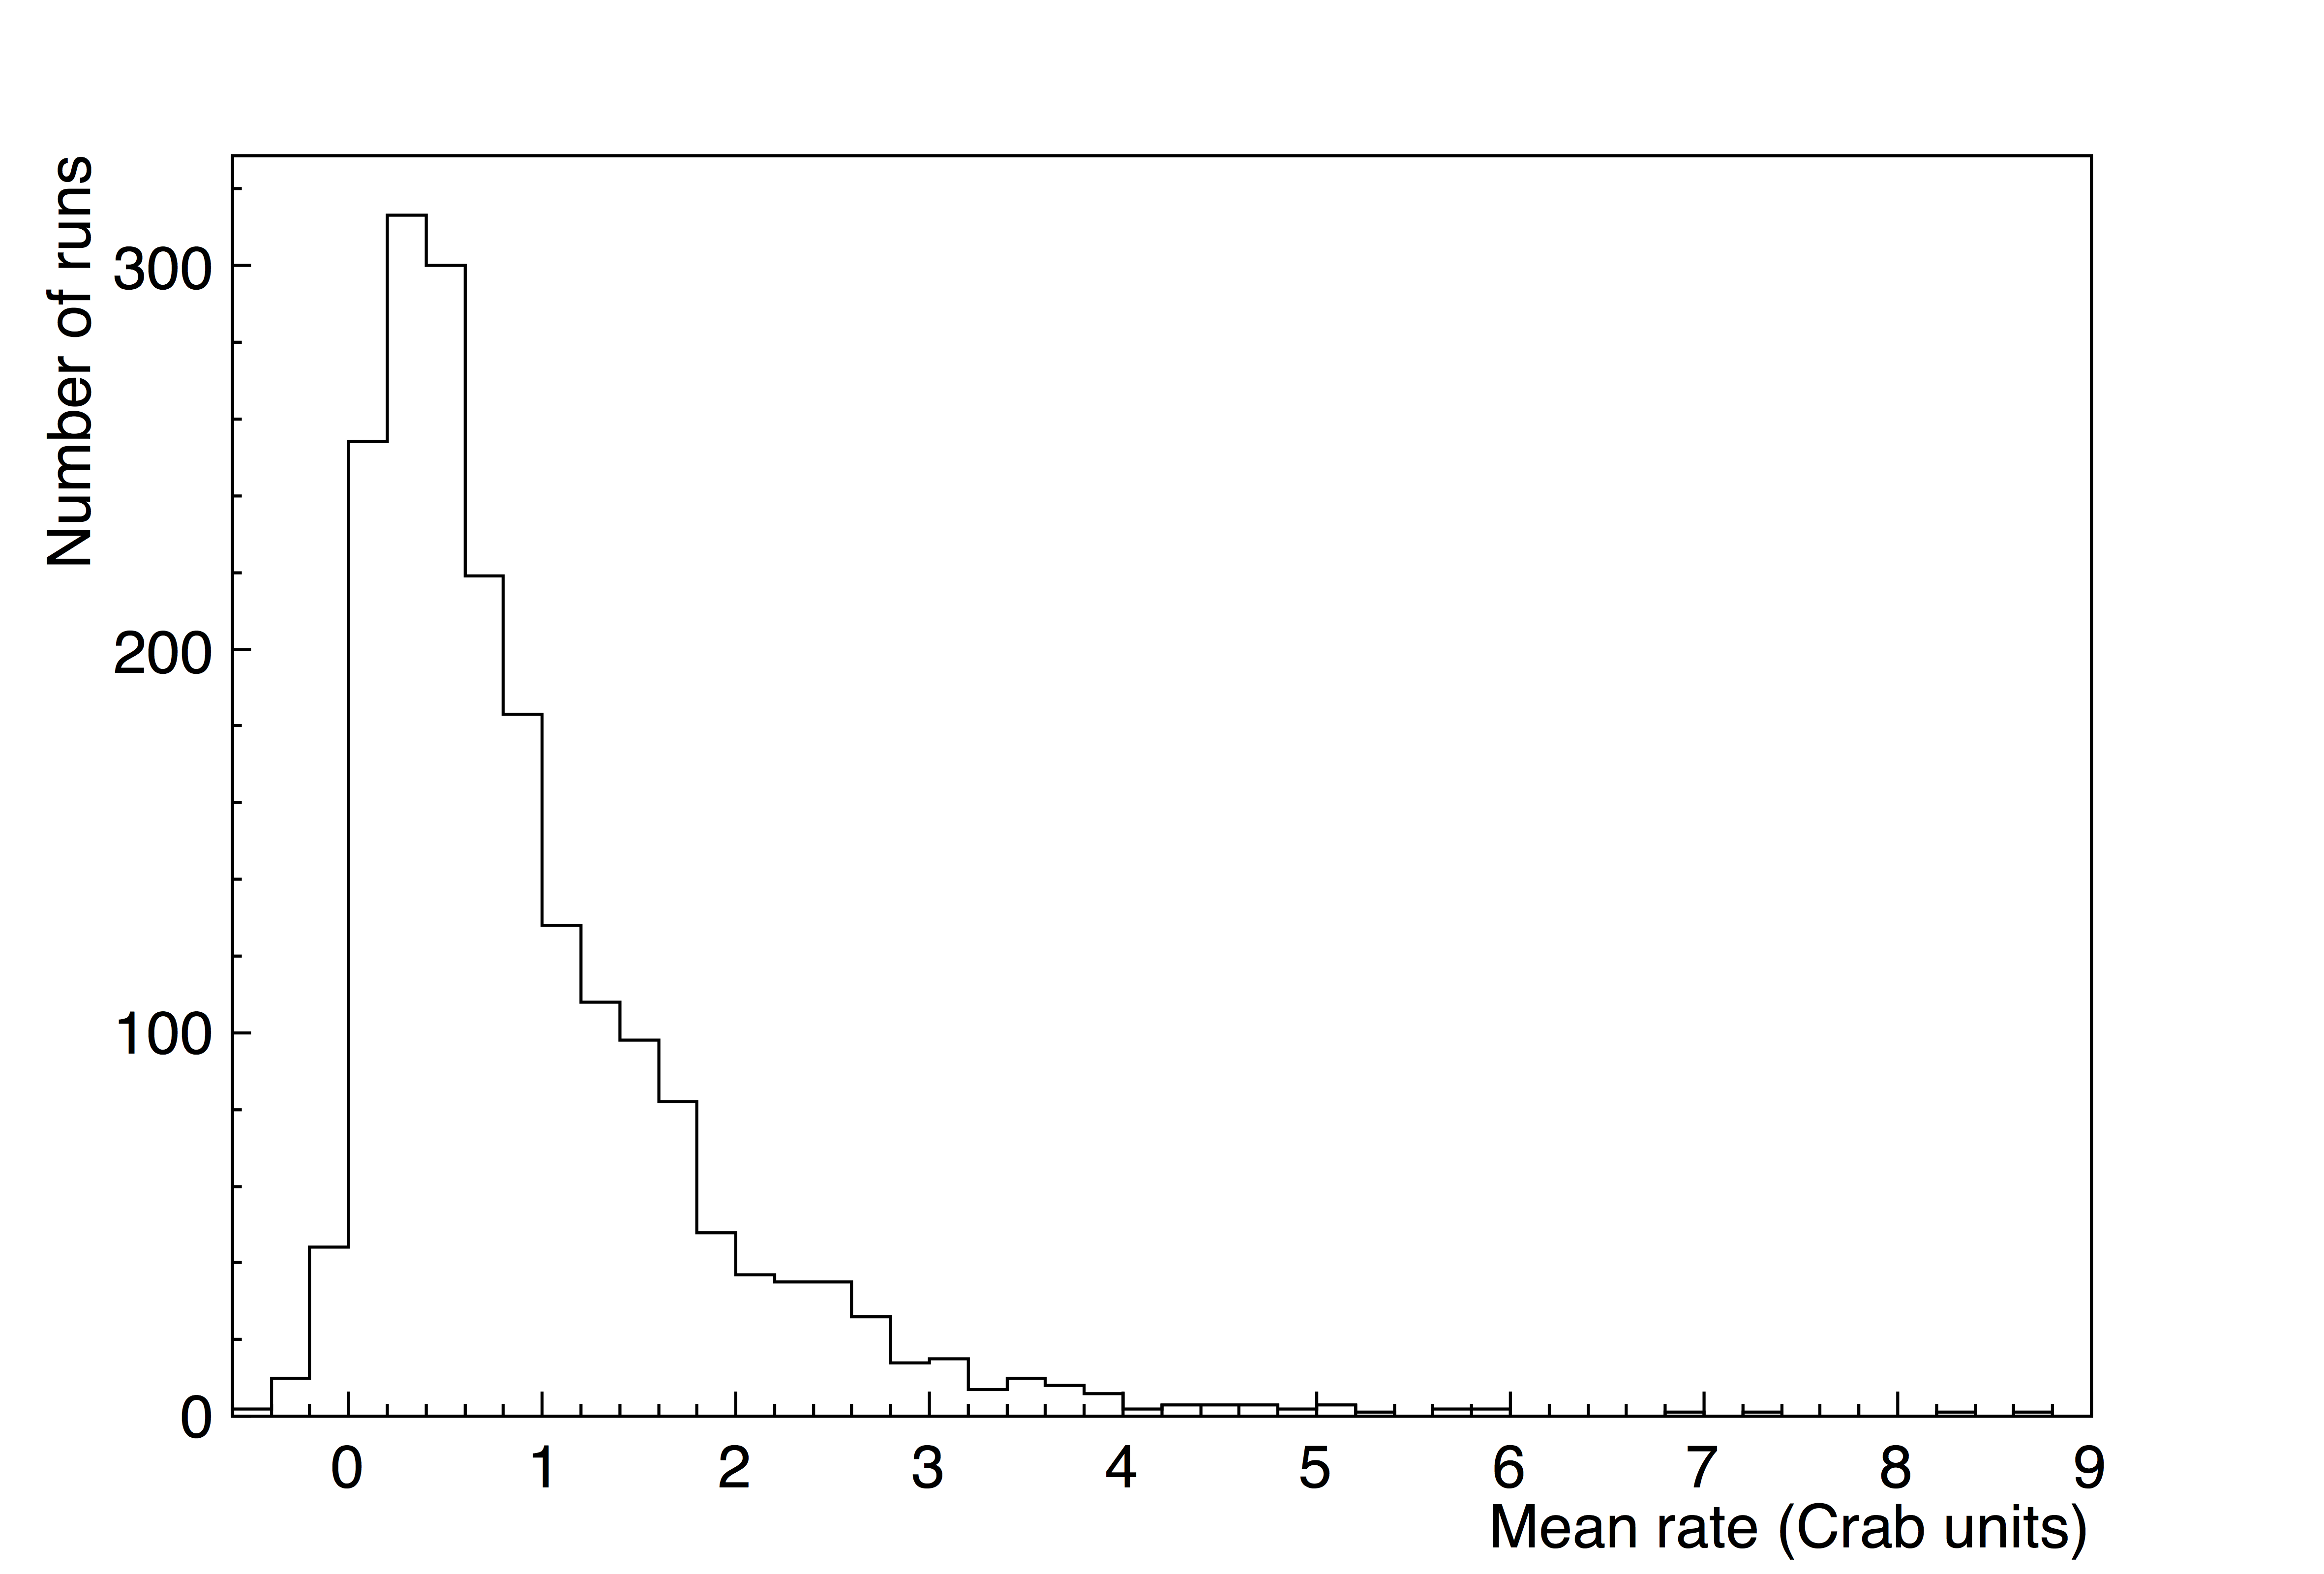
Figure 11: Distribution of the Mrk421 gamma-ray rate (E > 400 GeV) for 2007 individual runs (generally of 28-minute duration) taken over 14 years of observation (1995–2009).
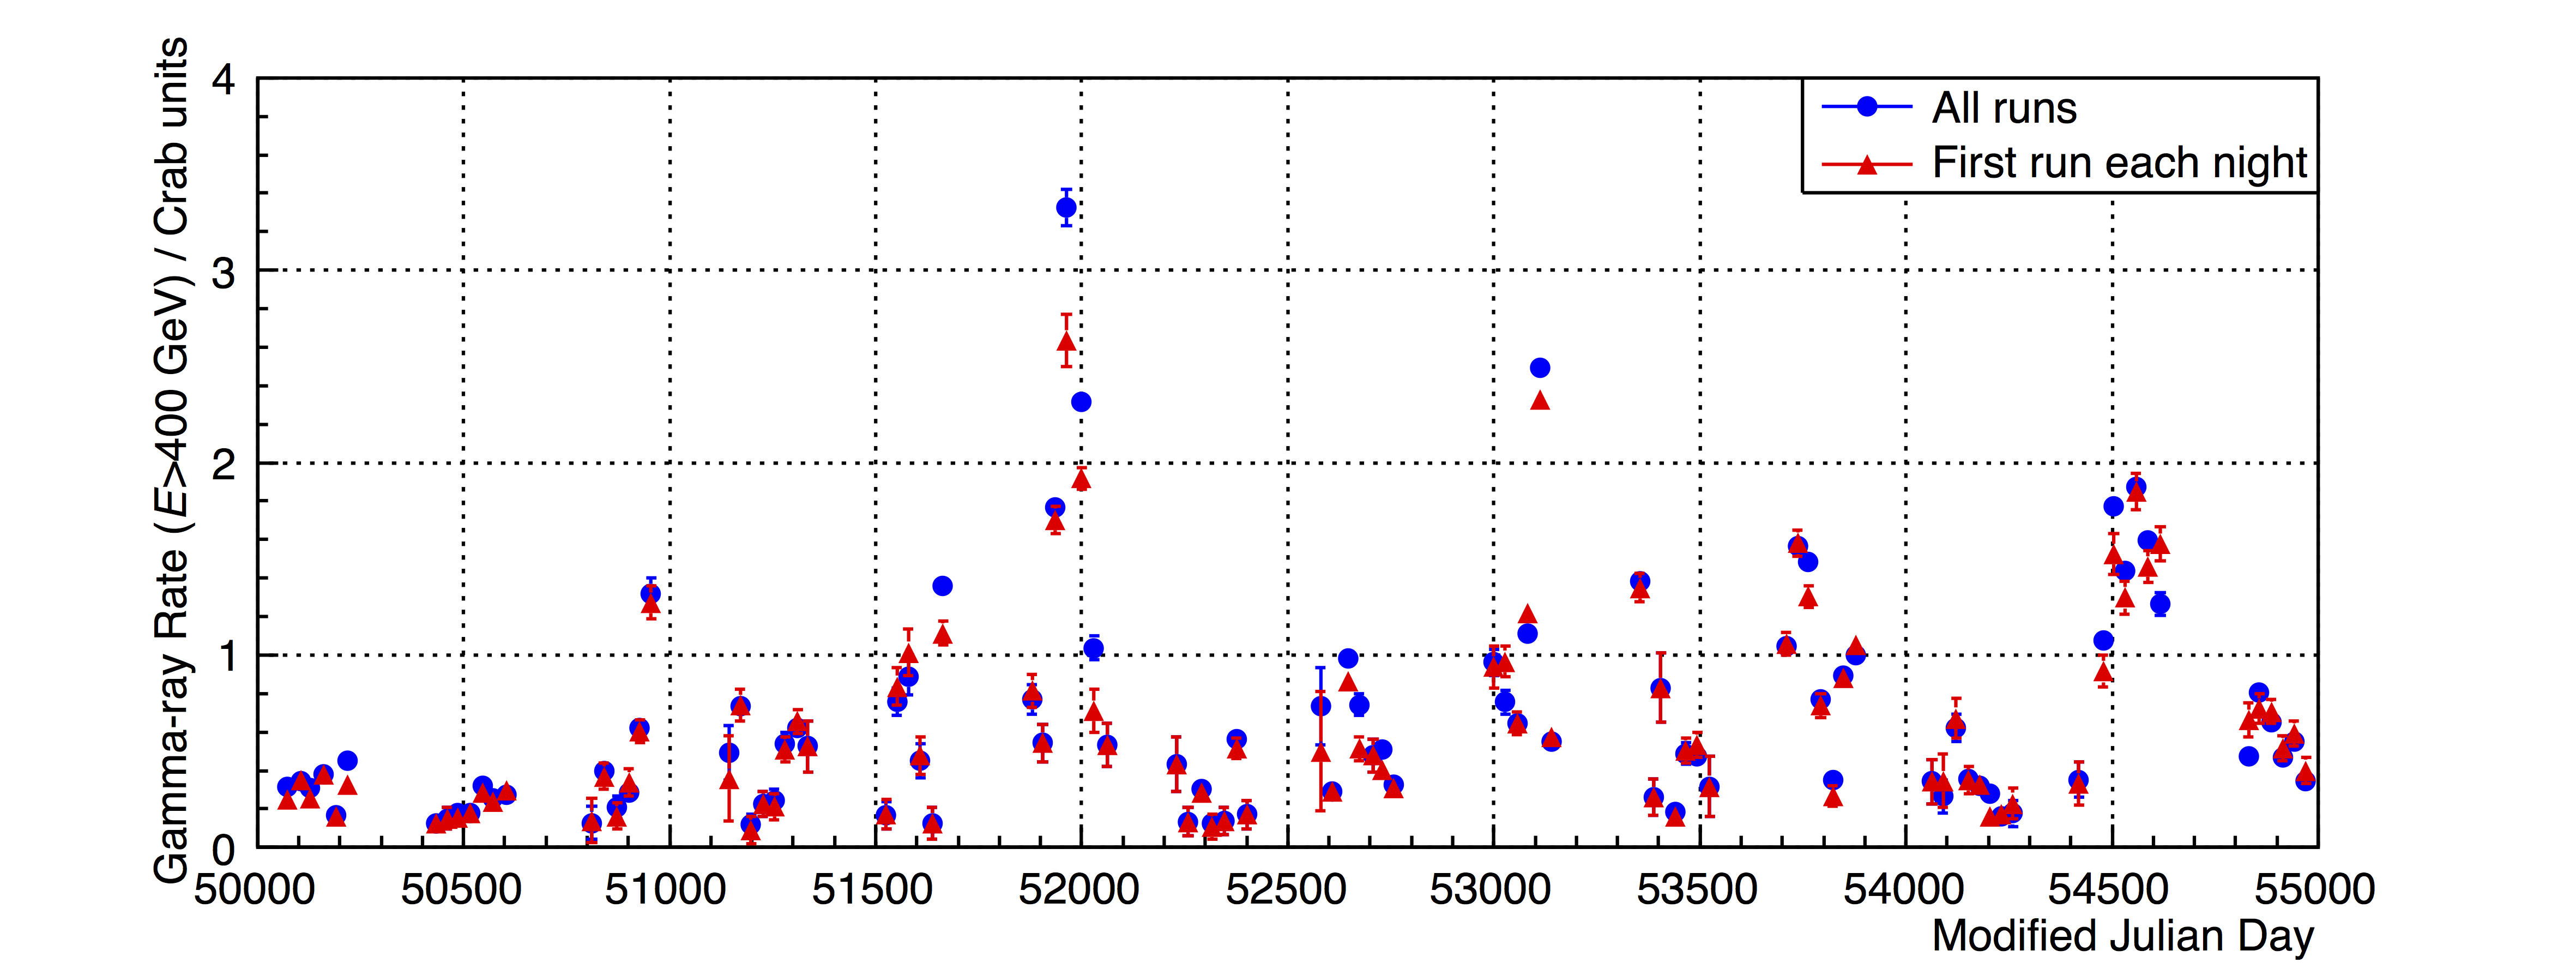
Figure 12: Mrk421 gamma-ray flux (E > 400 GeV) for each darkrun from 1995 to 2009. Fluxes calculated using all available data runs (typical duration 28 minutes) satisfying weather, hardware and elevation criteria are shown as circles (blue); triangles (red) are fluxes calculated using only the first data run on each night of observation.
Figure 13: Whipple 10 m gamma-ray (E > 400 GeV) light curve for Mrk421 on 2nd May 2008 (MJD 54588), binned in 5-minute intervals. The dashed line shows the mean rate for the 2007–2008 season. The gap in the plot arises from two factors: firstly, the data run immediately before the gap was taken in ON/OFF mode, and secondly, the telescope had already been slewed to observe another target before the analysis of the Mrk421 run showed that a major flare was taking place.
Figure 14: Mrk421 gamma-ray rate on 3rd May 2008 (MJD 54589), from Whipple (E > 400 GeV) and VERITAS (E > 300 GeV) observations (top and middle panels, respectively). Both light curves are binned in 2-minute intervals. The bottom panel shows the DCF between the Whipple and VERITAS data.
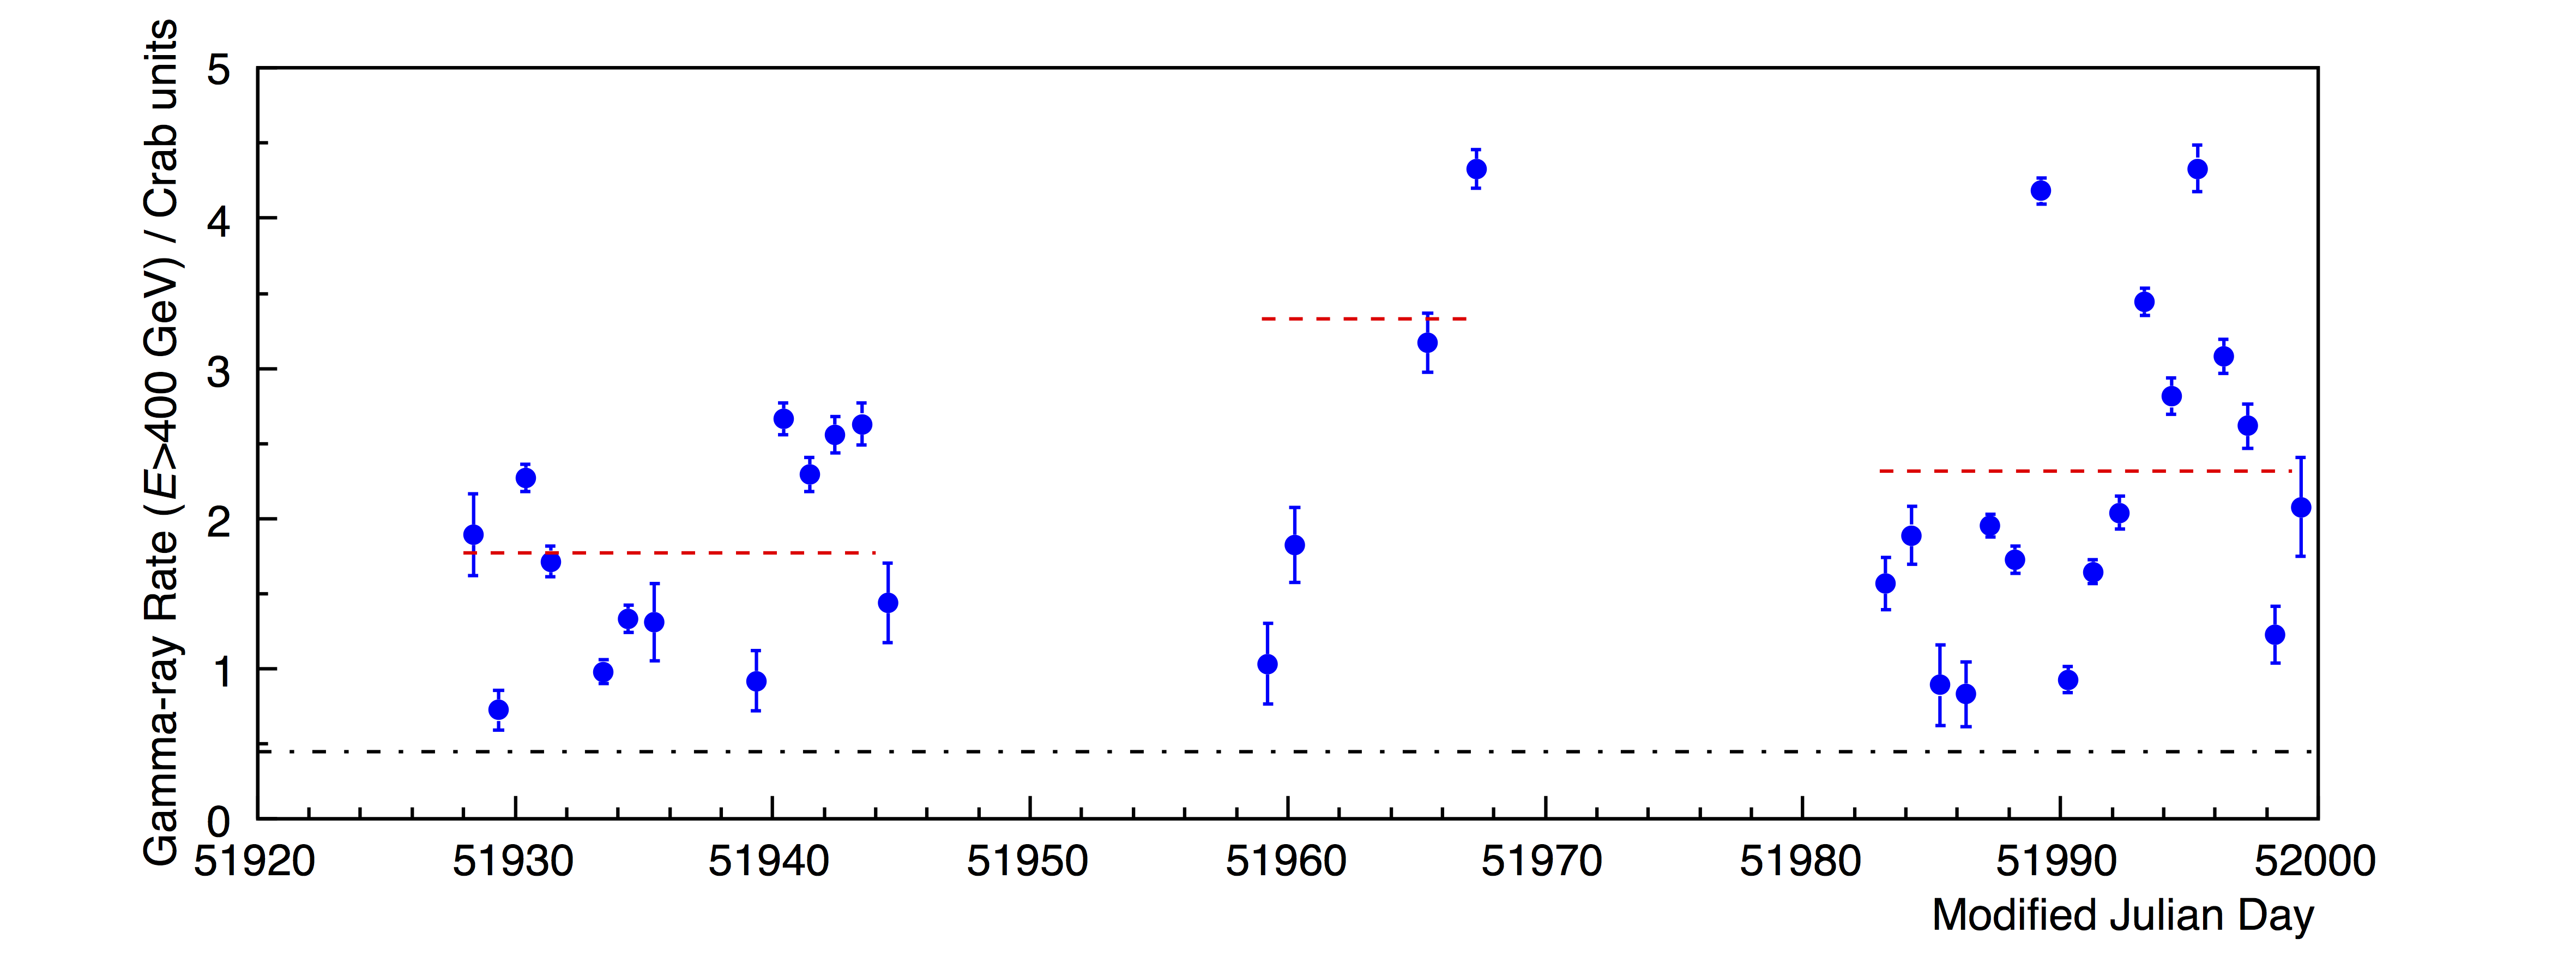
Figure 15: Mrk421 gamma-ray rate (E > 400 GeV) for the period of high VHE activity from January 2001 to March 2001. The dashed lines represent the average rate (weighted mean) for each of the three darkruns in this period; the dot-dashed line indicates the mean rate for the full 14-year data set (1995–2009).