Clusters of galaxies are among the largest structures in the universe. They have a typical size of a few million light-years and contain a mass equivalent to a few hundred trillion stars similar to the sun. Most of that mass is carried by dark matter whose nature is one of the most important questions in modern astrophysics. The Coma cluster of galaxies is relatively close to us, only 300 million light-years away, and it does not contain an individual source of high-energy gamma rays such as an active galactic nucleus. It is an interesting target for VERITAS: not only can we search for signatures of dark-matter interactions, we can also investigate the abundance of cosmic rays, an energetic particle radiation, whose presence is in dicated by a diffuse glow in the radio band produced by very energetic electrons.
VERITAS observed the Coma cluster of galaxies for a total time period of 18.6 hours under good operating conditions. No signal was detected, which, together with data obtained with NASA's Fermi satellite, permits placing an upper limit to the pressure provided by cosmic rays. Their contribution to the stability of the cluster against gravitation collapse may not exceed a few per cent. We also derive limits on dark-matter self annihilation that are most constraining if the dark-matter particles have a mass more than a thousand times higher than that of a hydrogen atom.
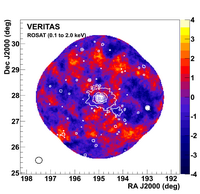
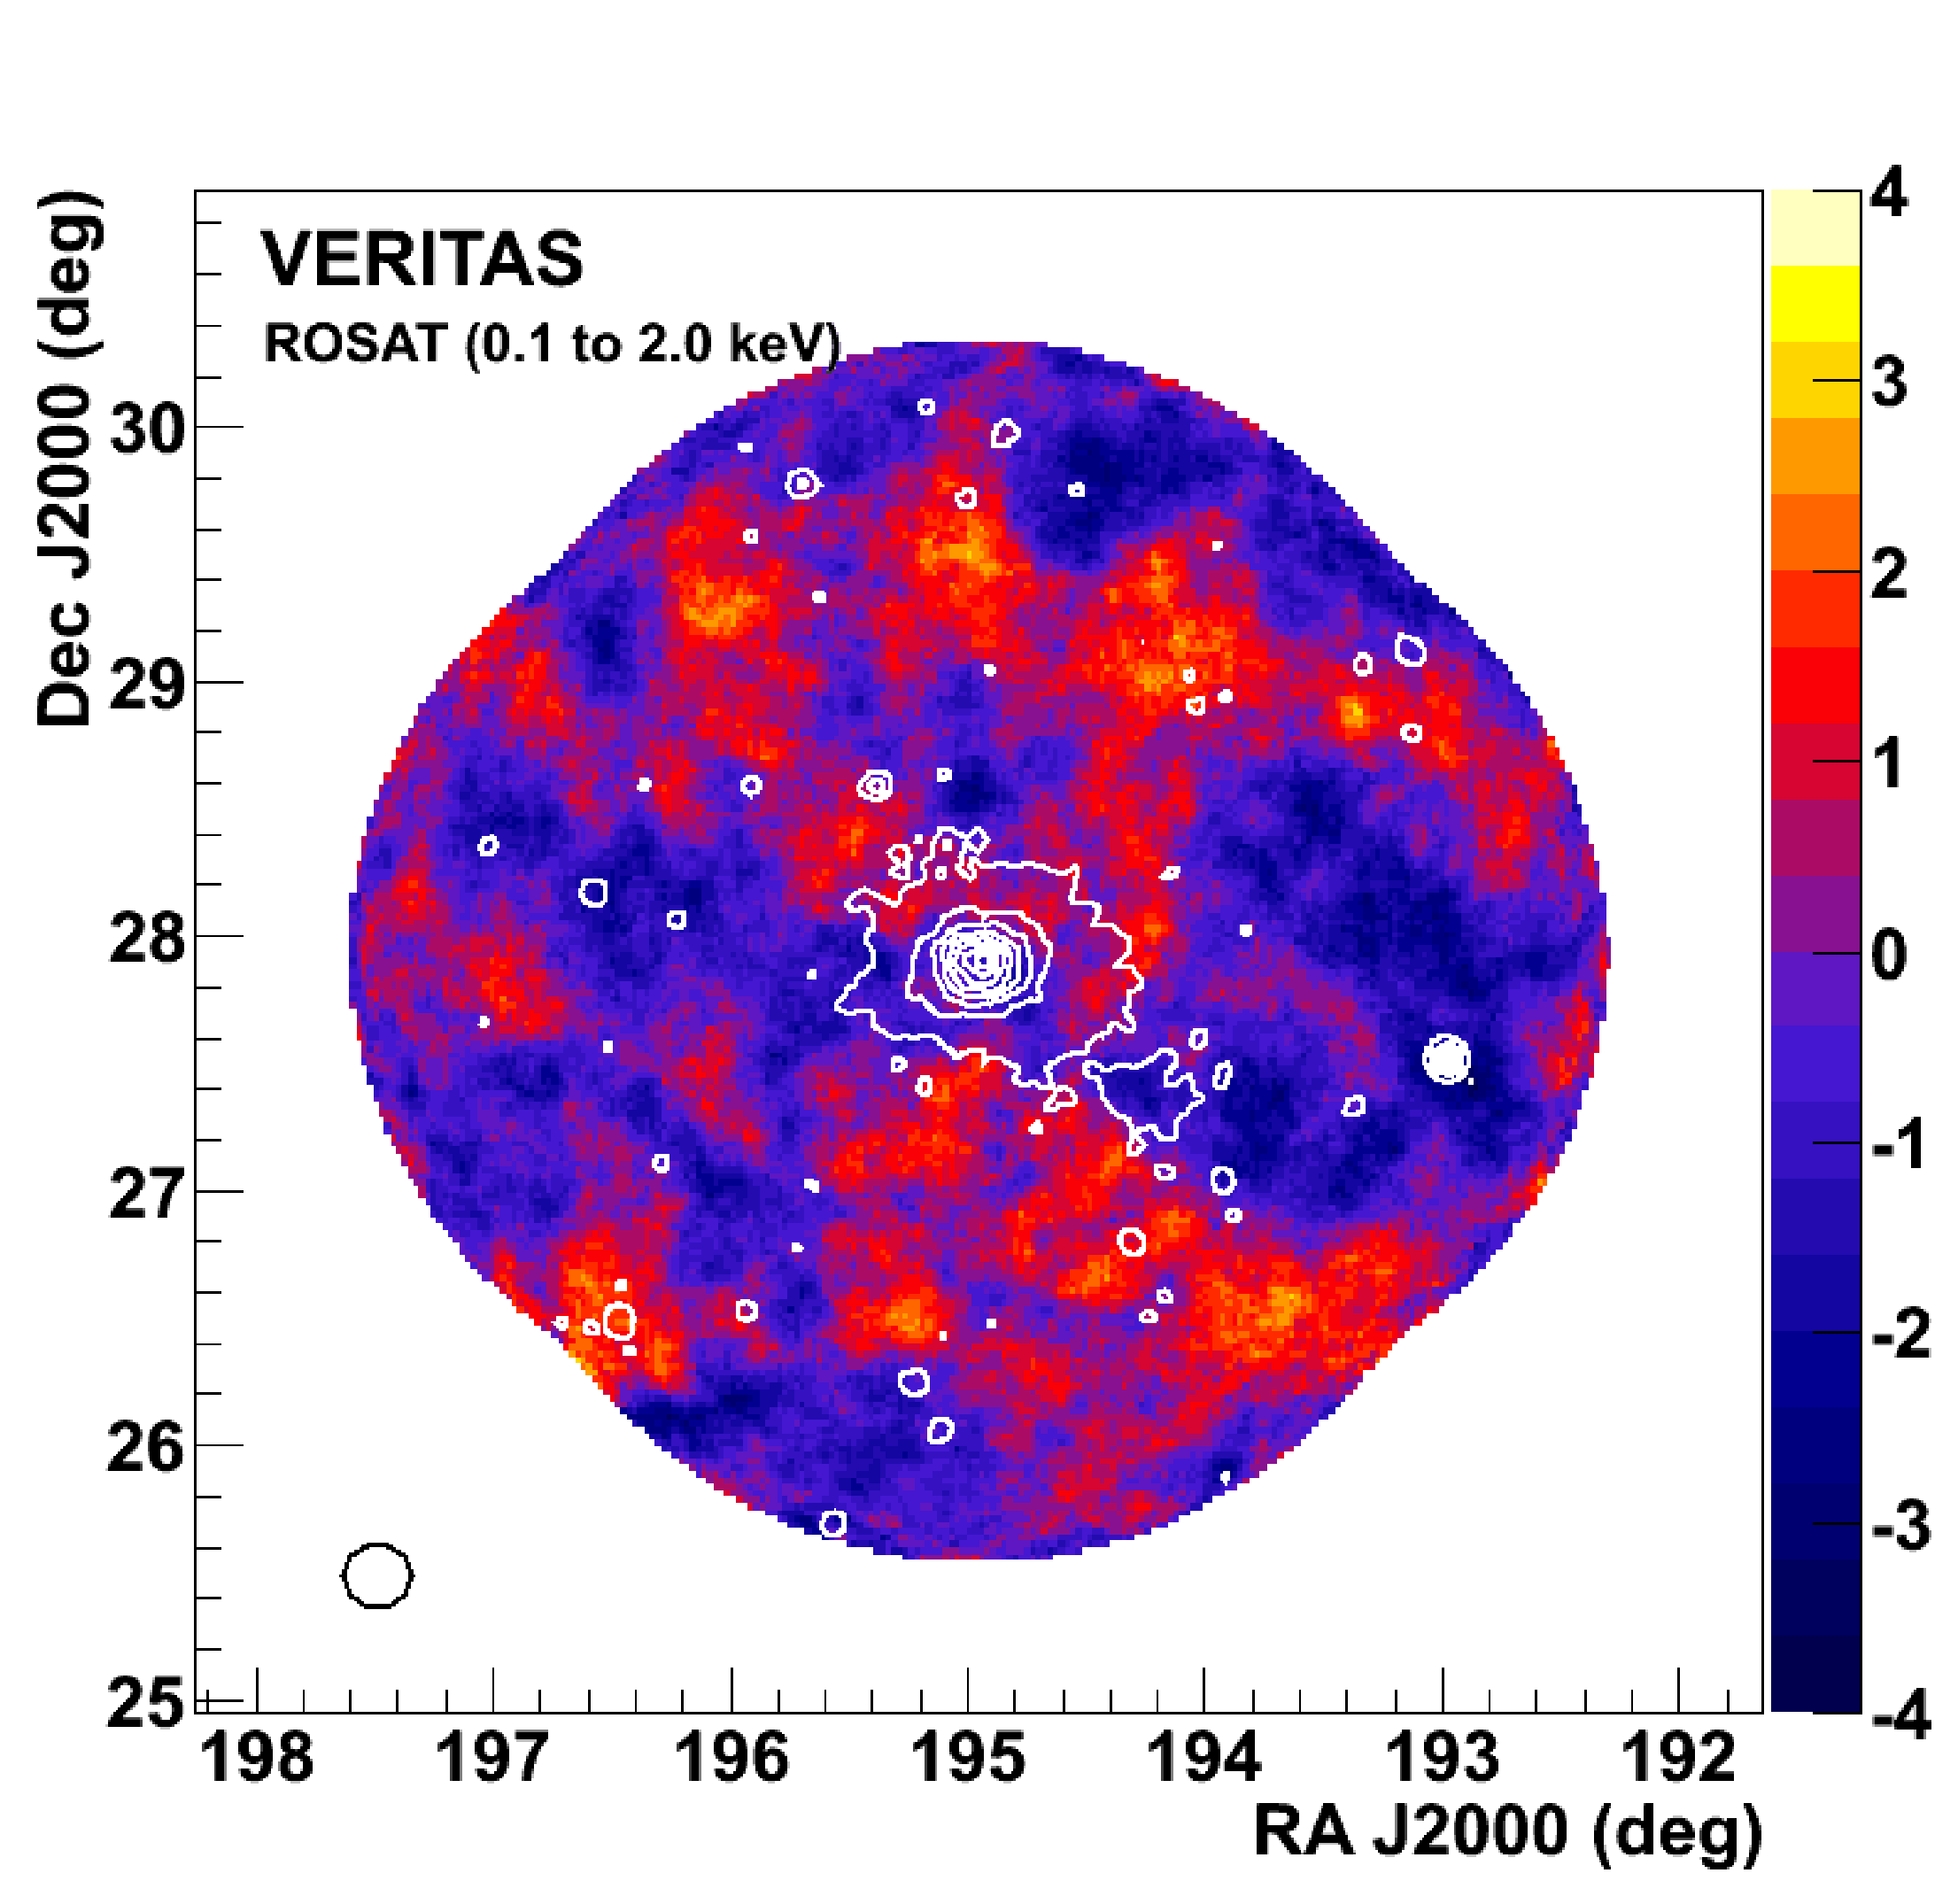
Figure 1: Left : Smoothed significance map of the Coma cluster calculated from the excess VHE gamma-ray events observed with VERITAS over a 4.5◦ × 4.5◦ field of view. The color scale indicates significance in units of standard deviations. The excess counts were derived using a ring-background model (Aharonian et al. 2001). White contours show the X-ray counts per second in the 0.1 to 2 keV energy band (8 levels from 1 to 16 cts s−1 after 3-pixel Gaussian smoothing) from the ROSAT all-sky survey (Briel et al. 1992). Right : Same as above but with overlaid contours (20-180 mJ in 20 mJ steps) from GBT radio observations at 1.4 GHz (Brown & Rudnick 2011), where strong point sources have been subtracted. Also shown are the 0.2◦ and 0.4◦ radii (dashed cyan) considered for the extended-source analyses presented here.
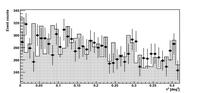
Figure 2: Θ 2 distribution from VERITAS observations of the Coma cluster of galaxies. The points with error bars represent the ON-source data sample and the filled area is the background estimation based on the OFF-source regions. Each bin represents an annulus around the Coma cluster core position and the annuli are all of equal area. The data were derived from the ring-background model using a 0.2◦ integration radius.
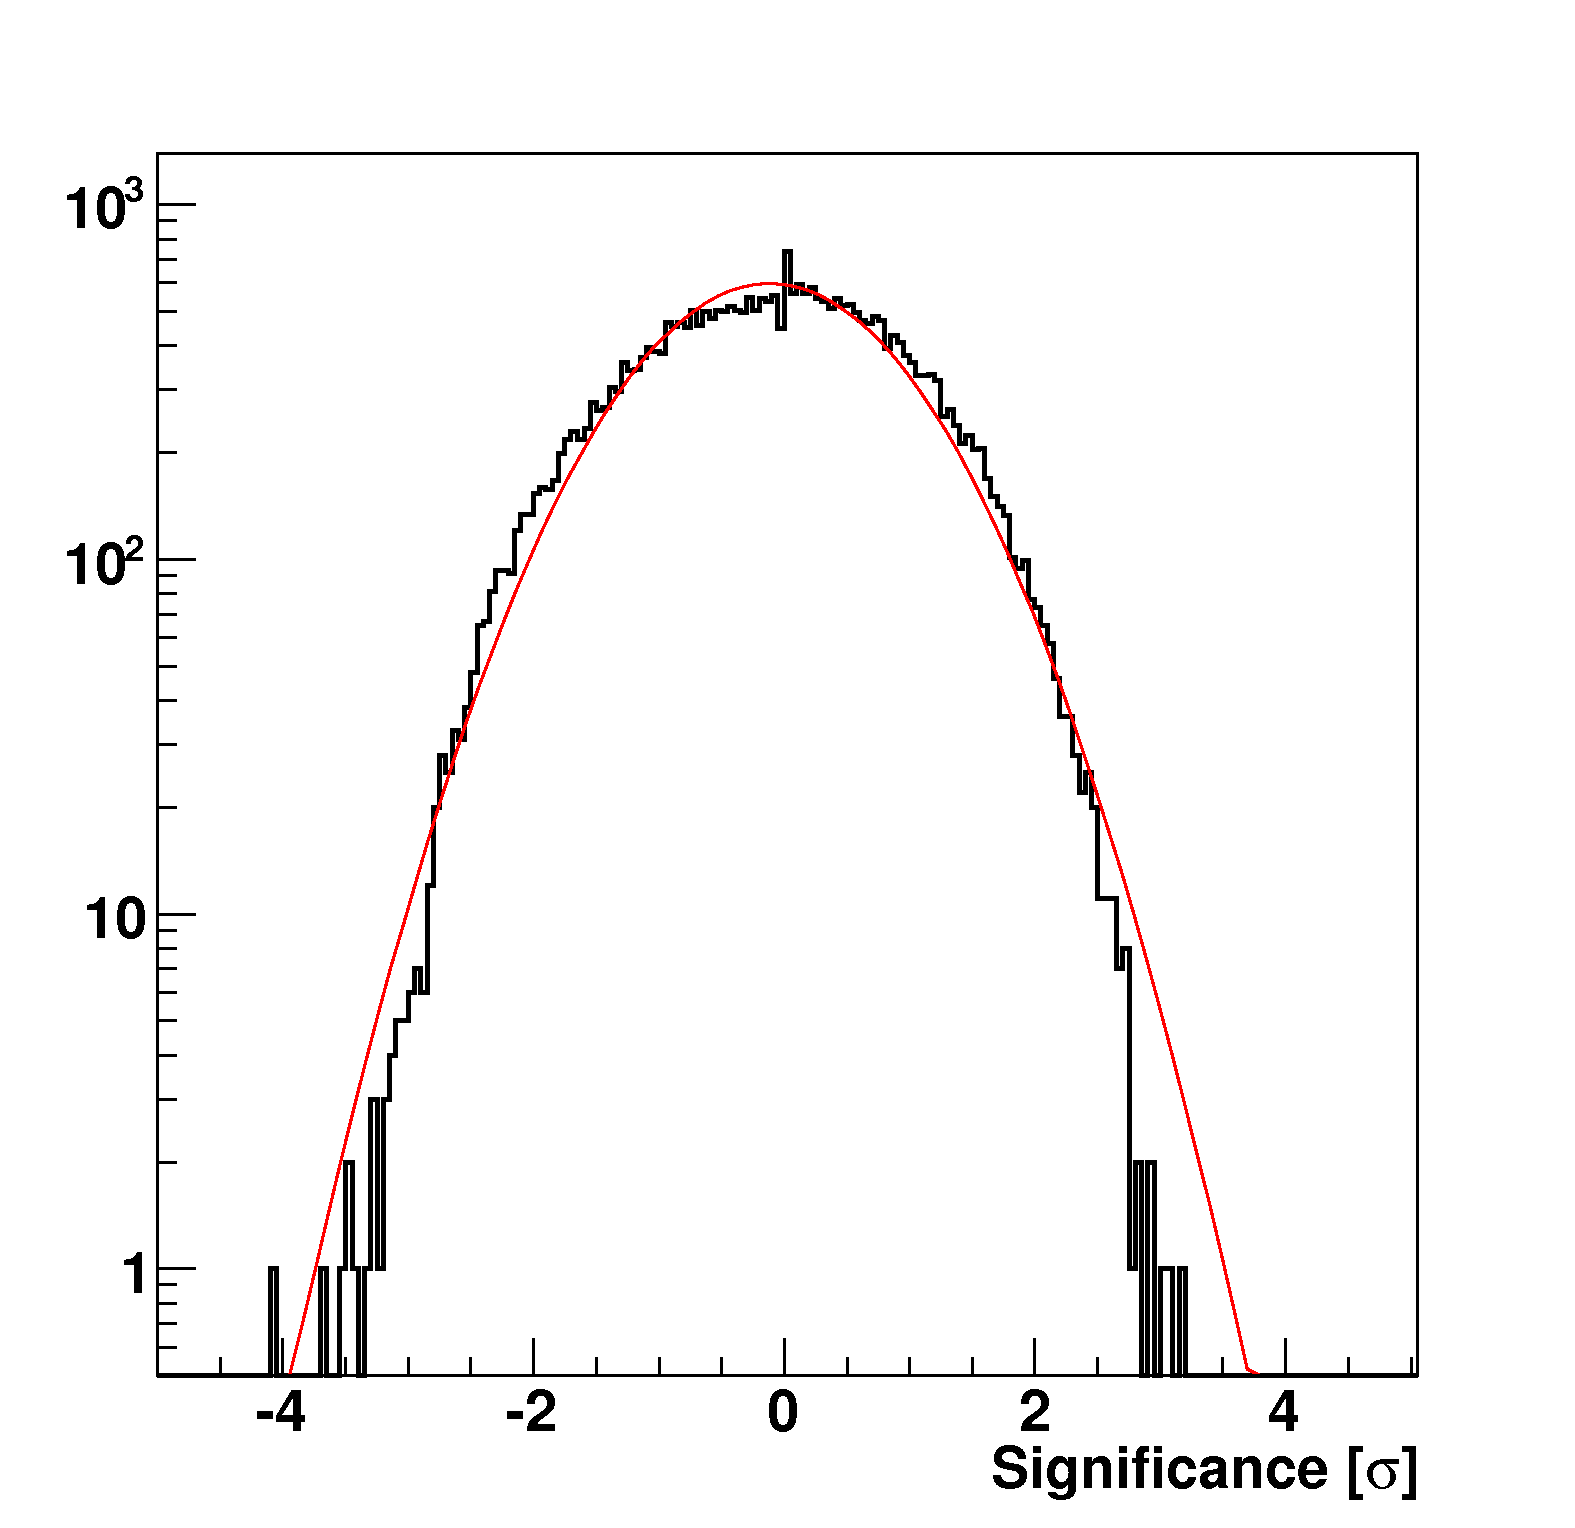
Figure 3: Distribution of significances for Figure 1 and an integration radius of 0.2◦. The curve is a Gaussian fit to the data, with mean μ = −0.11 ± 0.0059 and standard deviation σ = 1.01 ± 0.003, which is consistent with the absence of gamma-ray sources in the field of view.
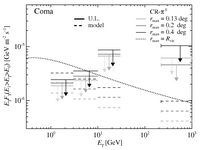
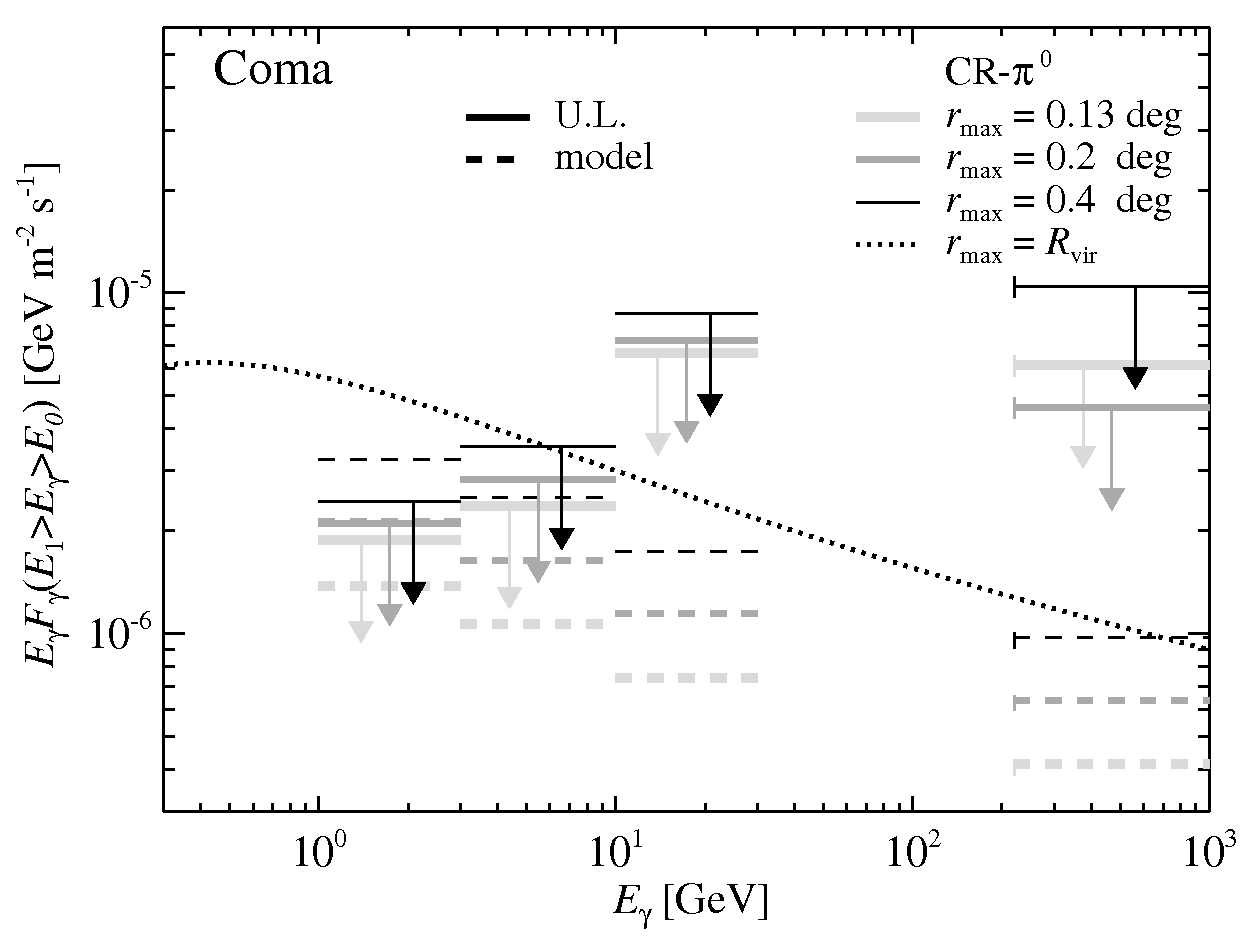
Figure 4: Integral gamma-ray flux upper limits in narrow energy bands [E0;E1] for Fermi and VERITAS observations of the Coma cluster (given in Tables 2 and 3) for different integration radii (arrows with different grey intensities), assuming that α = 2.3 except in the 1–3 GeV energy interval where α = 2.1 is adopted. Rvir is the virial radius of the Coma cluster, corresponding to 1.25◦. These are compared to integrated spectra of the same energy interval and aperture, assuming the universal gamma-ray spectrum of clusters (lines with different grey intensities, Pinzke & Pfrommer 2010). To guide the eye, we show the underlying universal integral energy distribution of pion decay gamma-rays, Eγ Fγ (>Eγ ), resulting from hadronic interactions of CRs and ICM protons (CR-π 0, dotted). For visualization purposes all photon fluxes are weighted with the smallest energy in each interval. Note that the Fermi limit for the energy interval of 1–3 GeV within the aperture of 0.4◦ is the most constraining.
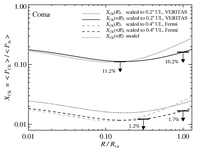
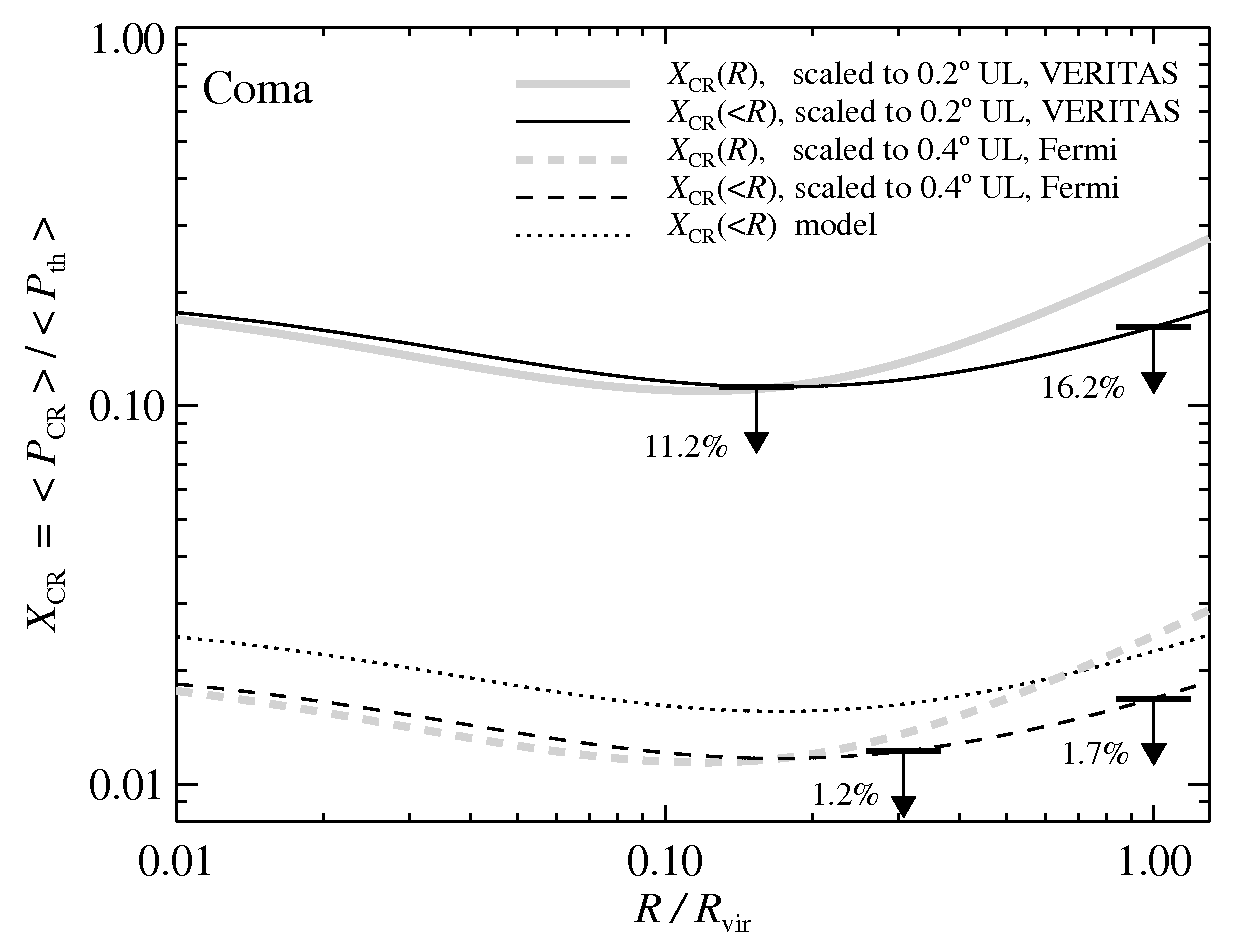
Figure 5: CR-to-thermal pressure ratio as a function of radial distance from the center of the Coma cluster. The model predictions, shown by dashed curves (Pinzke & Pfrommer 2010), have been scaled to match the most constraining VERITAS upper limits within 0.2◦ (solid) and Fermi upper limits within 0.4◦ (dashed). We compare differential XCR profiles (grey) to integrated profiles (black) which we use to compare to the upper limits.
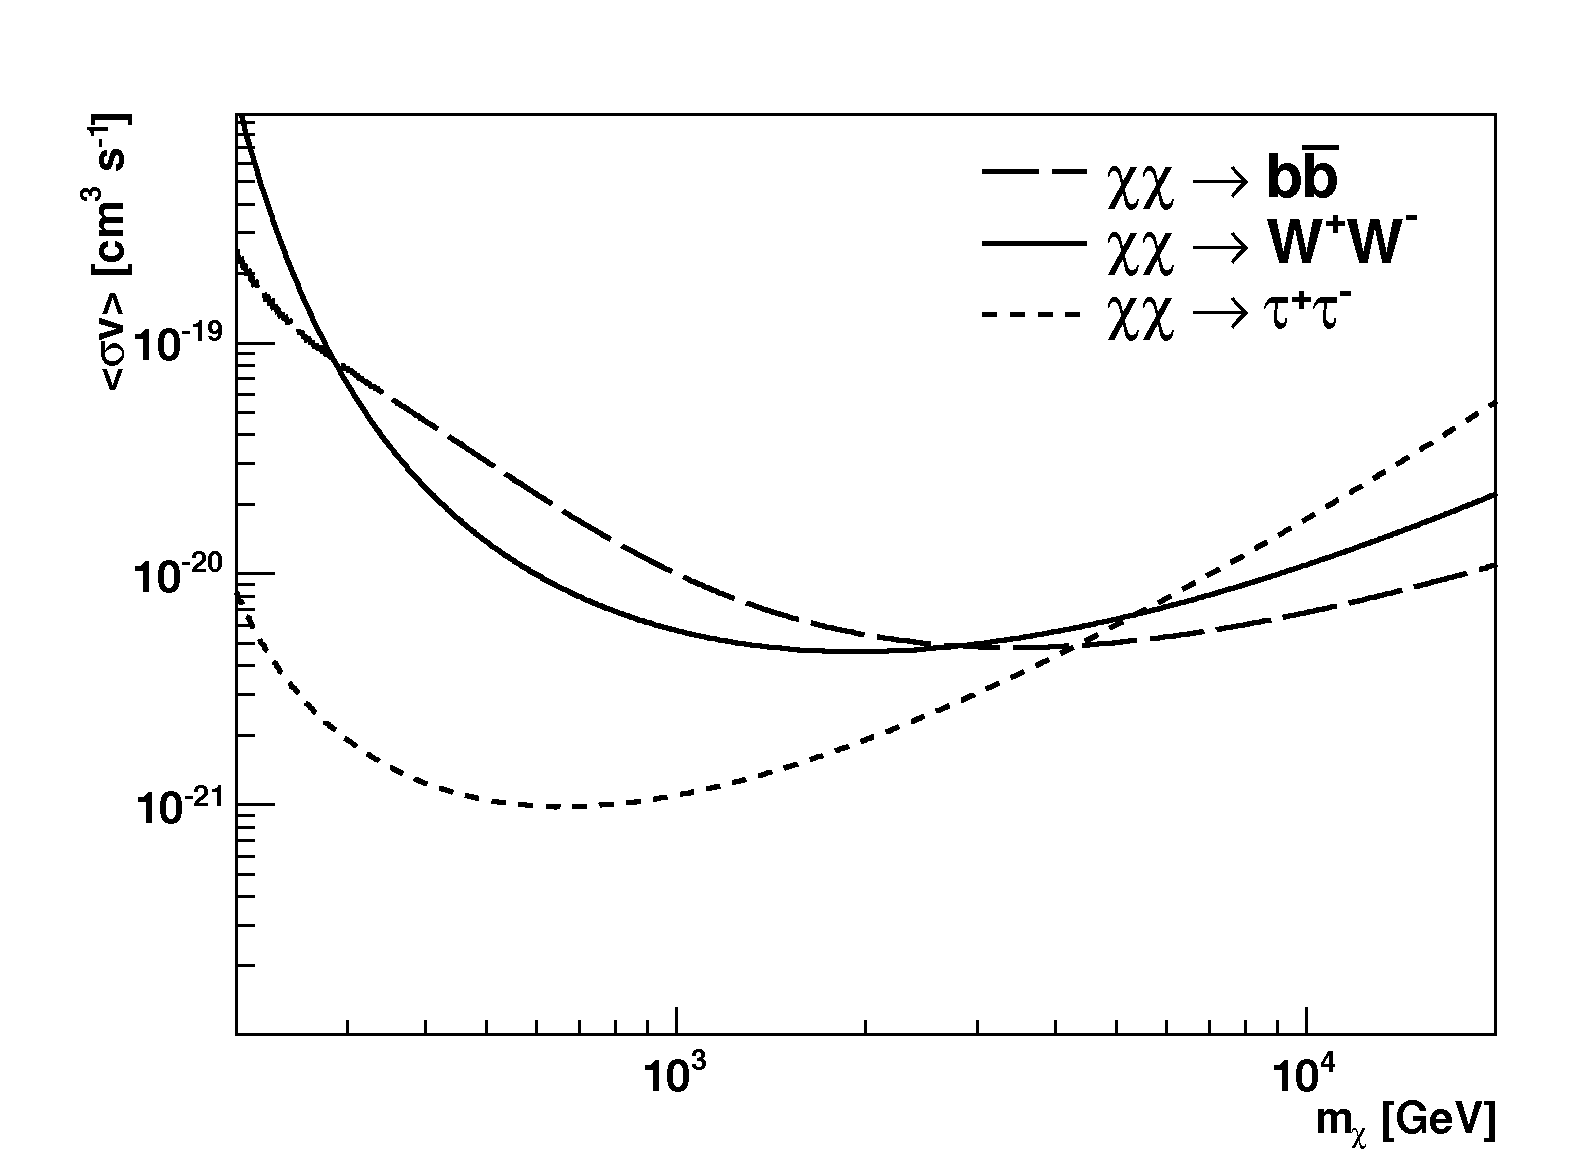
Figure 6: Limits on the DM annihilation cross section <σv>from VERITAS observations of the Coma cluster as a function of the DM particle mass mχ derived from the VERITAS gamma-ray flux upper limits (0.2◦ aperture) presented in this work.