Reference: V. A. Acciari et al. (The VERITAS Collaboration), Astrophysical Journal 738: 169, 2011
Full text version
ArXiv: ArXiV:1106.4594
Contacts: Jeff Grube
1ES 2344+514 is a nearby (z = 0.044) blazar , and was discovered at very high energy (VHE) gamma-rays energies ( >350 GeV) by the Whipple 10 m telescope during a 1 day flare on December 20, 1995. Blazars are active galactic nuclei (AGN) with a relativistic plasma jet oriented close to the line of sight. These objects exhibit rapid variability and have broadband spectral energy distributions (SEDs) characterized, in a νFν representation, by a synchrotron component extending from radio to X-ray frequencies, and a second component peaking at gamma-ray frequencies due to either inverse-Compton radiation or from hadronic processes.
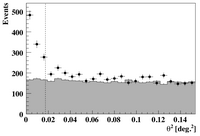
VERITAS observed 1ES 2344+514 for 18 hours spread over 37 nights between October 4, 2007 and January 11, 2008. The total VERITAS signal has a statistical significance of >20 sigma. A strong VHE gamma-ray flare on December 7, 2007 was measured at F(>300 GeV) = (6.76 ± 0.62) * 10-11 cm-2 s1, corresponding to 48% of the Crab Nebula flux. Excluding this flaring episode, nightly variability at lower fluxes was observed with a time-averaged mean of 7.6% of the Crab Nebula flux.
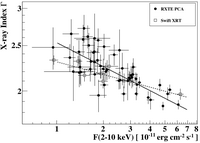
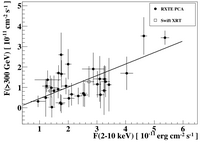
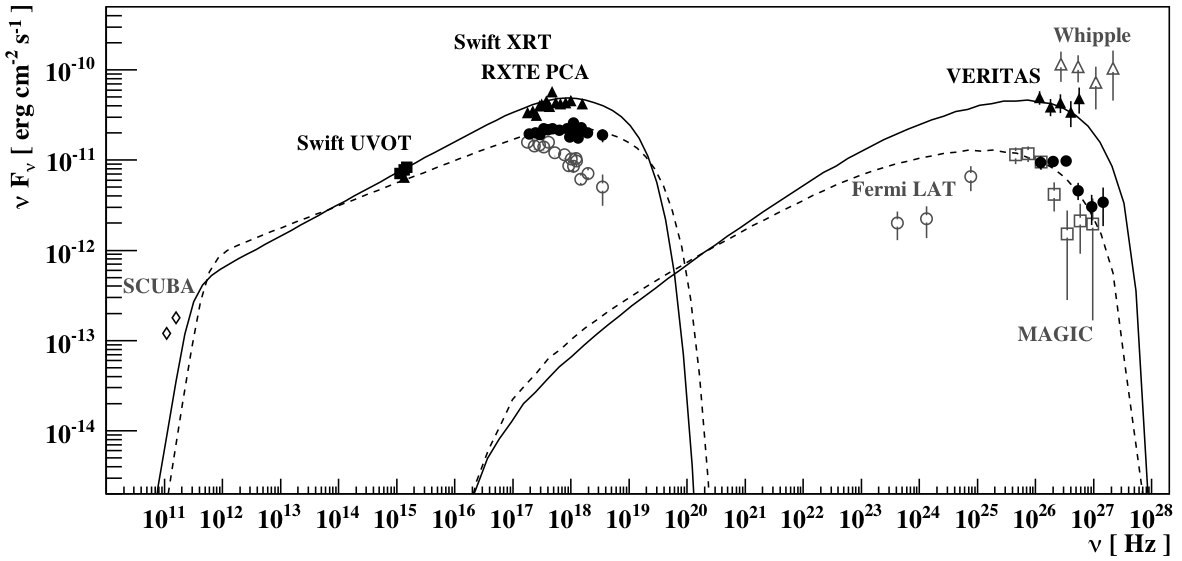
During the full period of VERITAS observations contemporaneous X-ray and UV data were taken with Swift and RXTE. Variability by a factor of ~7 is evident in the 2–10 keV flux between nightly observations. On December 8, 2007 the highest ever observed X-ray flux from 1ES 2344+514 was measured by Swift XRT. Evidence for a correlation between the X-ray flux and VHE gamma-ray flux on nightly time-scales is indicated with a Pearson correlation coefficient of r = 0.60 ± 0.11. Contemporanous spectral energy distributions (SEDs) of 1ES 2344+514 are presented for two distinct flux states. A one-zone synchrotron self-Compton (SSC) model describes both SEDs well.
Figures from paper (click to get full size image):
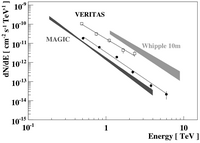
Figure 2: Differential photon spectrum of VHE γ-rays for 1ES 2344+514. The circles represent the time-averaged VERITAS data from 2007 October
to 2008 January, excluding the bright flare on 2007 December 7. The open squares represent VERITAS data from the flare night. Shown for comparison are the 68% confidence intervals for the best-fit power law models to 1ES 2344+514 data from MAGIC (dark grey band) in 2005 August to 2006 January (Albert et al. 2007), and from the Whipple 10 m (light grey band) during a high flux state on 1995 December 20 (Schroedter et al. 2005).
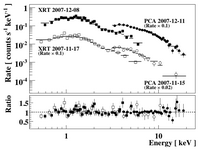
Figure 3: X-ray spectrum of 1ES 2344+514 from Swift XRT and RXTE PCA observations. Shown in the top panel are example moderate-flux and high-flux spectra identified in the plot by instrument and observation date. The differential rates are scaled in three cases for viewing purposes. For
each energy bin, the statistical significance is >3 σ, and the horizontal line represents the best-fit forward folded absorbed power law model. The bottom panel shows the ratio of the data and model values.
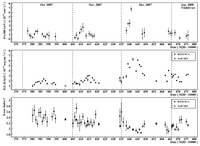
Figure 7: Spectral energy distribution of 1ES 2344+514. The high flux spectrum (triangles) are from VERITAS data on 2007 December 7 and Swift UVOT and XRT data on 2007 December 8. The time-averaged VERITAS spectrum and moderate flux level X-ray spectrum from Swift XRT and RXTE PCA data on 2008 January 1 are represented by circles. An example low flux X-ray spectrum (open circles) is from 2007 November 3. Non-contemporaneous VHE γ-ray spectra are shown from MAGIC data in 2005 August–December (open squares) and from Whipple 10 m data on the flare night of 1995 December 20 (open triangles). All VHE γ-ray spectra are corrected for absorption by the extragalactic background light (Franceschini et al. 2008). Archival millimeter fluxes (open diamonds) are from SCUBA data (Stevens & Gear 1999). The noncontemporaneous Fermi LAT spectrum from the 1FGL catalog is represented by open circles (Abdo et al. 2010). The broadband curves are from synchrotron self-Compton (SSC) modeling to the contemporaneous data (Krawczynski et al. 2004).

