Microquasars such as SS 433 are considered potential contributors to cosmic rays up to the knee of the cosmic ray energy spectrum (∼ 4 PeV), where a transition in the dominant acceleration processes is expected. The SS 433 system, located within the W50 supernova remnant, is a Galactic microquasar with relativistic jets interacting with the surrounding medium over parsec scales, providing an example for studying jet-driven particle acceleration. A deep morphological and spectral study of SS 433 is performed using more than 150 hours of observations with VERITAS, sensitive to γ-ray energies > 100 GeV. With an angular resolution better than 0.1 ◦ , extended TeV γ-ray emission is resolved from both the eastern and western jet lobes, located tens of parsecs from the central binary. The emission appears elongated along the jet axis and coincides with regions where the jets interact with the surrounding supernova remnant. No TeV emission is detected from the central binary, nor is significant emission observed between the central binary and the jet lobes. Phase-resolved analyses show no evidence for variability with orbital or precessional phase, supporting a steady emission scenario. The observed morphology and spectra are consistent with scenarios where particles are accelerated in the lobes of the jets, possibly through shocks or alternative processes such as magnetic reconnection. The extended TeV emission from the jet lobes of SS 433 favors a leptonic origin in the VERITAS energy range, suggesting any hadronic acceleration is subdominant. The results offer valuable constraints on how microquasar jets may contribute to the Galactic cosmic-ray population toward the knee.
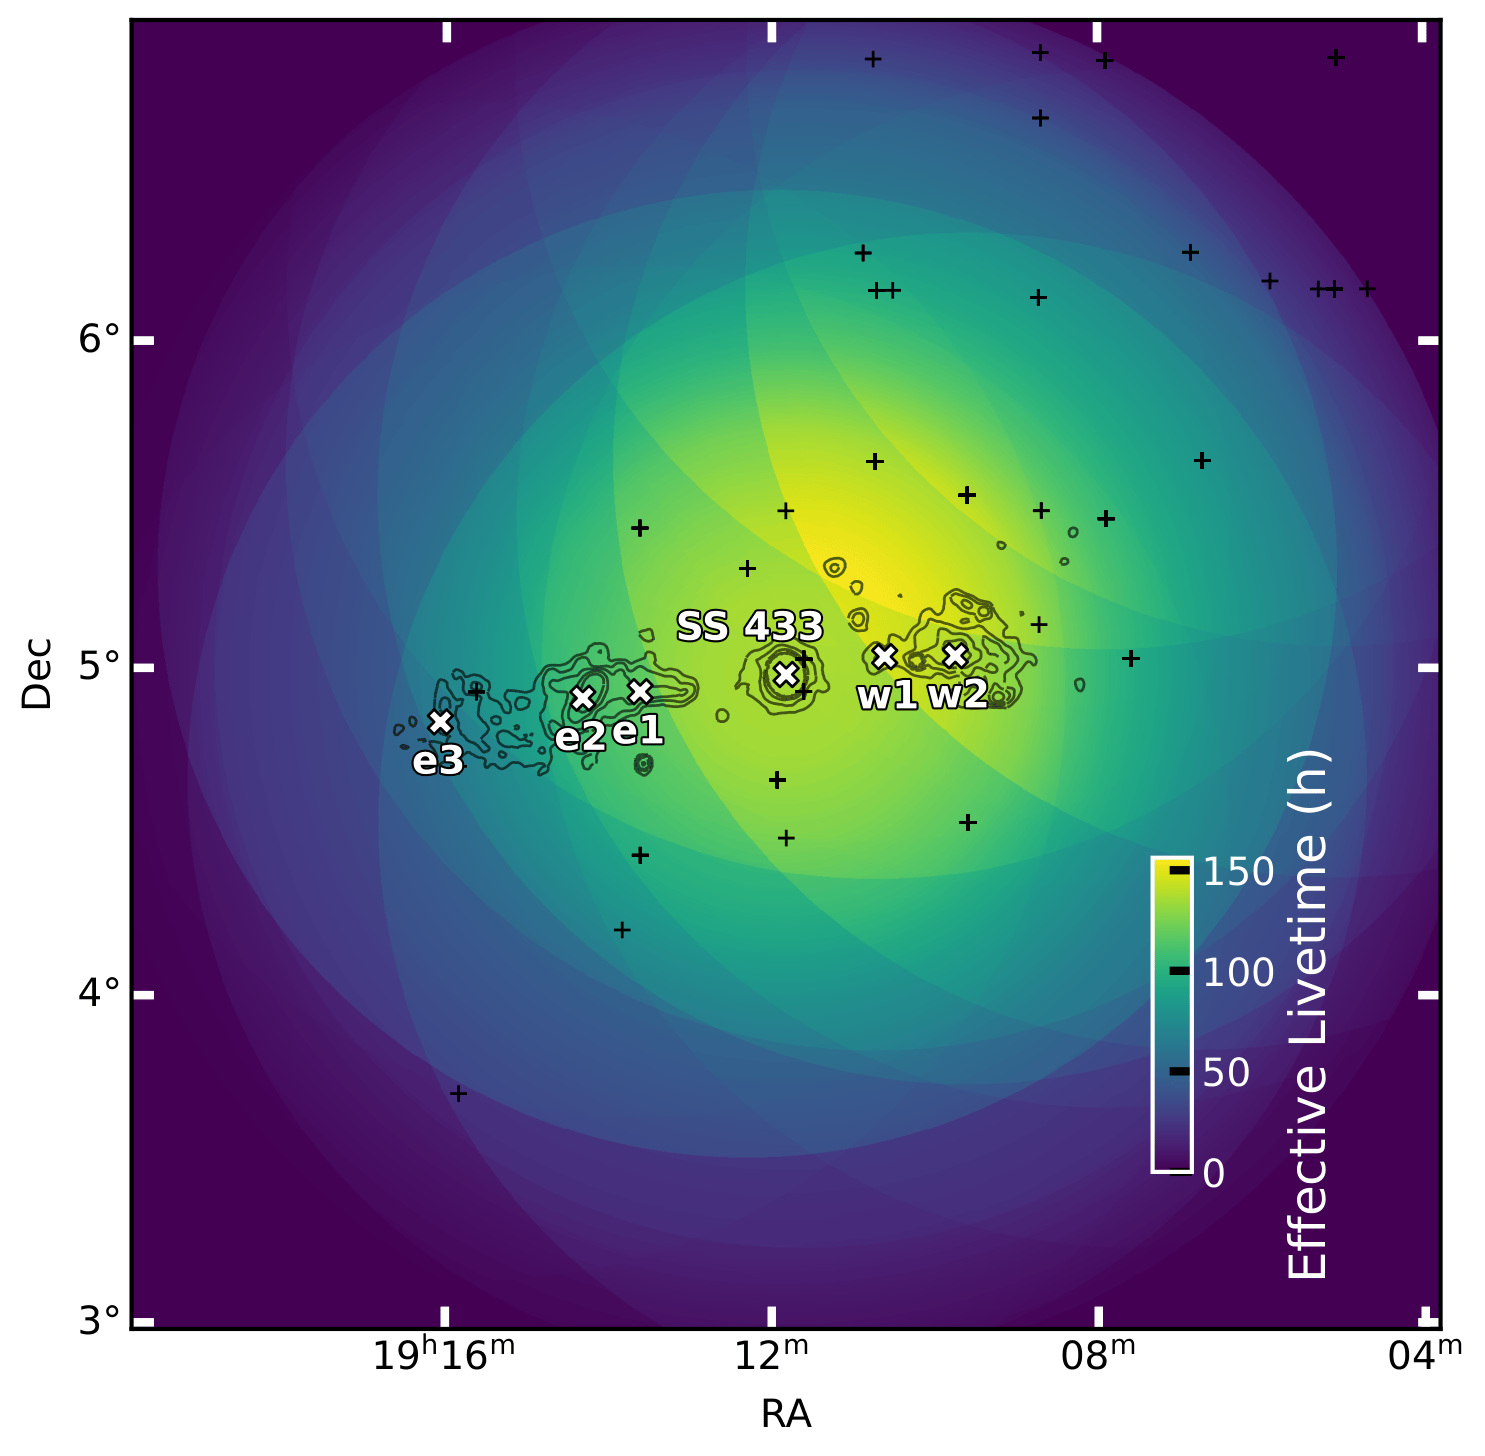
Figure 1: SS 433 region acceptance corrected livetime map: Computed by dividing the exposure map by the VERITAS on axis effective area evaluated at an energy of 1TeV. The map is overlaid by black ROSAT X-ray contours (Brinkmann et al. 1996). The VERITAS observation pointings are indicated by black markers (+) and the eastern (e1, e2, e3) and western (w1, w2) jet emission regions and the central binary (SS 433) are indicated by white crosses. The extended source MGRO J1908+06 is situated at the top right corner.
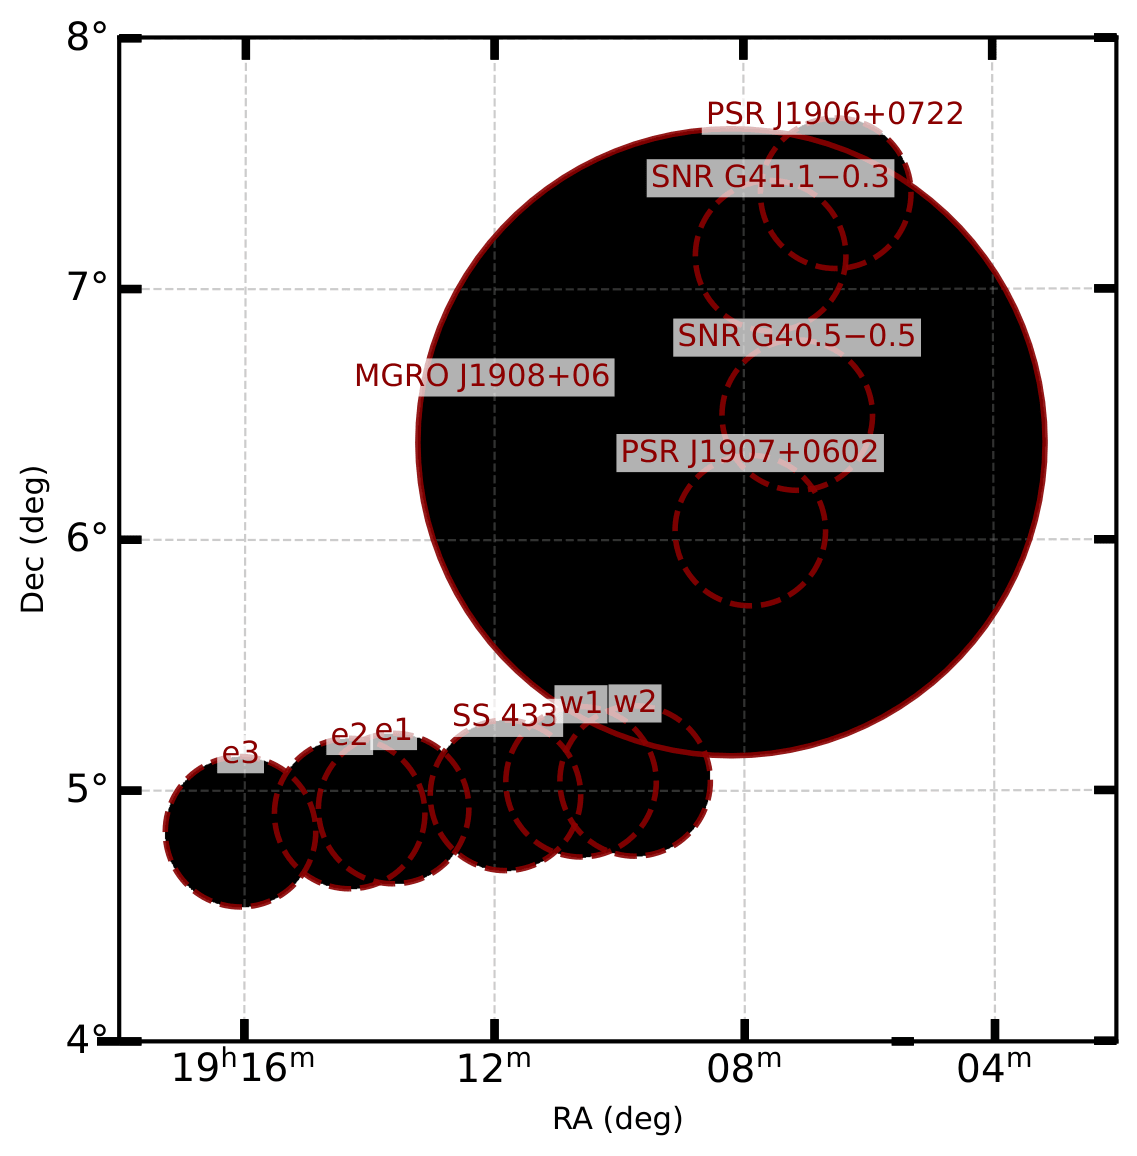
Figure 2: Exclusion mask used in the analysis. Red circles indicate regions around known sources and areas excluded from the analysis to avoid contamination. The large circle corresponds to MGRO J1908+06, while smaller circles mark pulsars, SNRs, and the SS 433 jet regions (e1, e2, e3, w1, w2).
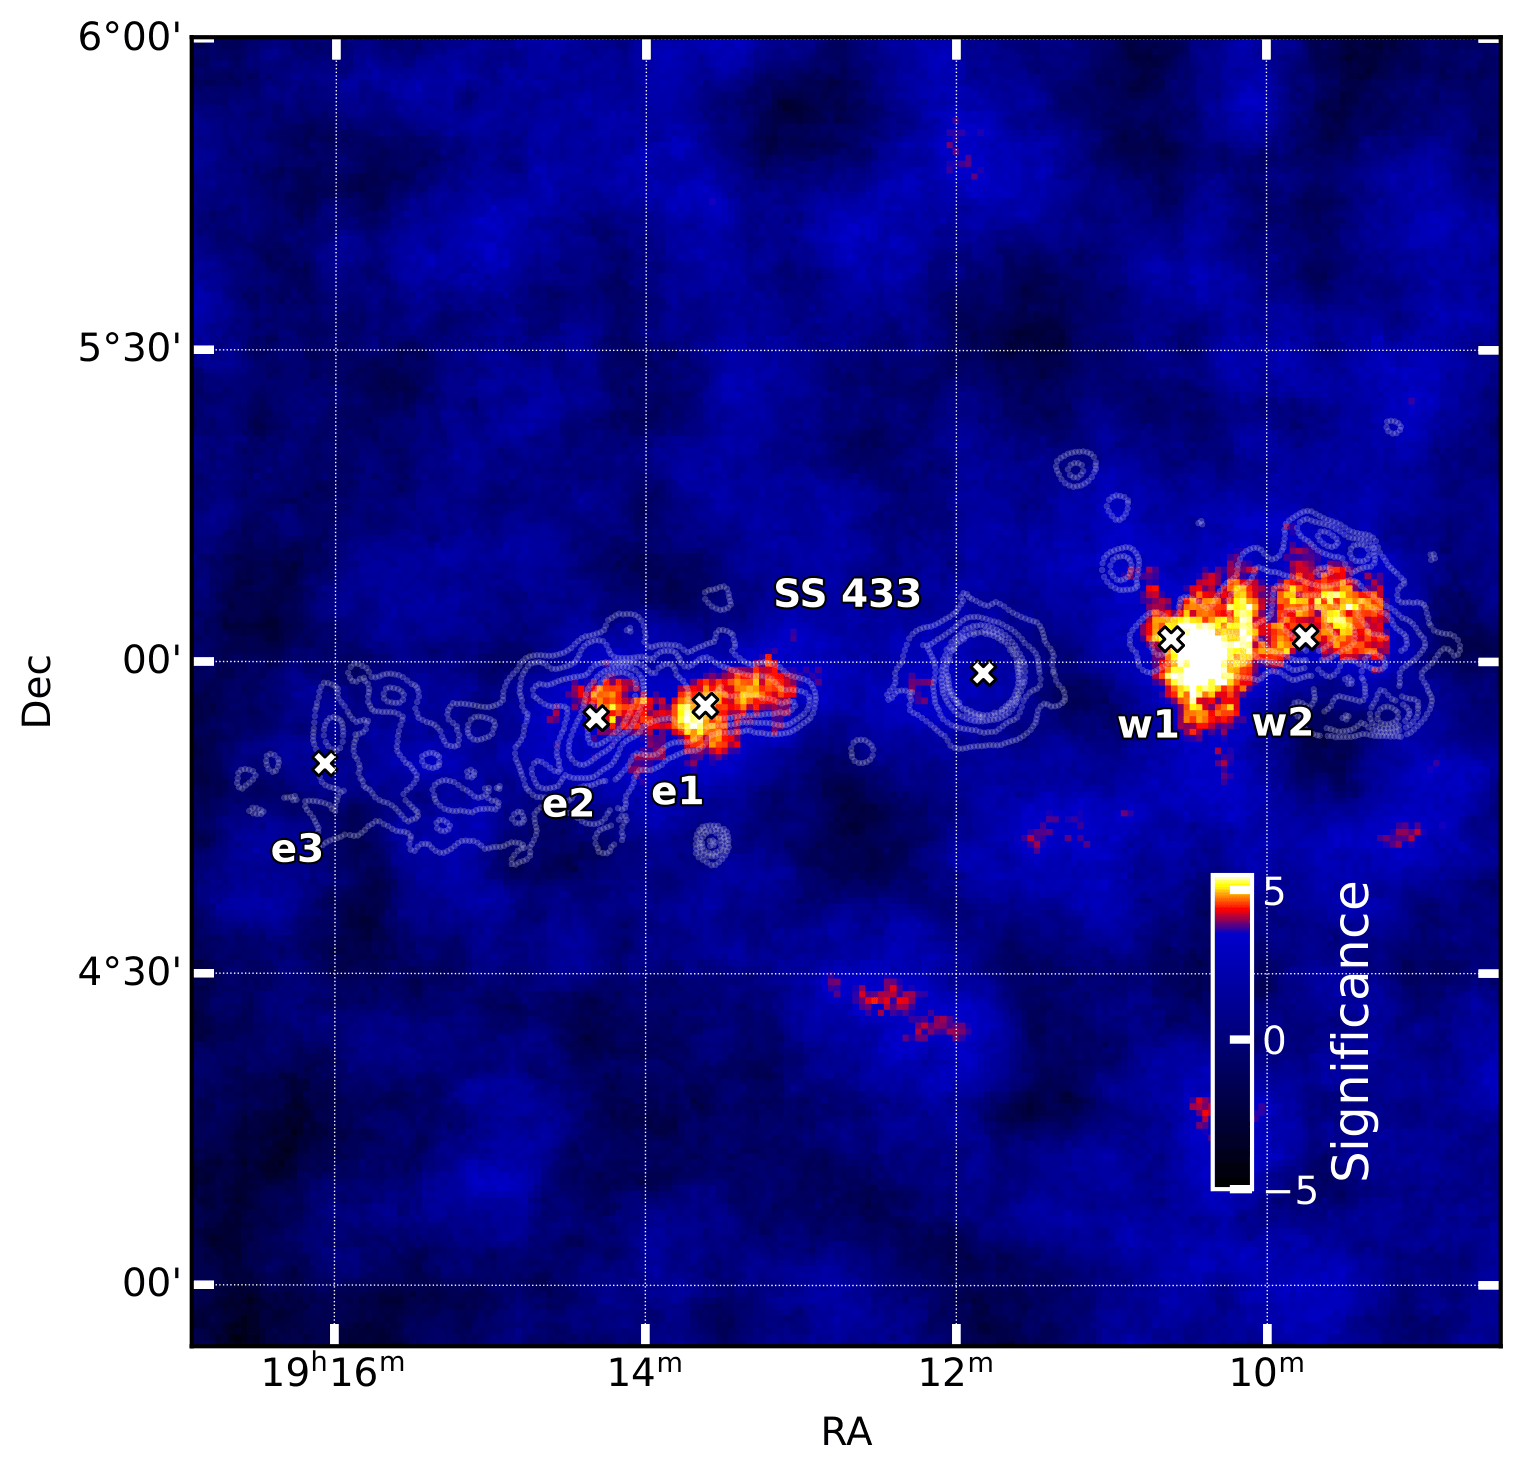
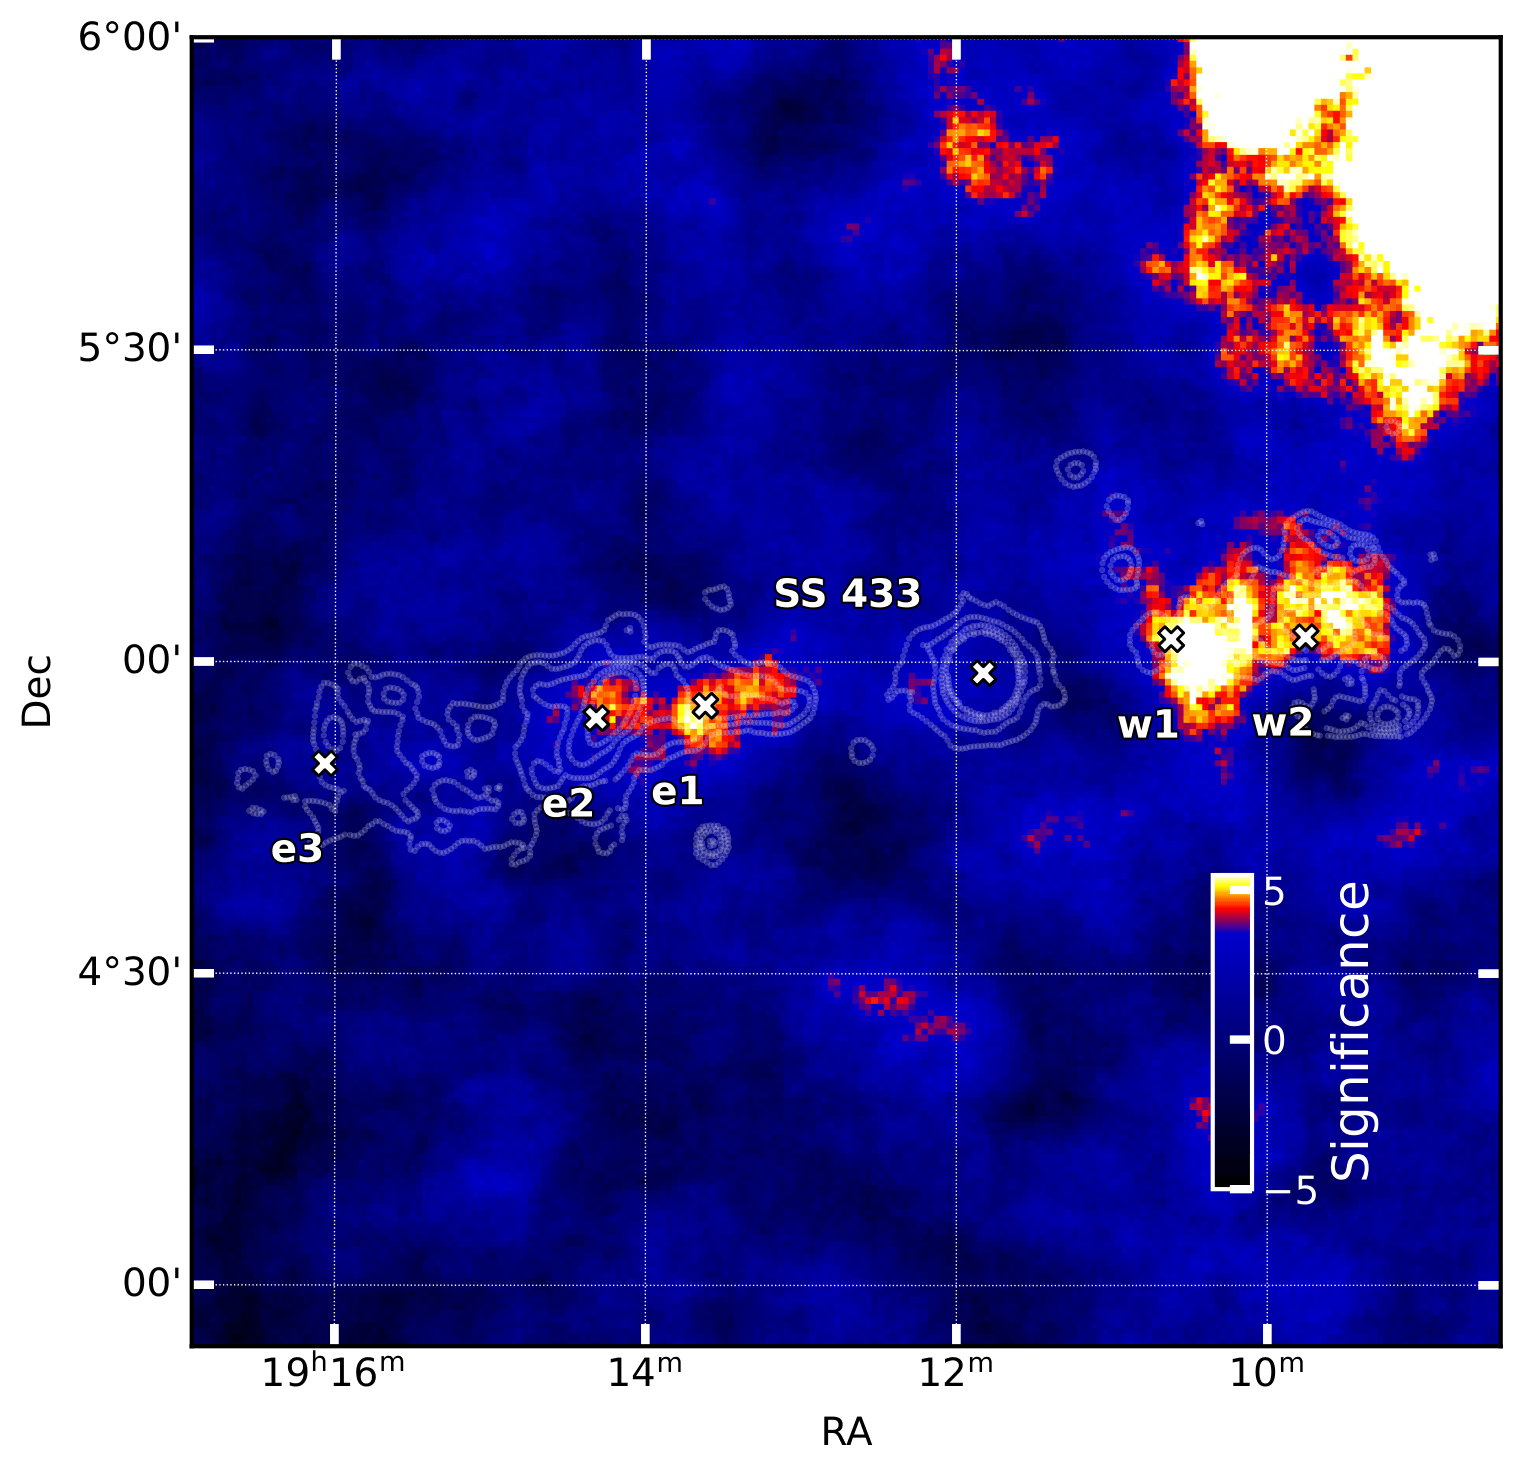
Figure 3: SS 433 significance map before (left) and after (right) subtraction of the MGRO J1908+06 best-fit model. White ROSAT X-ray contours (Brinkmann et al. 1996) are overlaid, and the eastern (e1, e2, e3) and western (w1, w2) jet emission regions, as well as the central binary (SS 433) position, are indicated by white crosses.
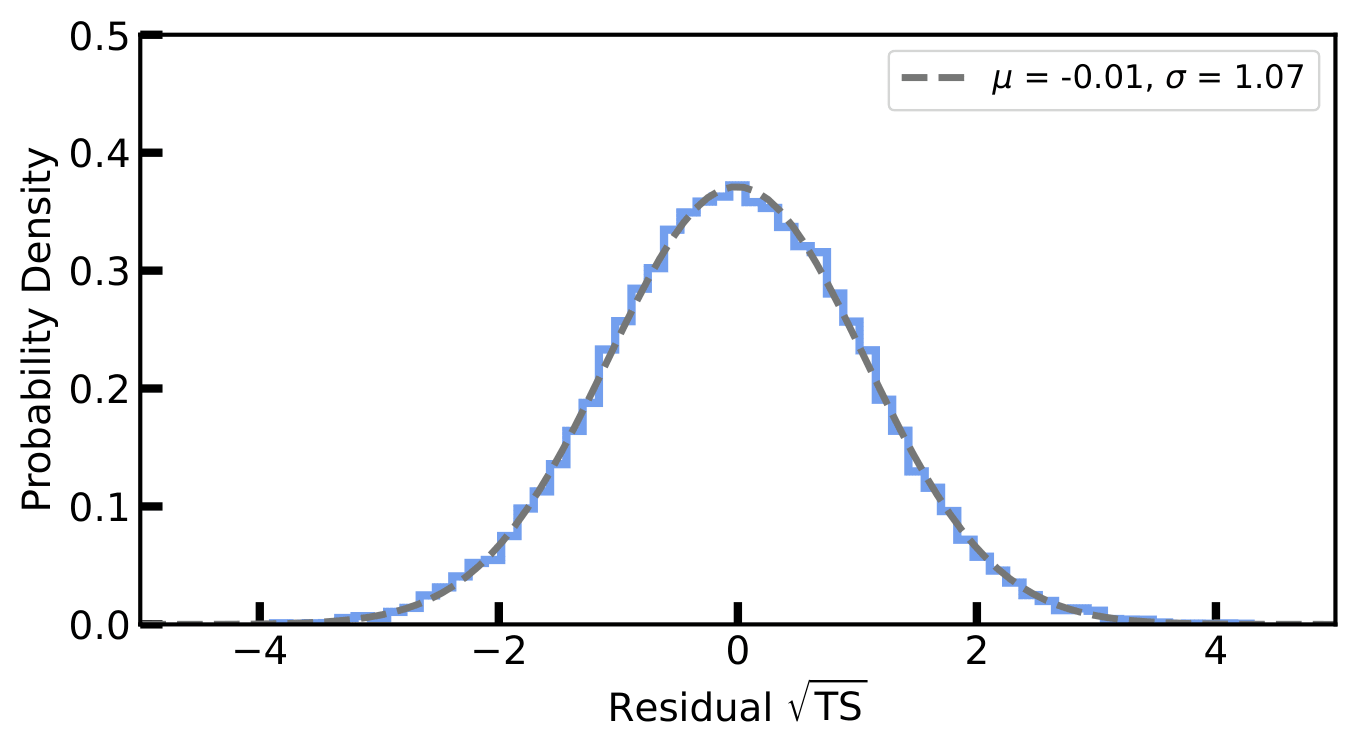
Figure 4: Residual √TS distribution obtained after sub tracting the best-fit models of SS 433 and MGRO J1908+06.
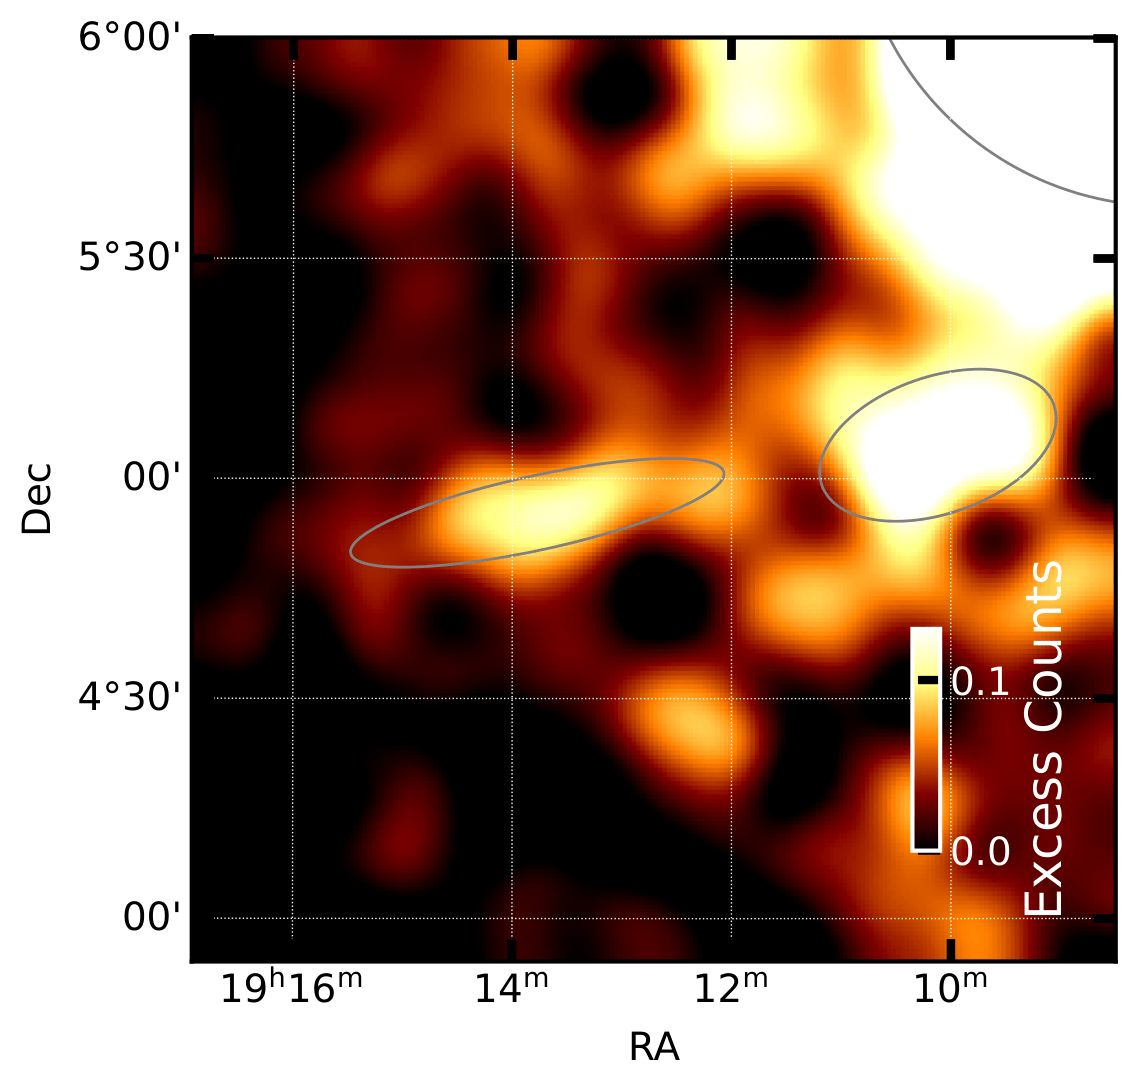
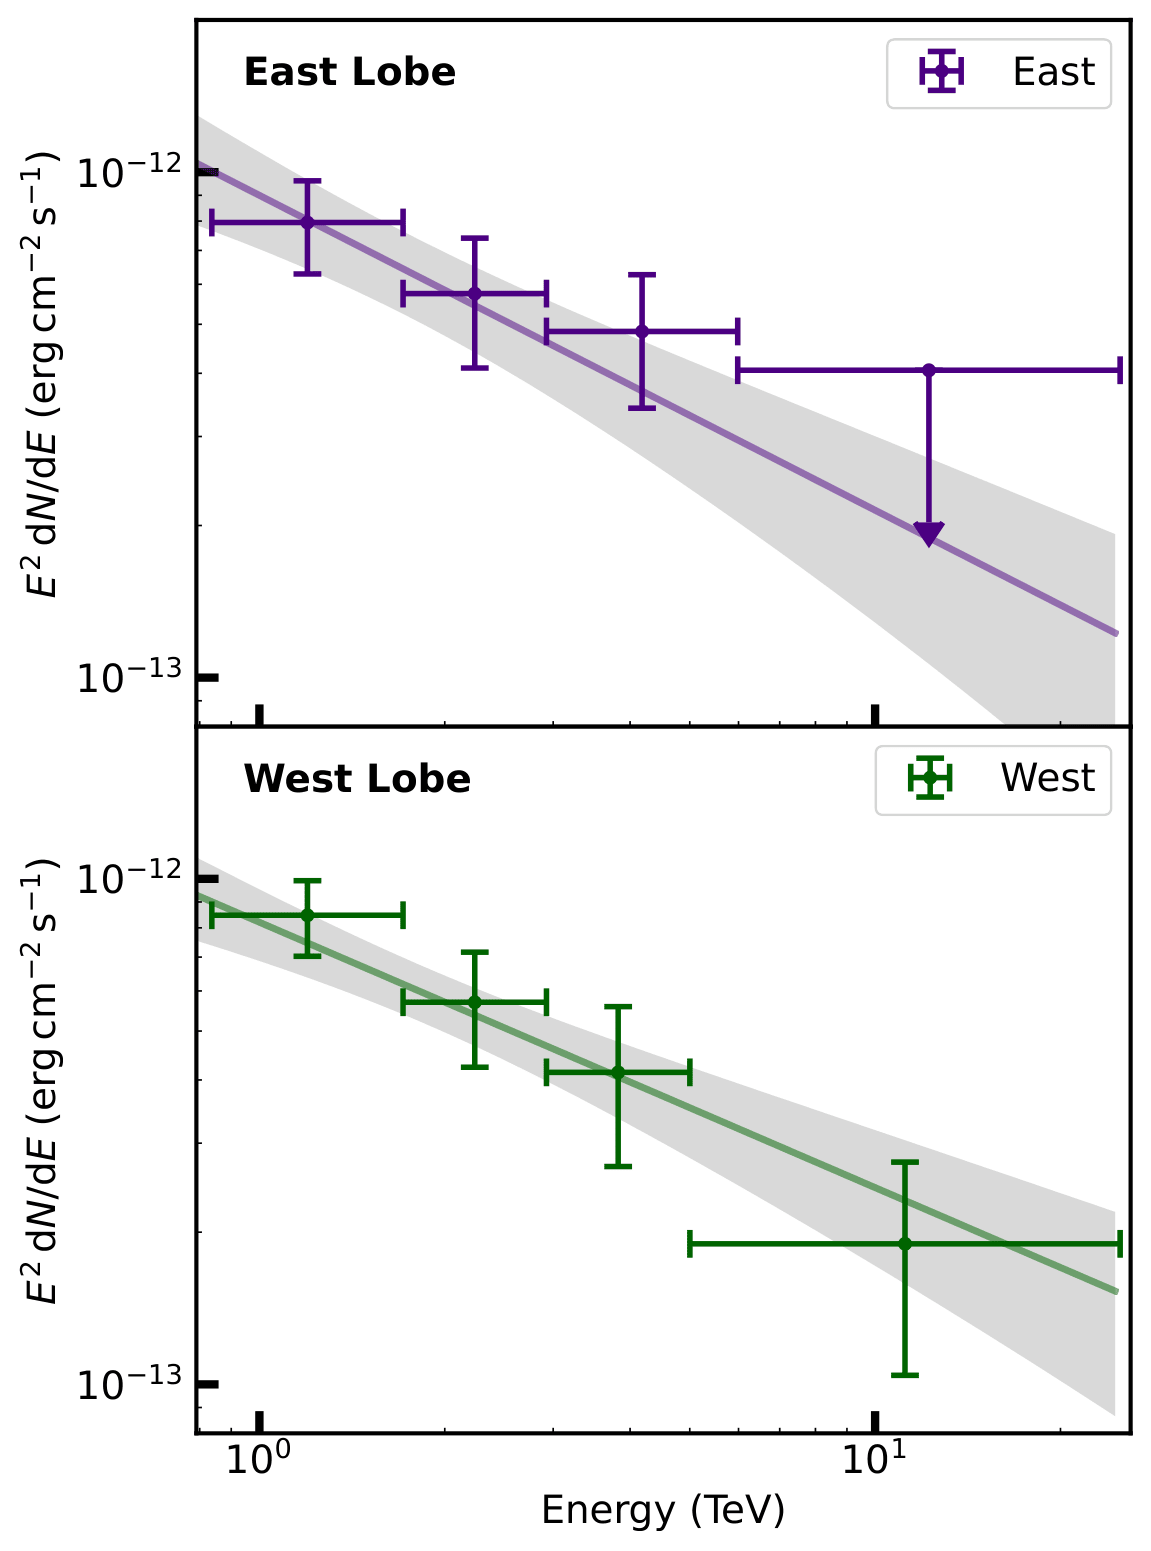
Figure 5: SS433 excess map with best fit model overlay (1σ contour).
Figure 6: Scatter plot to investigate the correlation between the best-fit X-ray photon index at 2 keV and the X-ray energy flux. The blue dashed line shows the best-fit linear model.
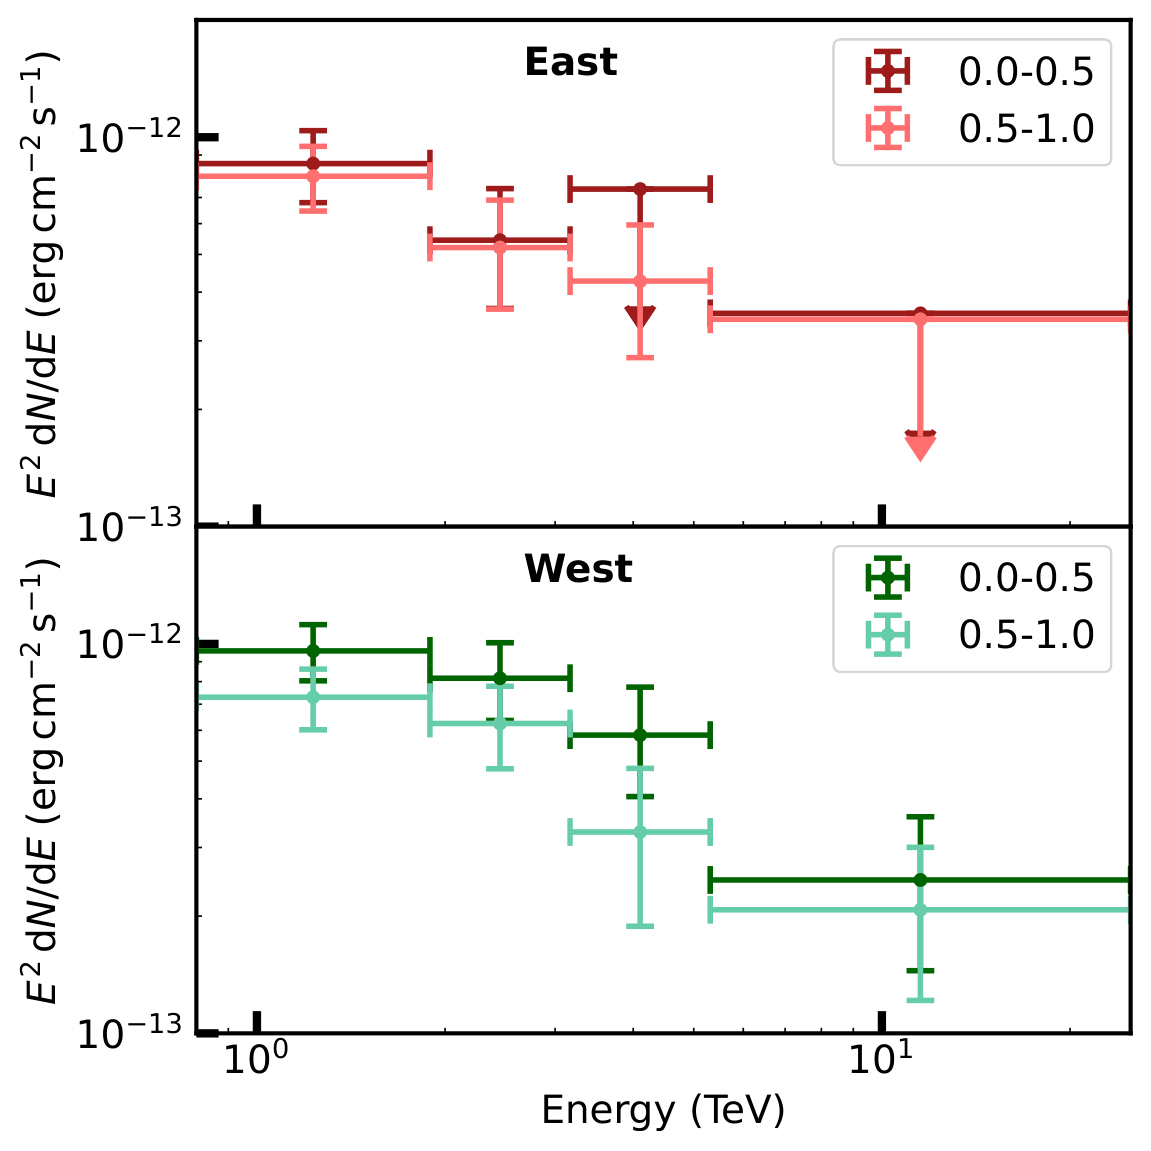
Figure 7: Comparison of the γ-ray flux of SS433 jet lobes across two precessional phase intervals (0.0–0.5 and 0.5–1.0). Top: eastern lobe; Bottom:western lobe.
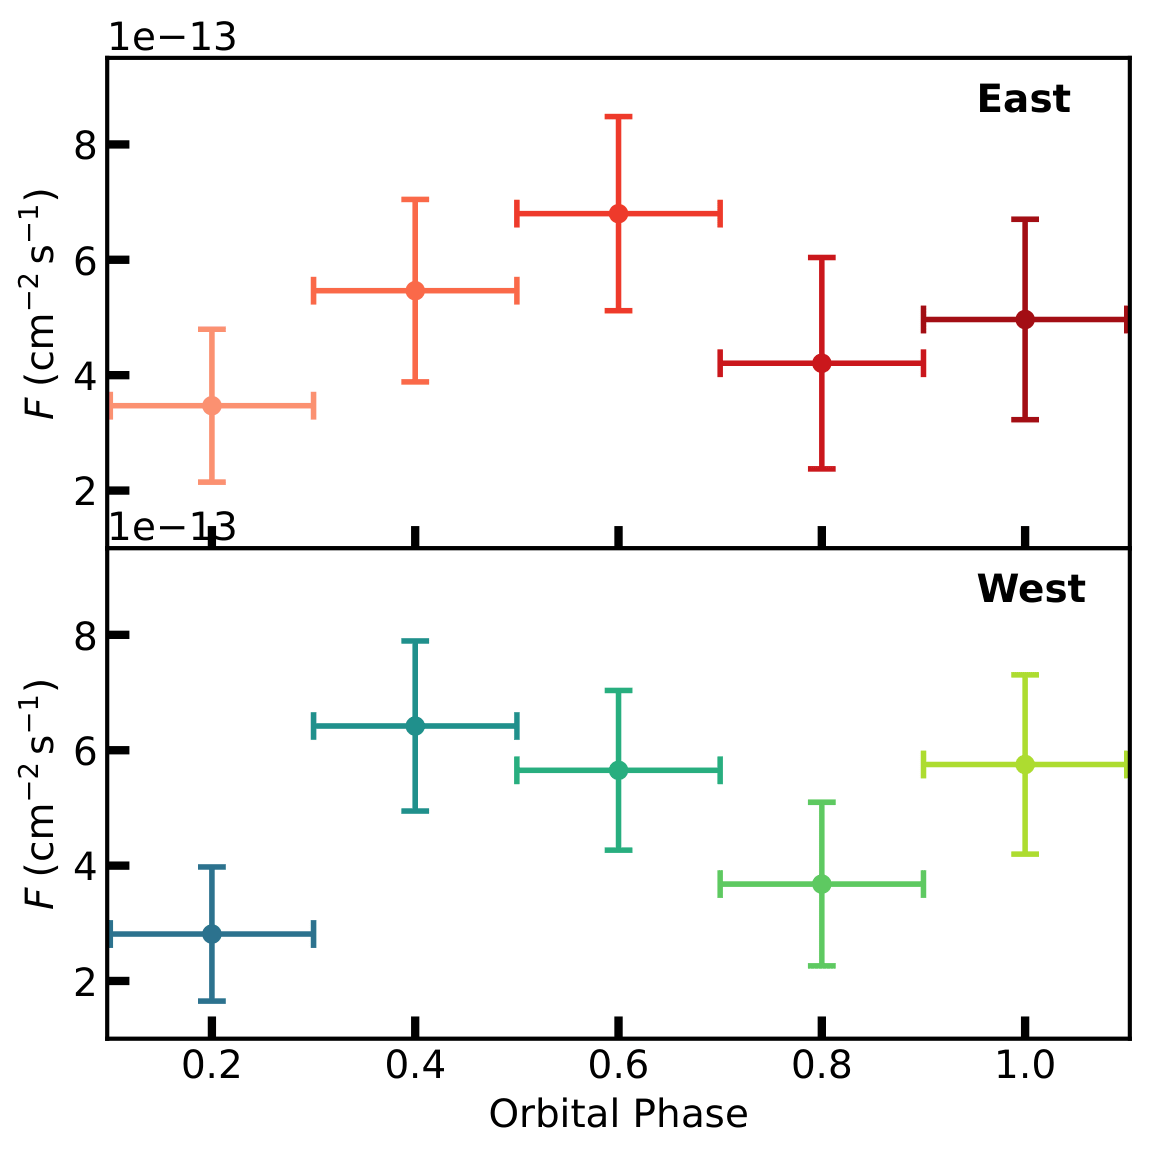
Figure 8: Phase-resolved integrated γ-ray fluxes above 0.8TeV of the SS433 jet lobes across five orbital phase bins (steps of 0.2). Top: eastern lobe; Bottom: western lobe.
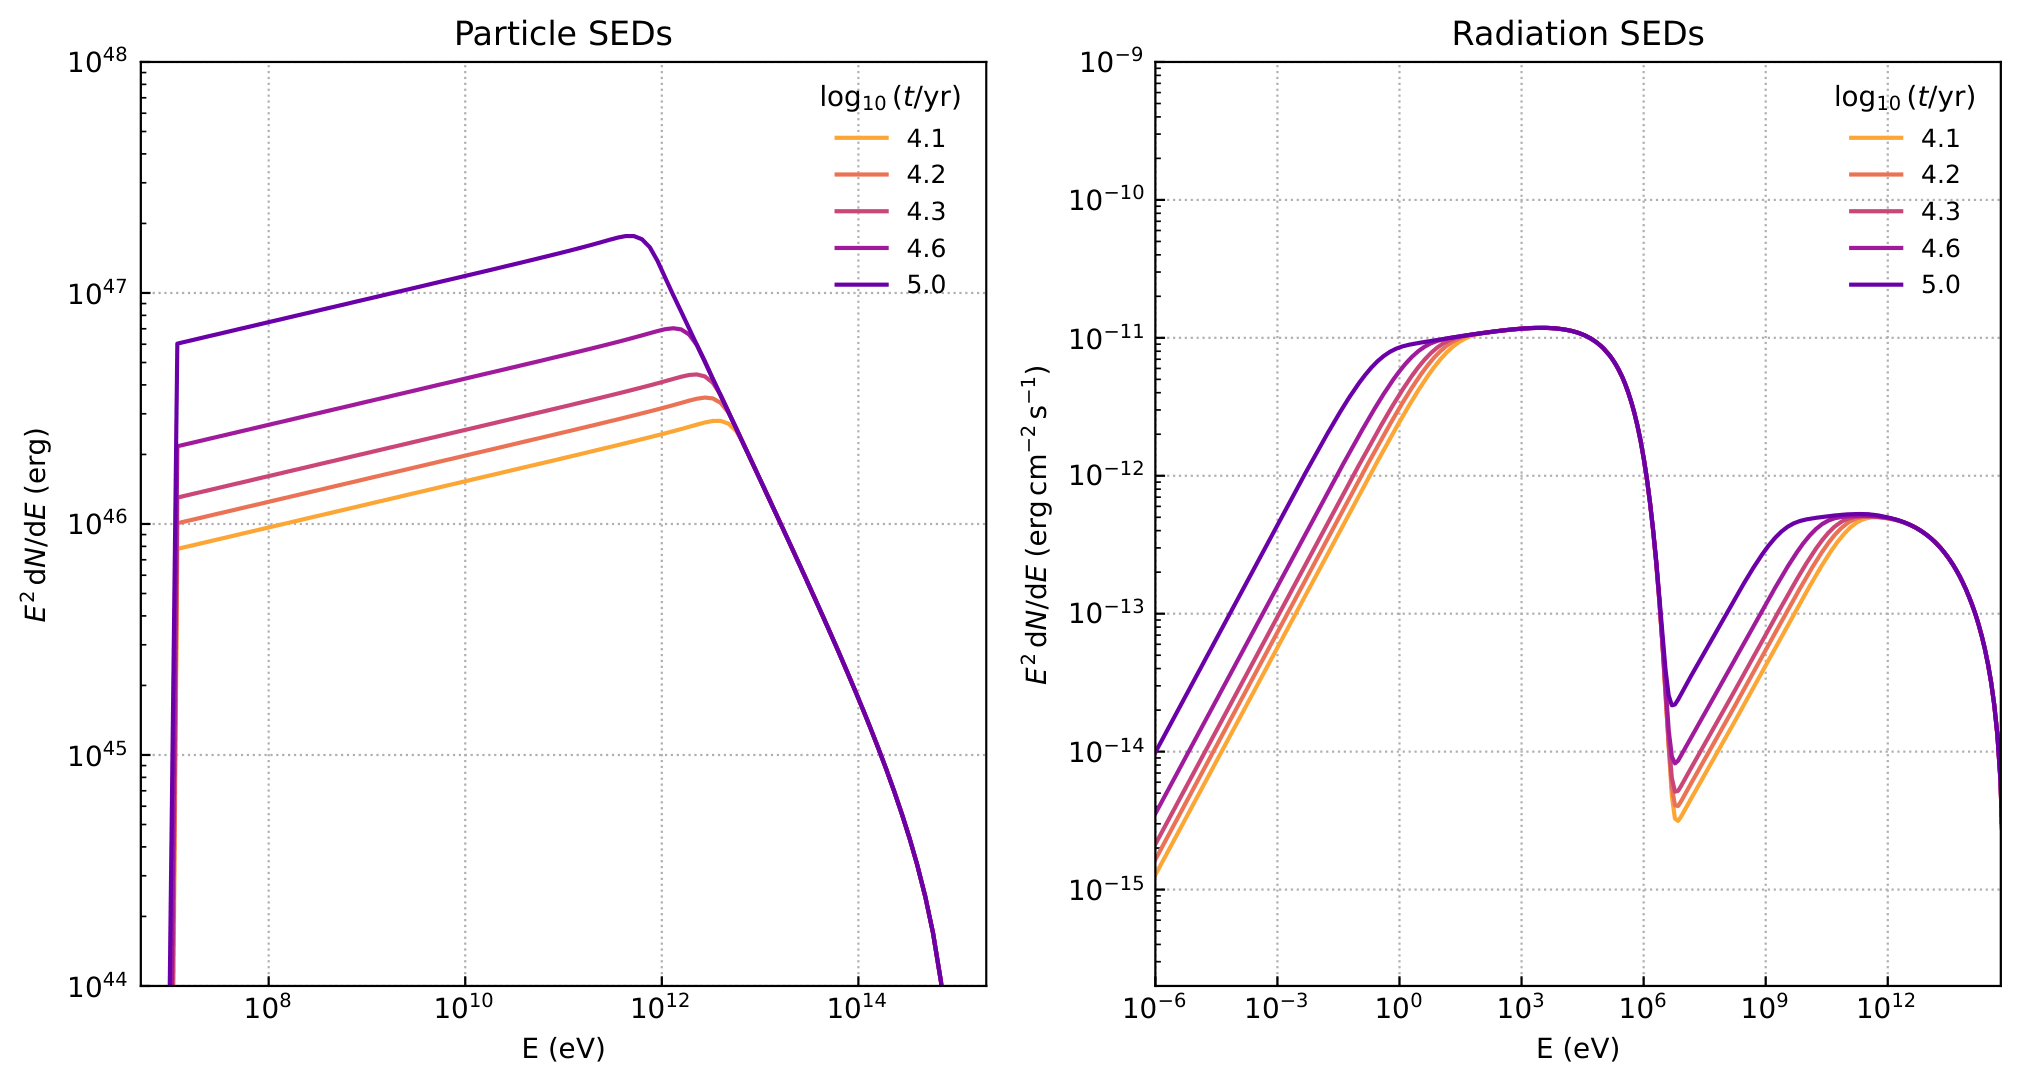
Figure 9: Calculations of the time evolution of the electron spectral energy densities and the corresponding radiation SEDs, shown for five logarithmically spaced time steps between 104 and 105 years. The radiation components include synchrotron and inverse Compton (IC) emission on ambient photon fields, with a negligible SSC contribution. Electrons are injected with a power-law spectrum of index α = 1.9 between 10 MeV and 1 PeV. The illustrated model assumes fixed environmental parameters representative of the computed scenario: CMB photon field with uCMB = 0.261 eV cm−3 and T = 2.7K, an FIR photon field with uFIR = 0.3 eV cm−3 and T = 20K, magnetic field B = 14µG, and an injection power of 1036ergs−1.
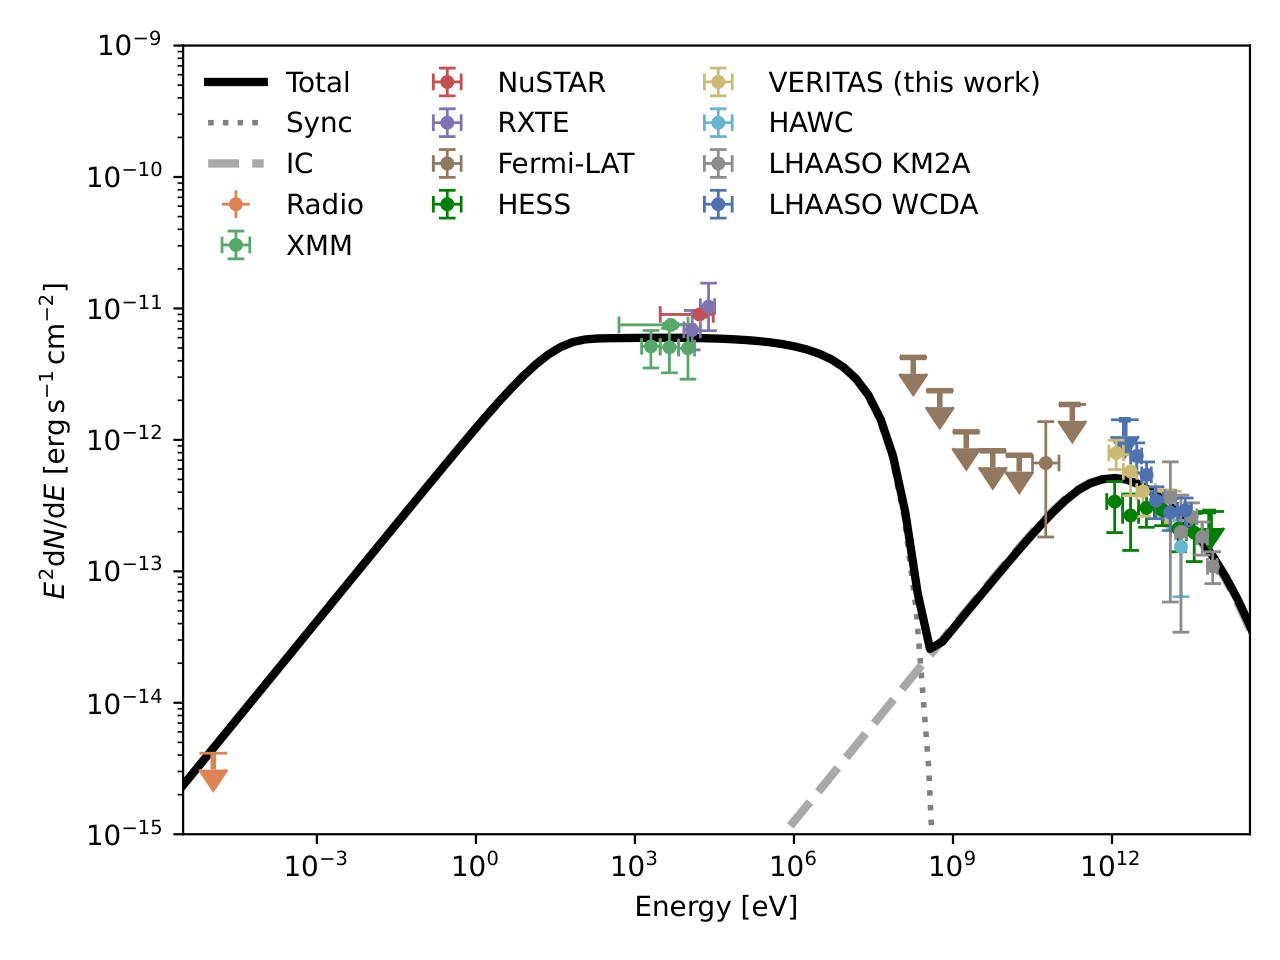
Figure 10: Multiwavelength spectral energy distribution of SS 433 eastern emission region, shown with a leptonic model. The observations are from radio (Geldzahler et al. 1980), soft X-ray (Brinkmann et al. 2007), hard X-ray (Safi-Harb et al. 2022; Safi Harb & Petre 1999), HE (Fang et al. 2020) and VHE VERITAS, H.E.S.S. (H.E.S.S. Collaboration 2024), HAWC (Abeysekara et al. 2018) and LHAASO (LHAASO Collaboration 2024). The VERITAS flux points include statistical and systematic errors. Electrons are injected with a power-law spectrum and they produce synchrotron radiation in the ambient magnetic field of the eastern jet emission region and high energetic photons via IC upscattering on the CMB and FIR photons. The spectrum corresponds to a source age of 5 · 104 yr..
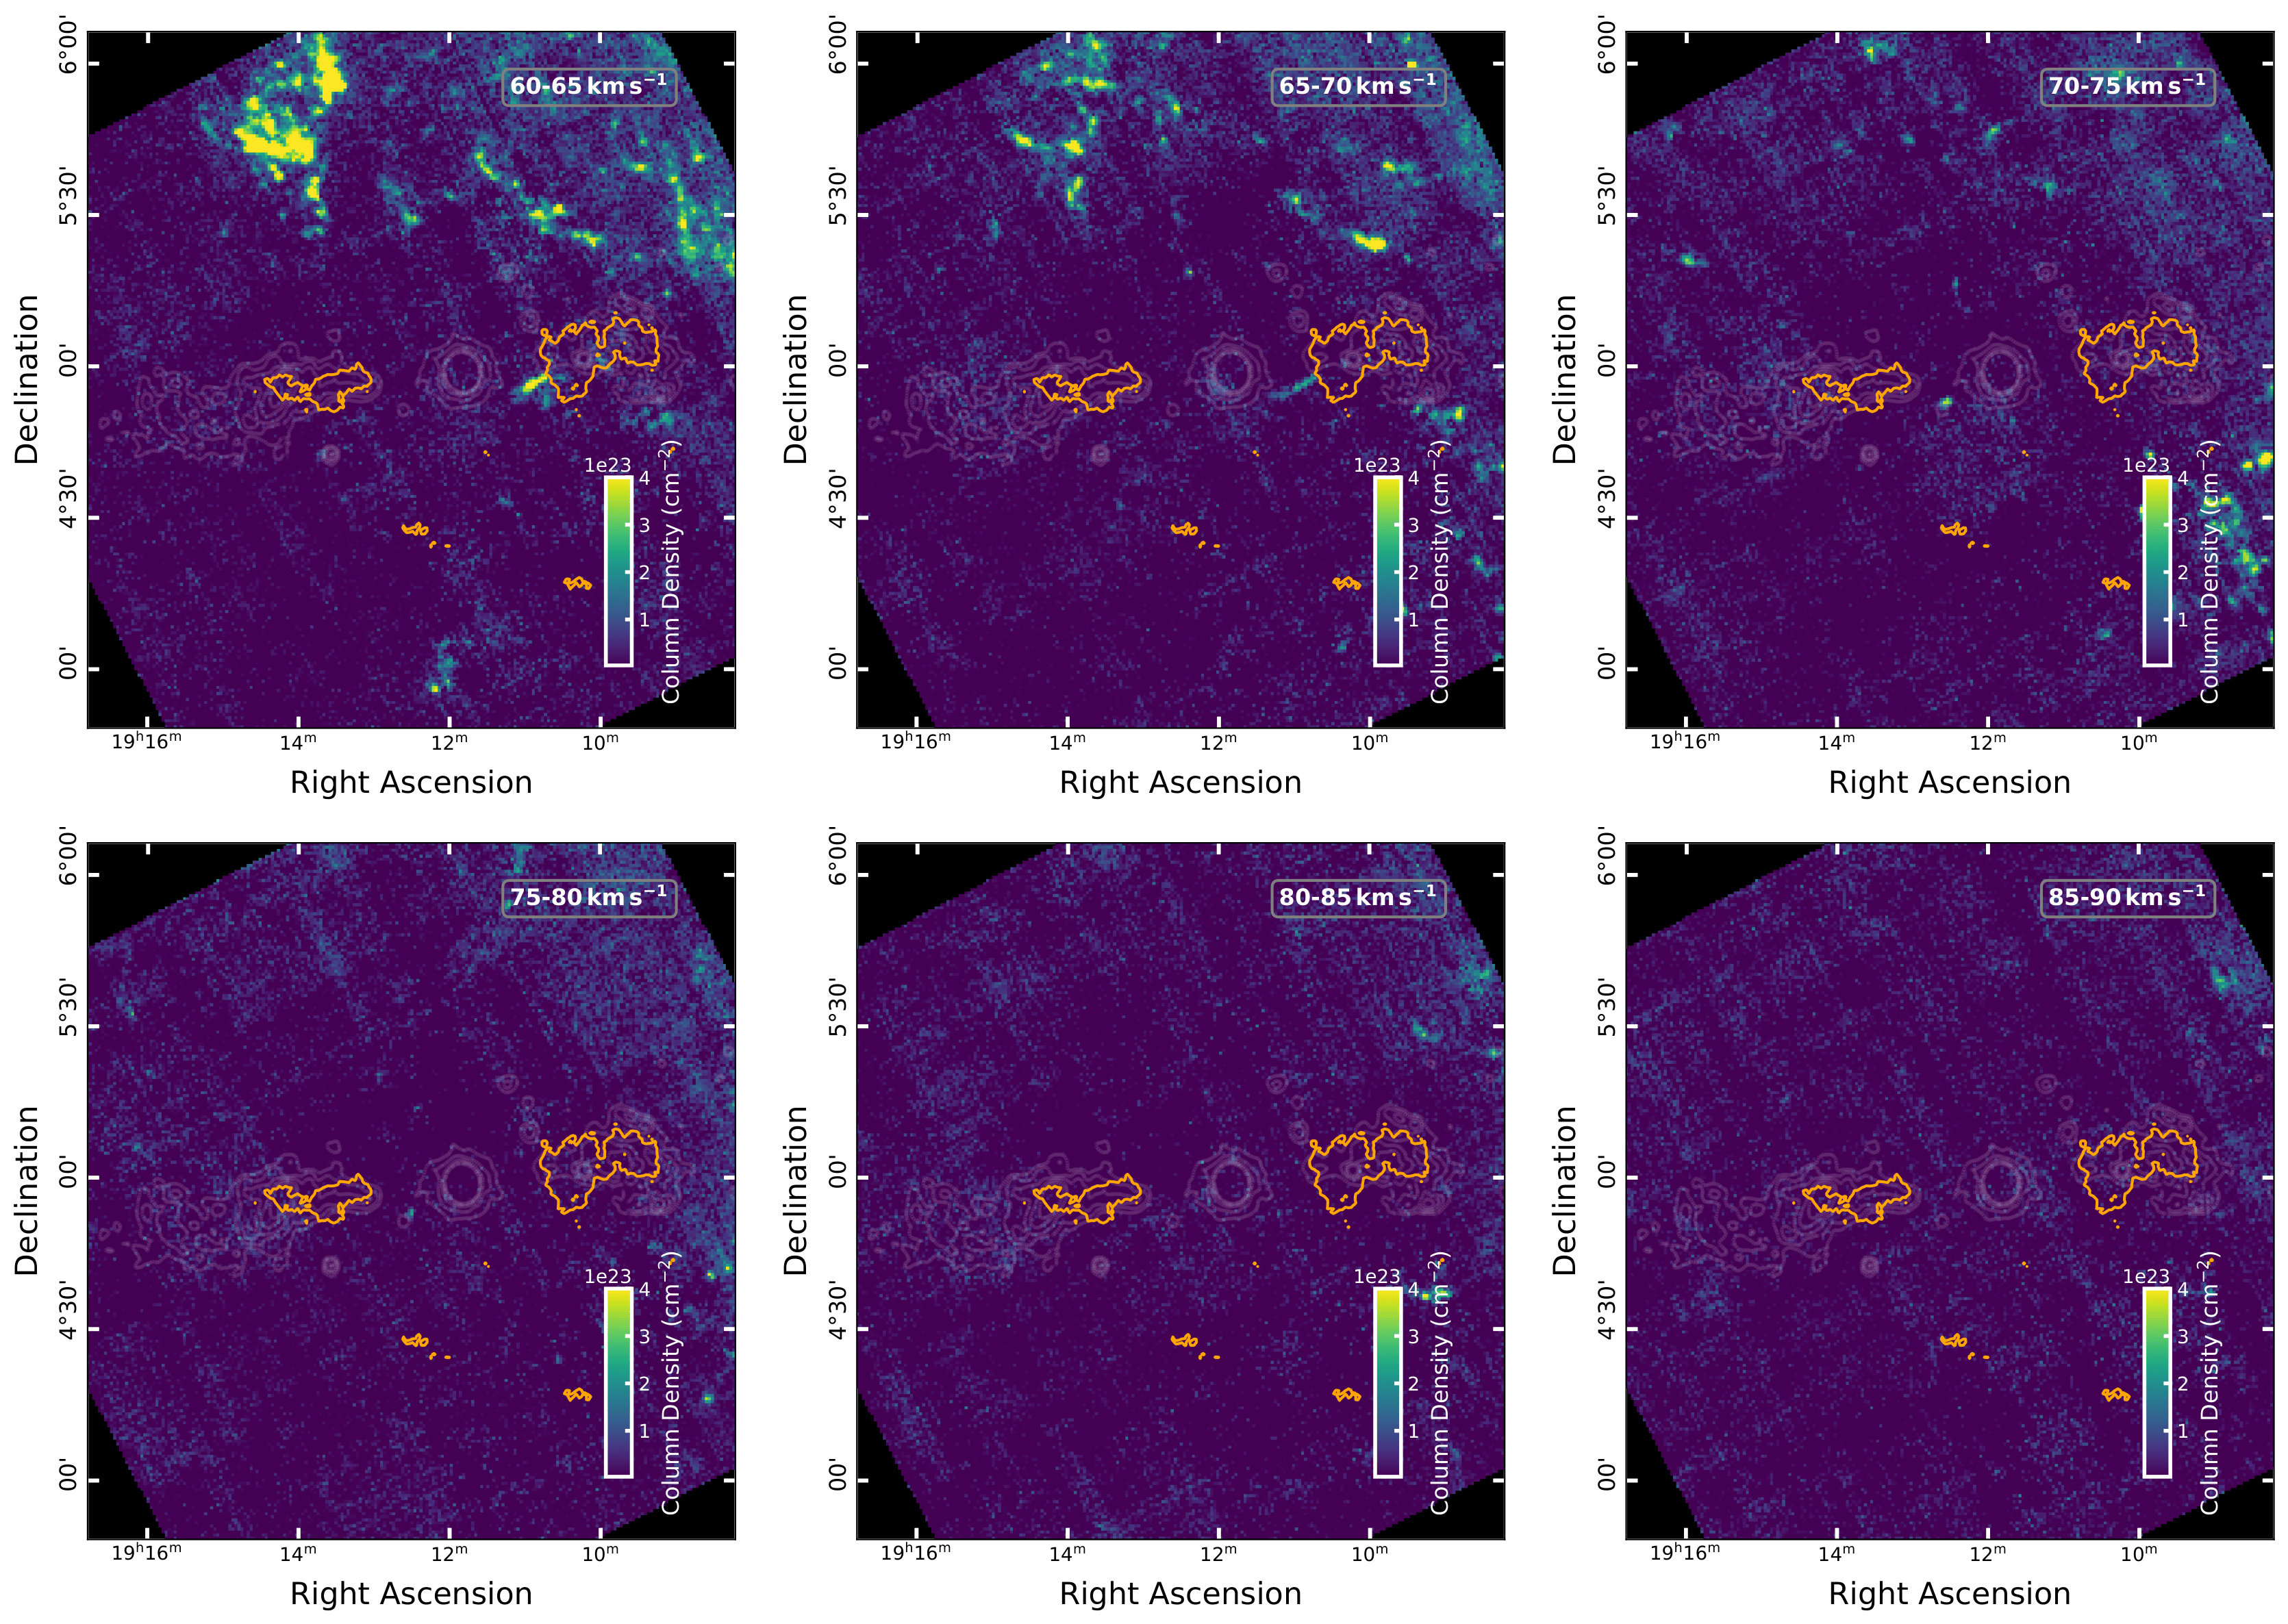
Figure 11: Column densities (cm−1) for spectroscopic data in the velocity bands (60−65) km s−1, (65−70) km s−1, (70− 75) km s−1, (75−80) km s−1, (80−85) km s−1 and (85−90) km s−1 from 12CO. VERITAS 4σ contours in orange are overlaid on ROSAT X-ray contours in grey (Brinkmann et al.1996). Data by the MWISP project (Su et al. 2019).
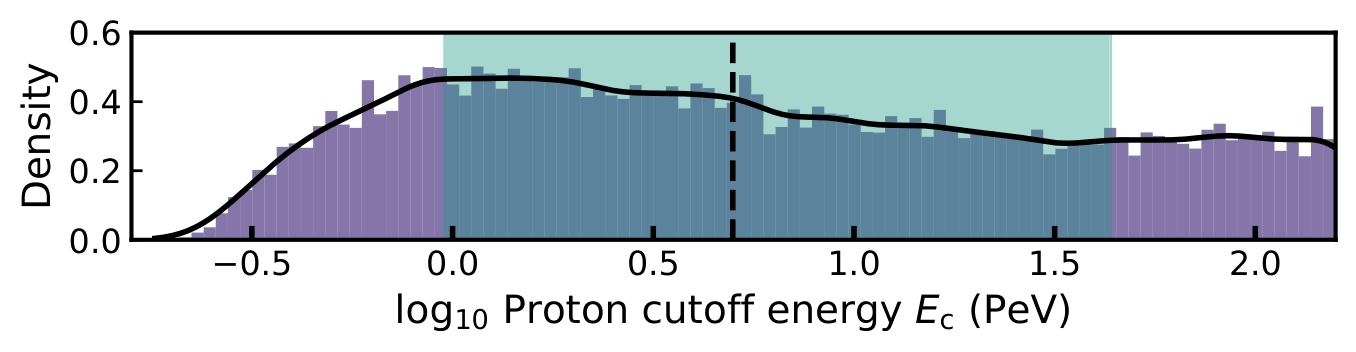
Figure 12: Posterior distribution of the proton cutoff energy Ec. The vertical line marks the median (50th percentile, 5 PeV), and the light green band shows the 16th–84th per centiles; the high-energy tail is largely unconstrained.