In September 2017, a high-energy neutrino event detected by the IceCube Neutrino Observatory (IceCube-170922A) was associated, at the 3σ level, with a gamma-ray flare from the blazar 51 TXS 0506+056. Cosmic rays that are accelerated in astrophysical sources can escape from their jets and interact with background radiation fields. Interactions with the extragalactic background light can produce pions and hence neutrinos, while interactions with the cosmic microwave background predominantly drive inverse Compton scattering, contributing to electromagnetic cascades in intergalactic space. The resulting secondary gamma-ray emission can be detected with high-energy gamma-ray telescopes. Here, we report on a new search for such cosmogenic cascade emission from the blazar TXS 0506+056, using a combined data set from the Fermi–Large Area Telescope and VERITAS. We compare the gamma-ray spectrum and neutrino observations with the predictions of cosmic-ray induced cascades in intergalactic space. The observed gamma-ray spectrum is modeled as a combination of the primary spectrum and the cascade spectrum. We apply a Monte Carlo simulation with a ∆χ2 -based likelihood analysis to jointly determine the best-fit parameters of a proton emission spectrum describing the data and derive constraints on the proton escape luminosity. Assuming a log-parabola primary photon spectrum, we find consistency with a proton injection spectral index of αp ≃ 2.0 and a cutoff energy of Ep,max ≃ 1.3 × 10¹⁶ eV, and constrain the isotropic proton escape luminosity to 1×1044 erg s−1 ≲ Lp,esc ≲ 3×1045 erg s−1 at the 90% confidence level.
Figure 1: Multiwavelength lightcurves of TXS 0506+056 between MJD 54683 and MJD 60218, which corresponds to midnight on August 4, 2008 until midnight on October 1, 2023. The blue narrow band corresponds to the IceCube alert, IceCube-170922A, observed on September 22, 2017 (MJD 58018). The orange shaded region corresponds to the time interval between September 23, 2017 and February 6, 2018, investigated in Abeysekara et al (2018). (A) Monthly-binned VHE lightcurve for VERITAS observations above an energy threshold of 190 GeV. Upper limits at 95% confidence level are quoted for observations with a significance of lower than 2σ. (B) Fermi-LAT lightcurve in 30 day bins in the 0.1–300 GeV band. (C) Swift-XRT energy flux in the 0.3–10 keV band. (D and E) Optical/UV flux observations with the Swift-UVOT in the UW1, UW2, UM2, U, B, and V band filters, split into the UV and optical components for enhanced readability.


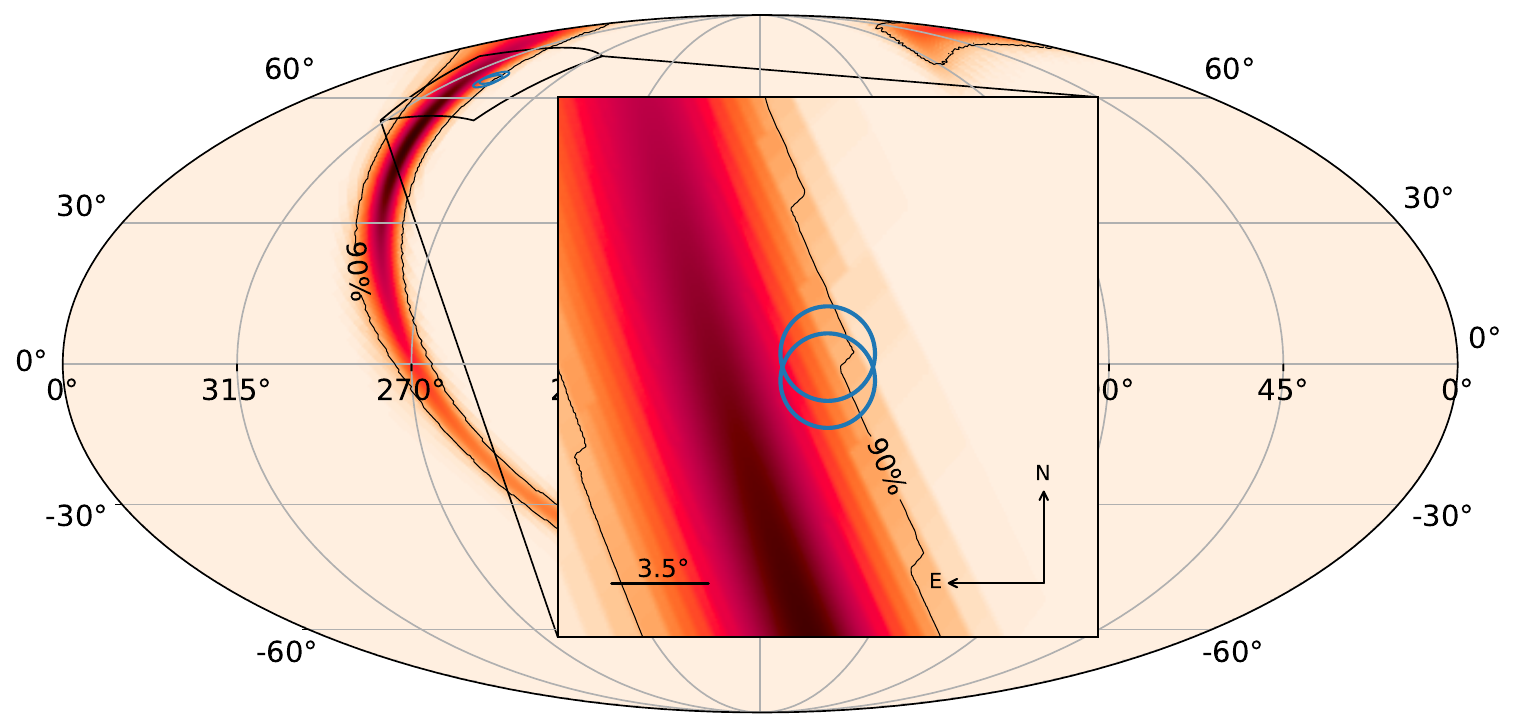
Figure 2: The simulated photon cascade flux per solid angle for the best-fit spectrum i.e the subdominant cascade, assuming a LP × EBL primary photon spectrum (top) and PLE × EBL primary photon spectrum (bottom). The values assumed for the maximum blazar activity time and magnetic field are tmax = 6 months and B = 10−16G respectively. The pink dotted line indicates the 90% confidence-level region for the neutrino event IceCube-170922A (from IceCube Collaboration et al. (2018b)). The green, cyan, and purple dashed lines represent the PSFs of the VERITAS and the Fermi-LAT observations and the VERITAS OFF region, respectively.


Figure 3: The observed Fermi-LAT and VERITAS spectra of TXS 0506+056 (red and magenta markers, respectively), together with the total best-fit spectrum (dashed blue line, including uncertainties). This is the sum of the primary photon spectra LP × EBL (top) and PLE × EBL (bottom) (dashed green lines, including uncertainties) and the cascade components (dashed orange lines, including uncertainties) respectively. Spectral points are shown as upper limits if the detection significance is below 2σ. The SEDs of the predicted cosmogenic neutrinos is shown in black. The spectral curves for the proton cascades and the neutrino spectrum correspond to the best-fit proton injection spectral parameters when considering a LP × EBL primary photon spectrum and PLE × EBL primary photon spectrum respectively (see Table. 1). The values assumed for the maximum blazar activity time and magnetic field are tmax = 6 months and B = 10−16G respectively. Also shown are the representative neutrino flux upper limits that produce on average one detection like IceCube-170922A over a period of 0.5 and 7.5 years assuming an injection spectrum of dN/dE ∝ E−2 at the most probable neutrino energy, Eν = 311 TeV (IceCube Collaboration et al. 2018b).


Figure 4: The stats-surfaces obtained over the investigated parameter space of the proton spectrum, Ep,max and αp, assuming a LP × EBL primary photon spectrum (top) and PLE × EBL primary photon spectrum (bottom). The values assumed for the maximum blazar activity time and magnetic field are tmax = 6 months and B = 10−16G respectively. The color scale denotes the ∆χ2 , the difference between the χ2 values at each point and the minimum χ2 value obtained over the entire parameter space. The blue stars mark the best-fit parameter combination corresponding to the global minimum χ2 , and listed in Table 1. The dashed purple curves show 2σ uncertainty contours. The dashed green curves represent points in the parameter space which correspond to the same proton escape luminosity, as labeled. The dark green curves mark the lower and upper bounds on the proton escape luminosity, denoted as Lmin and Lmax, respectively and shown in the legend.

Figure 5: The ∆χ2 values obtained as a function of the proton escape luminosity Lp,esc. The high-energy cut-off is fixed at Ep,max = 3.6×10¹⁷ eV and the proton spectral index are fixed in the interval αp ∈ [1.8, 2.6] at intervals of 0.1.

