This paper investigates the origin of the gamma-ray emission from MGRO J1908+06 in the GeV-TeV energy band. By analyzing the data collected by Fermi-LAT, VERITAS, and HAWC, with the addition of spectral data previously reported by LHAASO, a multiwavelength (MW) study of the morphological and spectral features of MGRO J1908+06 provides insight into the origin of the gamma-ray emission. The mechanism behind the bright TeV emission is studied by constraining the magnetic field strength, the source age and the distance through detailed broadband modeling. Both spectral shape and energy-dependent morphology support the scenario that inverse-Compton (IC) emission of an evolved pulsar wind nebula (PWN) associated with PSR J1907+0602 is responsible for the MGRO J1908+06 gamma-ray emission with a best-fit true age of T=22± 9 kyr and a magnetic field of B=5.4 ± 0.8 G, assuming the distance to the pulsar d =3.2 kpc.
Figure 1: VERITAS γ-ray significance map in the energy range [0.5, 7.9] TeV. The black cross indicates the location of PSR J1907+0602, and the black circles outline the shell sizes of the SNRs in the region, including (middle) G40.5- 0.5, (top) G041.1-00.3, and (bottom) G039.2-00.3. The red dashed circle shows the region of interest in which the VERITAS spectrum is extracted from, and the red dashdot circle shows the best-fit Gaussian radius in the Fermi–LAT data. The color scale is limited to a range of (−5, +5).


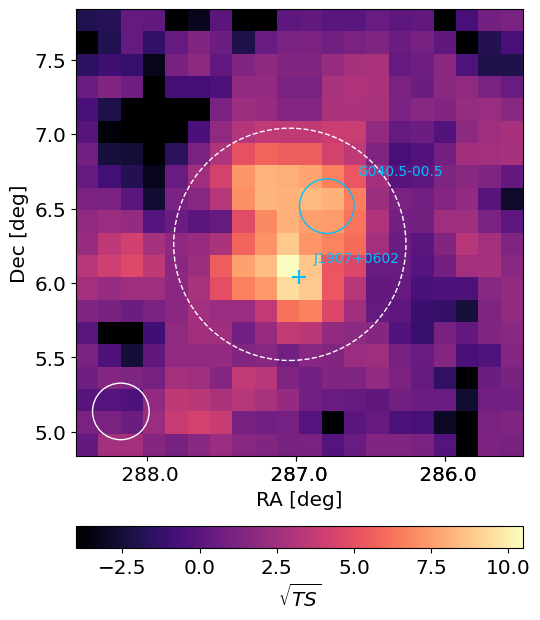
Figure 2: (a) Fermi–LAT γ-ray residual map in the energy range [30, 300] GeV overlaid with a white dashed circle showing the 95.5% containment of the γ-ray photons. (b) VERITAS γ-ray residual map in the energy range [0.5, 2.0] TeV overlaid with a white dashed circle showing the extraction region of the γ-ray spectrum. (c) VERITAS γ-ray residual map in the energy range [2.0, 7.9] TeV overlaid with a white dashed circle showing the extraction region of the γ-ray spectrum. The sky-blue cross indicates the location of PSR J1907+0602, and the sky-blue circle outlines the shell size of SNR G40.5-0.5. The white solid circles indicate the size of PSF of the corresponding instrument. The coordinates are in J2000 equatorial degrees.

Figure 3: The multiwavelength spectrum of MGRO J1908+06. The red points represent the data in this work for Fermi–LAT data in [30, 300] GeV, the purple points represent VERITAS data in [0.5, 7.9] TeV, the lime green points represent H.E.S.S. data (Kostunin et al. 2021), the golden points represent HAWC data in [1.1, 246] TeV, and the sky blue points represent LHAASO data in [10, 625] TeV (Cao et al. 2021, 2023). The Fermi–LAT data are truncated at 300 GeV because of the low statistics at the higher energies.
Figure 4: HAWC γ-ray significance map in the energy range (a) [3.16, 10] TeV, (b) [10, 31.6] TeV, and (c) [31.6, 100] TeV, overlaid with the white a dashed circle showing the 95.5% containment of the γ-ray photons in each energy range. The sky-blue cross indicates the location of PSR J1907+0602, and the sky-blue circle outlines the shell sizes of the SNR G40.5-0.5. The white solid circles indicate the size of PSF of the HAWC instrument in the corresponding energy range. The coordinates are in J2000 equatorial degrees.
Figure 5: The measured energy fraction sum χe + χB as a function of the pulsar true age and distance to the pulsar, and the distance estimation derived from a dispersion measure (Abdo et al. 2010) is shown as the white horizontal dashed line. The solid boundaries are derived from the upper and lower limits on the pulsar spin-down time scale, τ0 ∈ [0.72, 12] kyr, and the diagonal dashed curve is derived from a medium value of τ0 = 3 kyr.

Figure 6: The MW SED data overlaid with the spectra of various emission models. The blue arrow represents the XMMNewton upper limit (Li et al. 2021) scaled by a factor of 2.4 to match the XMM analysis region to the γ-ray morphology at 1 TeV, the green points represent Fermi–LAT data in [0.4, 2.8] GeV (Li et al. 2021), the red points represent Fermi–LAT data in [30, 300] GeV (this work), the purple points represent VERITAS data in [0.5, 7.9] TeV (this work), the golden points represent HAWC data in [1.1, 246] TeV (this work), and the sky blue points represent LHAASO data in [10, 625] TeV (Cao et al. 2021, 2023). The green curves show the leptonic emission (synchrotron and inverse Compton) spectra produced by a PWN for different distance scenarios, the red curves show the hadronic emission (pion decay) produced by a SNR with a fixed SN energy 1.0 × 1051 erg for different distance scenarios assuming a gas density of 1 cm−3 , and the blue curves represent the combined (synchrotron + inverse Compton + pion decay) spectra.
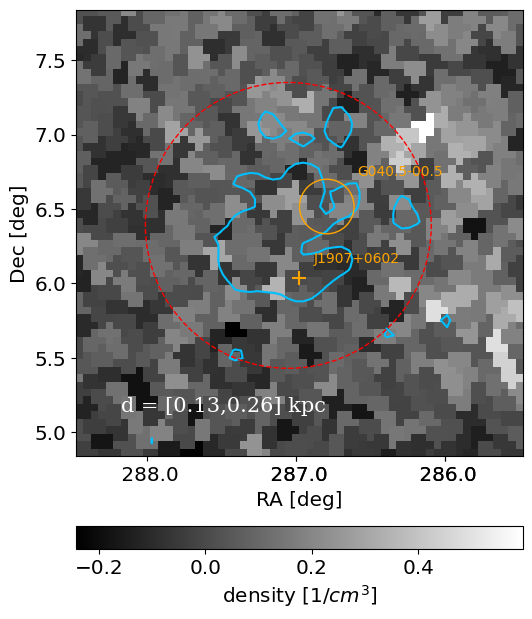
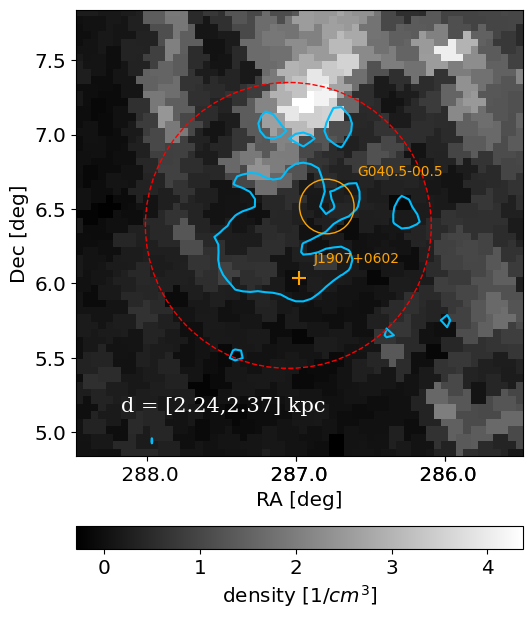
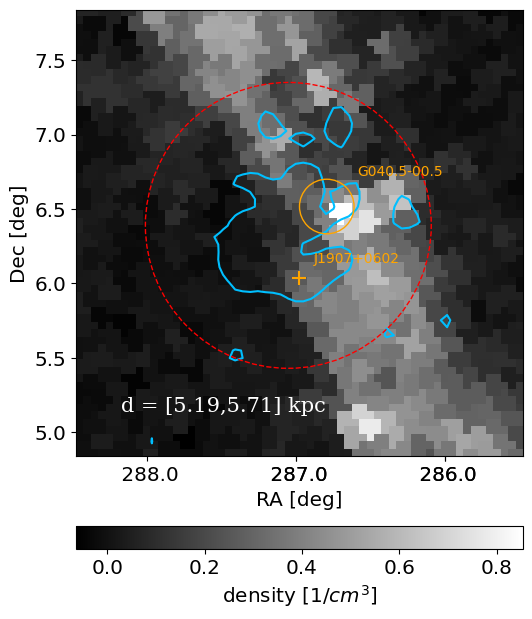
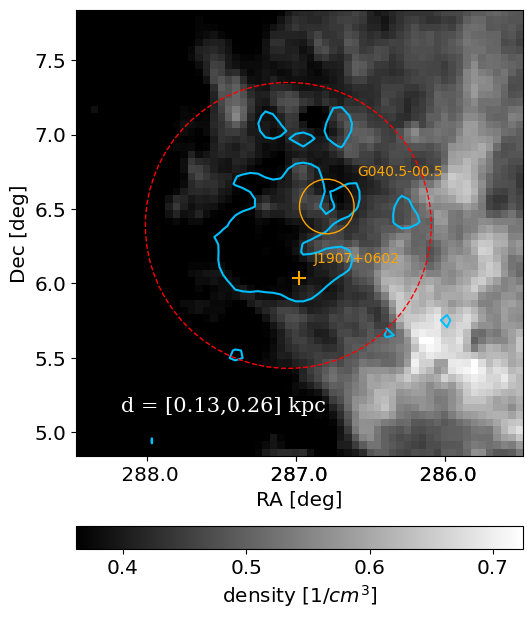
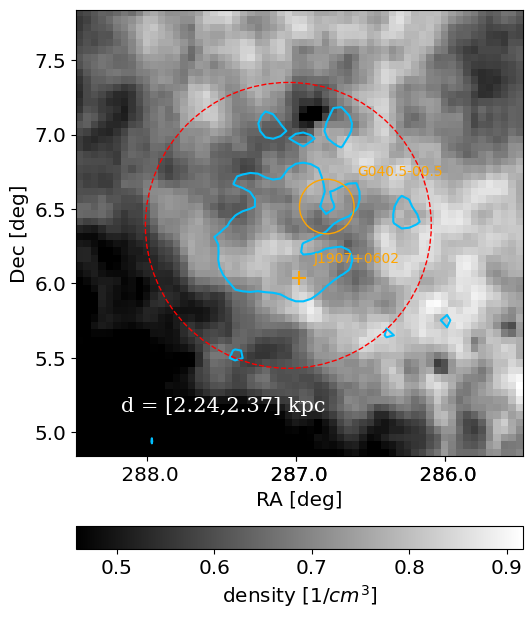
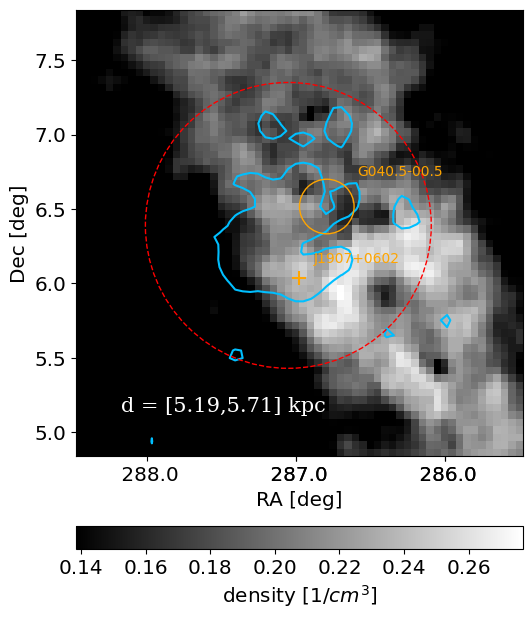
Figure 7: The maps of molecular gas density (top row) and atomic gas density (bottom row) in three distance intervals: 0.13-0.26 kpc (a,d), 2.24-2.37 kpc (b,e), and 5.19-5.71 kpc (c,f). The red dashed circular region is centered at the TeV emission centroid (RA, Dec) = (287.05◦ , 6.39◦ ) with a radius of 0.96◦ containing 95% of the TeV emission. The skyblue contour shows the γ-ray morphology with > 2.5σ significance in the VERITAS data. The orange cross indicates the location of PSR J1907+0602, and the orange circle outlines the shell size of the SNR G40.5-0.5. The coordinates are in J2000 equatorial degrees.
Figure 8: The ambient gas density as a function of distance. The dashed curve shows the density estimated using the CO data. The solid curve shows the density estimated using the HI data. The densities are measured from the TeV-emission region indicated by the red dashed circle in Figure 7).


