Reference: E. Aliu et al. (The VERITAS Collaboration), Astrophysical Journal 800: 61, 2015
Full text version
ArXiv: ArXiV:1412.4734
Contacts: Andrew McCann
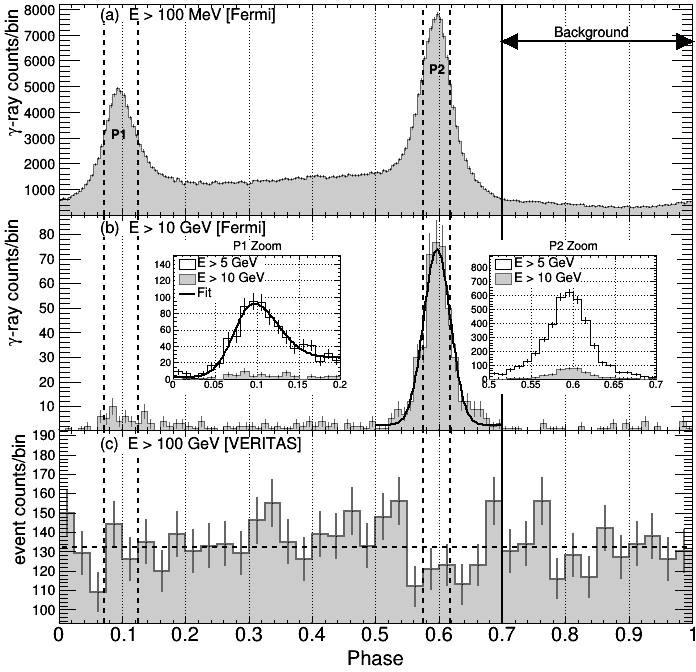
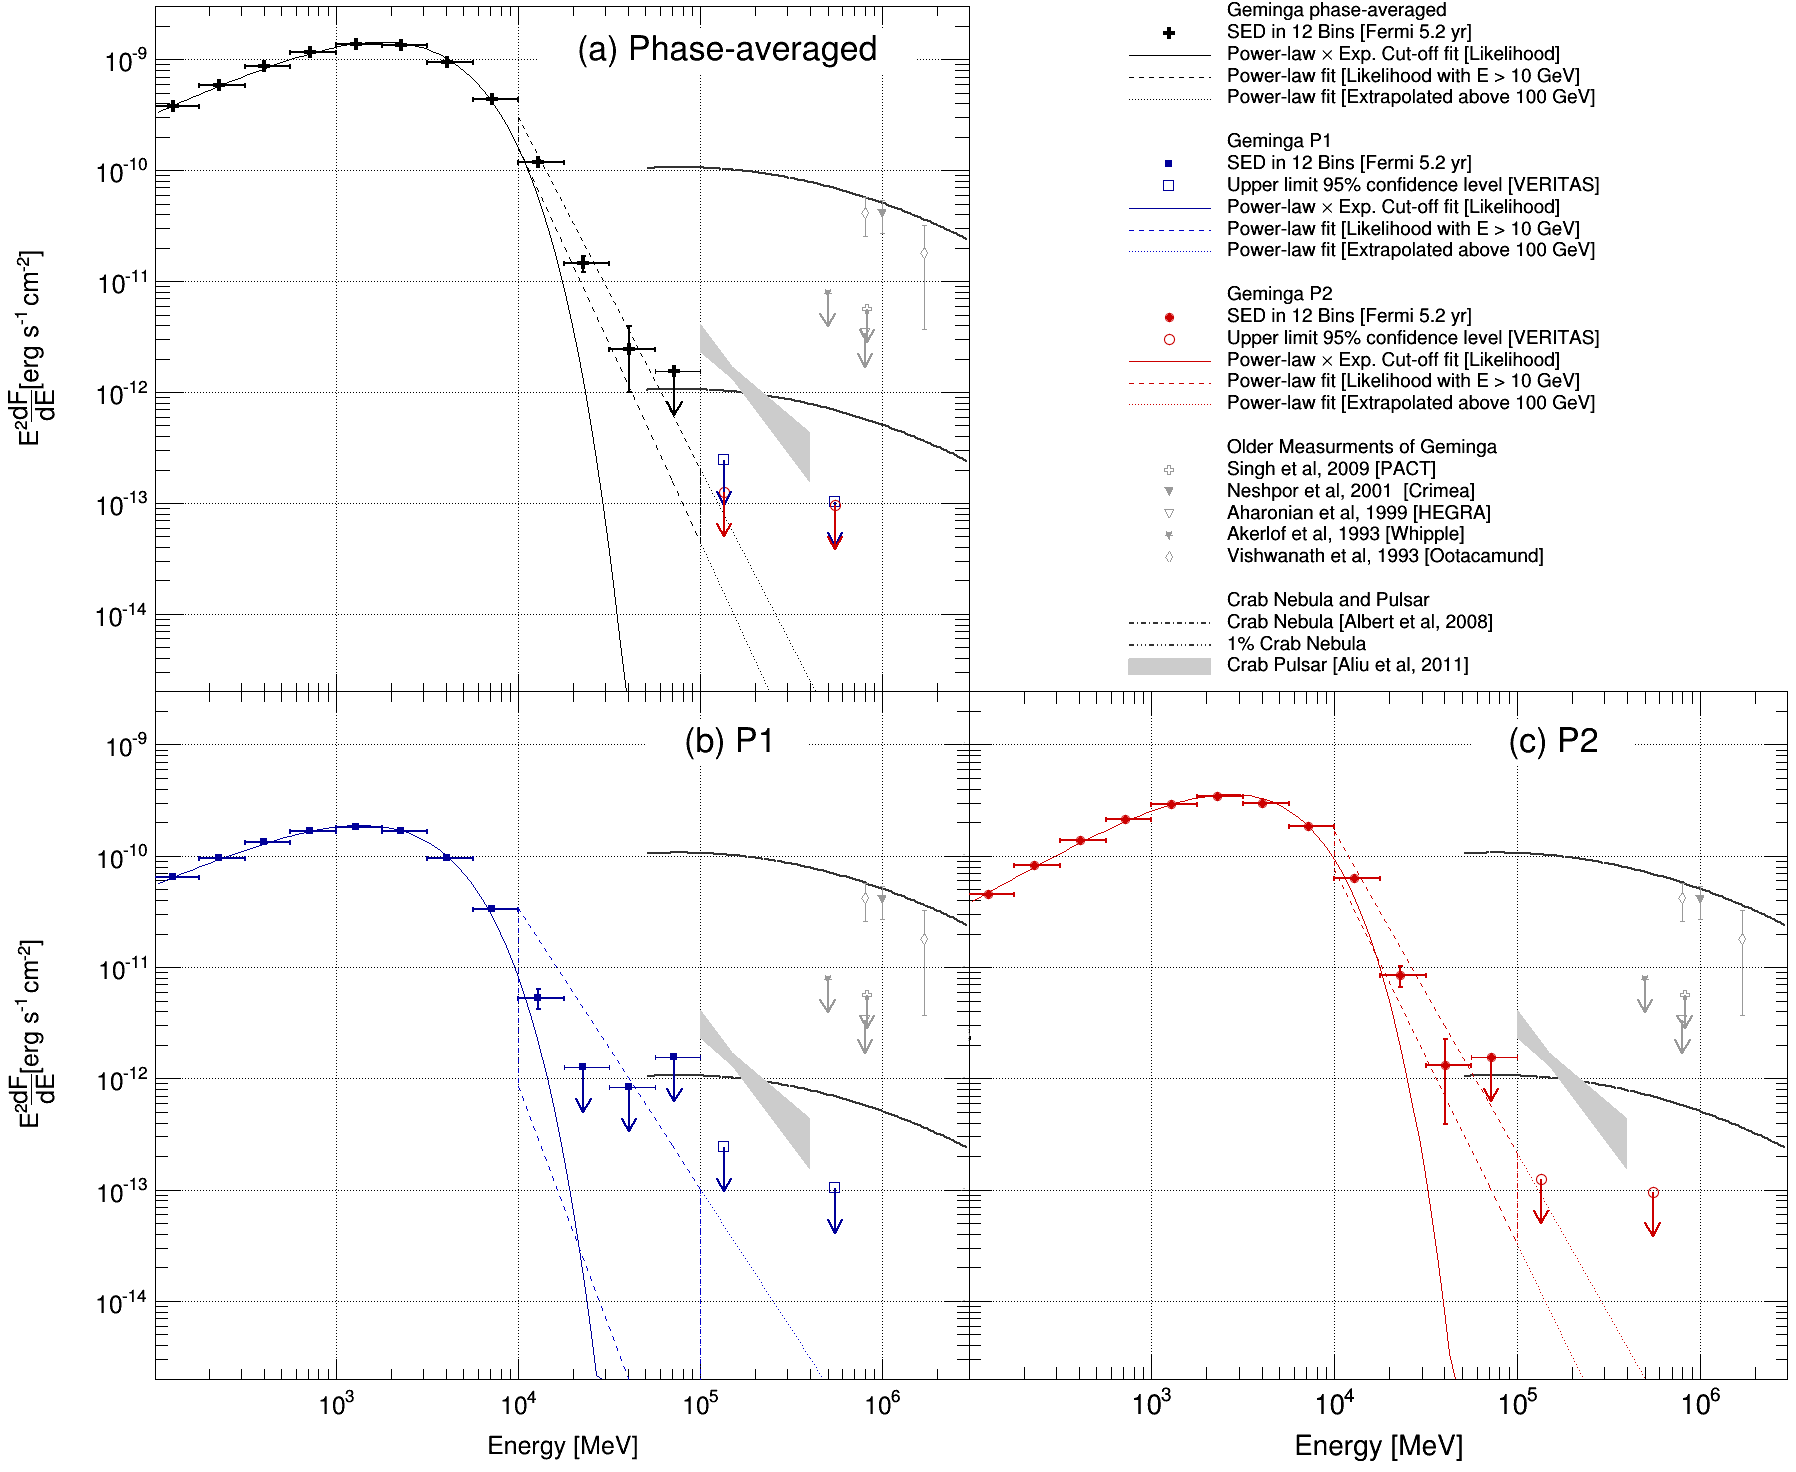
Located at the nearby distance of ~200 pc, the Geminga pulsar is the second brightest GeV source in the gamma-ray sky and the prototypical "radio-quiet" pulsar. It has a period of 237 ms, a spin-down age of 3×10 5 years and a spin-down luminosity of 3.2×10 34 erg s-1. The phasogram of the Geminga pulsar is dominated by two emission peaks separated by a "bridge" of enhanced emission. The spectrum of the Geminga pulsar is well described by a power law with an index of 1.3±0.01 at low energies, followed by a spectral break at ?2.5 GeV. Above the break energy, a sub-exponential cut-off in the spectrum is favored over a pure exponential or super-exponential and Lyutikov (2012) argues that above the spectral
break, the spectrum can be described by a power law, a behavior similar to what has been measured by VERITAS and MAGIC in the Crab pulsar above the spectral break.
Following a 70 hr observation, the VERITAS array has placed limits on emission from the P1 and P2 phase above 135 GeV at the level of ~0.25% Crab Nebula level. These limits represent the most constraining limits set to date on the gamma-ray emission from the pulsar in this energy regime, surpassing previous limits by over an order of magnitude. From a 5.2 year analysis of Fermi data we find that above 10 GeV, pure power laws with indices between 5.1 and 5.5 are compatible with the spectral points and predict a level of emission below the VERITAS limits. This indicates that Geminga is still a viable candidate for inverse-Compton emission and such emission could be detected above 100 GeV by the forthcoming Cherenkov Telescope Array within ~100 hrs of
observation.
FITS files:
Figures from paper (click to get full size image):