Reference: E. Aliu et al. (The VERITAS Collaboration), Astrophysical Journal 787: 166, 2013
Full text version
ArXiv: ArXiV:1404.7185
Contacts: Phil Kaaret
The Milagro experiment discovered a powerful VHE gamma-ray source in the constellation Aquila in their 7 year survey of the northern sky published in 2007. The nature of the source was unknown, but it appears on the sky near a 20,000 year old remnant of a supernova explosion. The existence of the gamma-ray source was verified by the H.E.S.S. observatory, but its nature remained a mystery until the Fermi satellite discovered a rotating neutron star, or pulsar, located nearby on the sky. The majority of objects within our own Milky Way galaxy that produce very high energy (VHE) gamma-rays are nebulae that are powered by winds of relativistic particles accelerated by pulsars. The new VERITAS results reported here provide the best map ever obtained of the VHE gamma-ray emission from the Milagro source. The gamma-ray emission is very extended, covering the region near the Fermi pulsar, but also extending towards the supernova remnant. In contrast to other gamma-ray pulsar wind nebulae of similar age in which the average energy of the gamma-ray decreases as one moves away from the pulsar, the spectrum of energies measured by VERITAS appears constant across the whole nebula. While it is still possible to interpret the whole of the gamma-ray emission as arising from the Fermi pulsar, the VERITAS results suggest that the situation may be more complex, perhaps requiring an interaction between the energetic particles emitted by the pulsar and either the supernova remnant or molecular clouds near the boundary of the nebula.
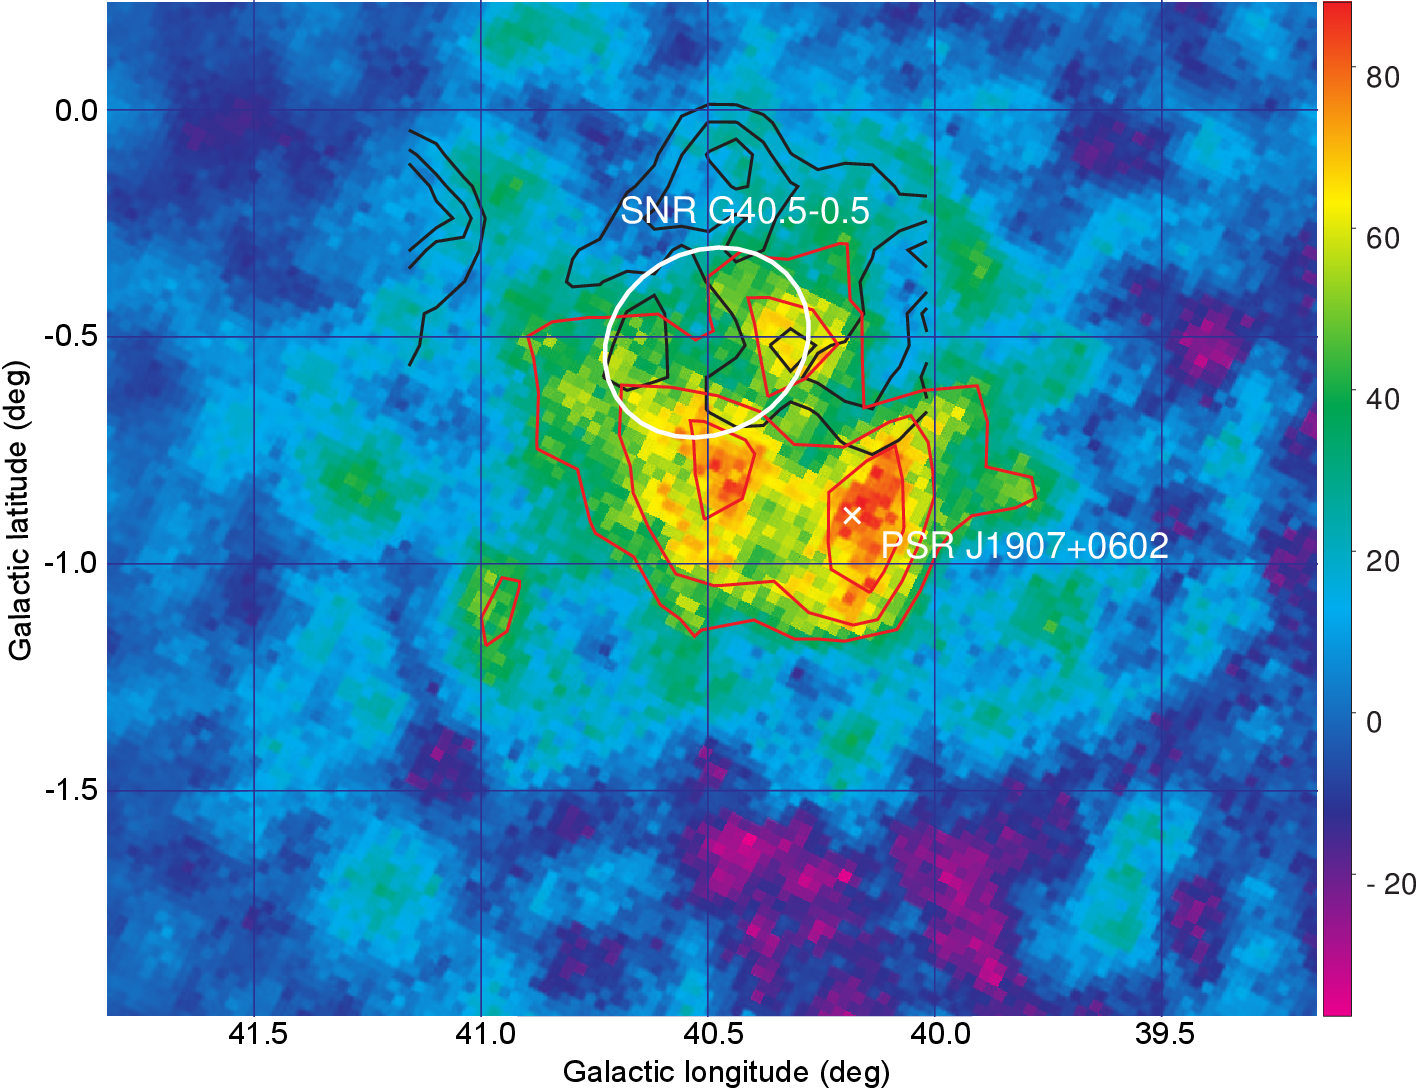
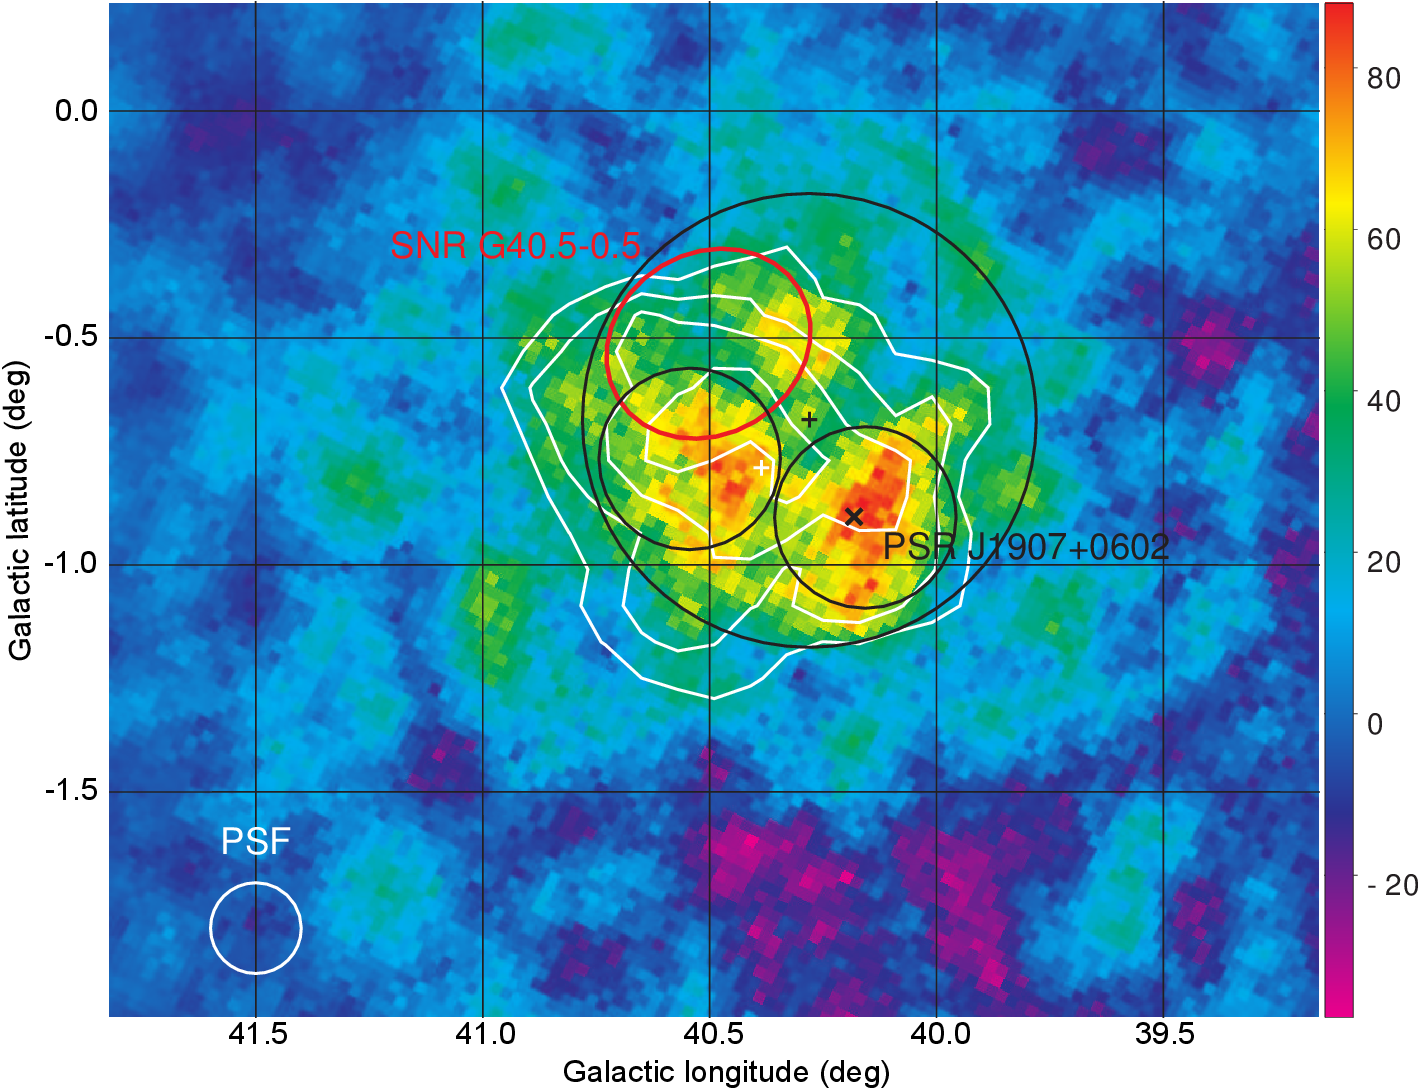
Below, we include a supplemental file containing the gamma-map maps in FITS format. Each pixel represents an integration over a radius of 0.1 degrees. The first extension, 'SignificanceSkyMap', gives the significance of the gamma-ray detection in each pixel in standard deviations, the second extension, 'ExcessSkyMap', gives the gamma-ray excess counts as shown in Figure 1.
FITS files: Skymaps
Figures from paper (click to get full size image):

H.E.S.S. and Milagro results. The image data are available in the electronic edition as the second extension of supplemental FITS file.