
Reference: V. A. Acciari et al. (The VERITAS Collaboration), Astrophysical Journal 729: 2, 2011
Full text version
ArXiv: ArXiV:1012.2200
Contacts: Daniel Gall
This paper presents the results of short-term multiwavelength study of Mrk 501 that was coordinated in 2009 March, focusing around a multi-day observation with the Suzaku X-ray satellite and including γ-ray data from VERITAS, MAGIC, and the Fermi Gamma-ray Space Telescope with the goal of providing a well-sampled multiwavelength baseline measurement of Mrk 501 in the quiescent state. The results of these quiescent-state observations are compared to the historically extreme outburst of 1997 April 16, with the goal of examining variability of the spectral energy distribution between the two states. The derived broadband SED shows the characteristic double-peaked profile. We find that the X-ray peak shifts by over two orders of magnitude in photon energy between the two flux states while the VHE peak varies little. The limited shift in the VHE peak can be explained by the transition to the Klein-Nishina regime. Synchrotron self-Compton models are matched to the data and the implied KN effects are explored.
Figures from paper (click to get full size image):
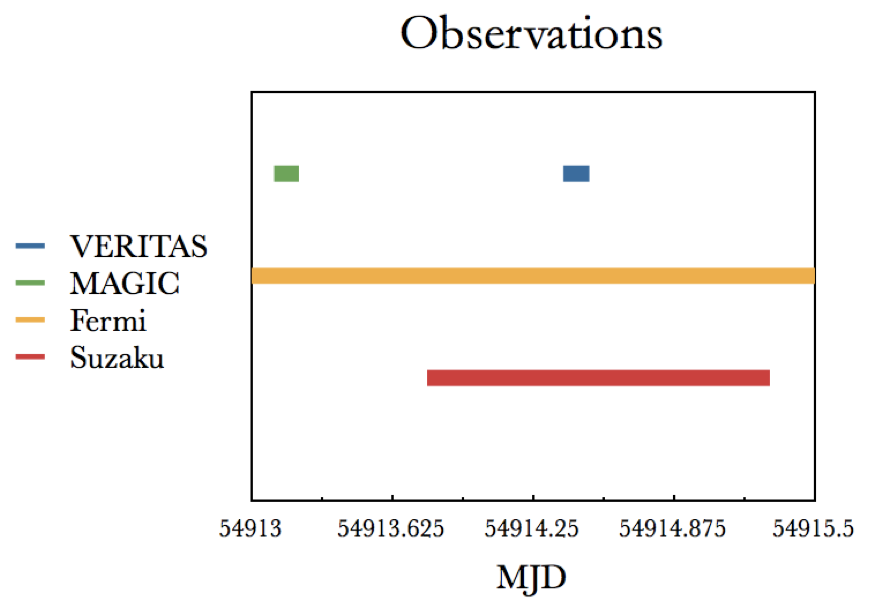
 Figure 2: Light curves of Mrk 501 in the energy ranges used for Suzaku/XIS (0.6 keV < E < 10.0 keV), Suzaku/HXD (10 keV < E < 70 keV), MAGIC and VERITAS (E > 300 GeV). Error bars show 1? statistical errors. The constant fits to the Suzaku data are shown. See the discussion in Section 3.1.
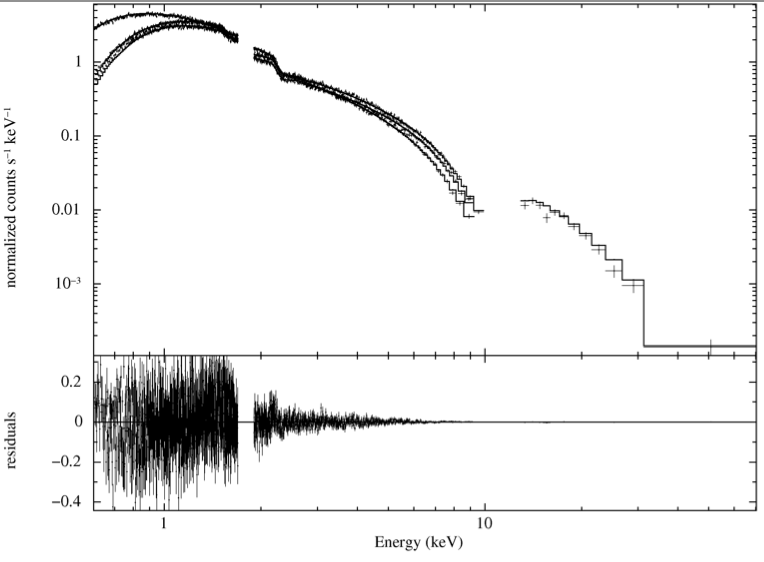
Figure 3: Observed X-ray spectra of Mrk 501 made from Suzaku XIS and HXD/ PIN data separately. A joint fit to a broken power-law model was performed for the three XIS CCDs and the HXD/PIN. The solid histogram shows the best fits to the data (see Section 3.2). The error bars represent 1? statistical errors. The bottom panel shows the residuals of the fit.
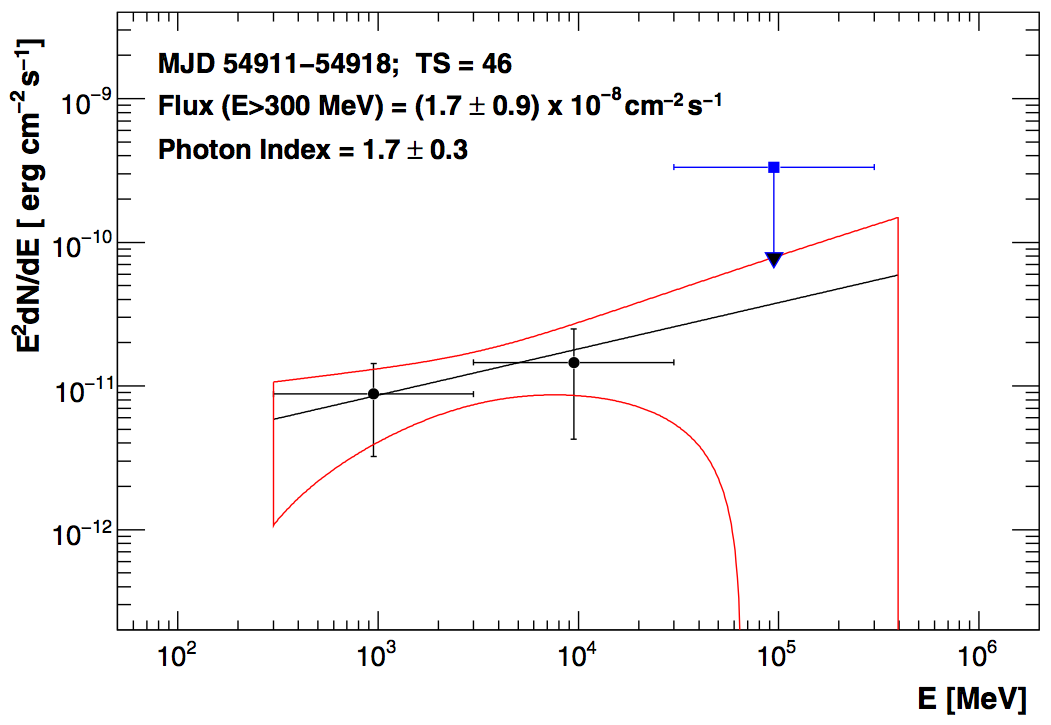
Figure 4: Plot of the Fermi spectral results for the 7 days centered on the Suzaku observing time window (MJD 54911?MJD 54918). The solid line depicts the result of the unbinned likelihood power-law fit, and the contour shows the 68% uncertainty of the fit. The data points show the energy fluxes computed in differential energy ranges, with a 95% confidence level upper limit for the highest energy range. The Fermi analysis was performed in the energy range 0.3-400 GeV. The vertical bars show 1σ statistical errors, and the horizontal bars show the energy range for each point.
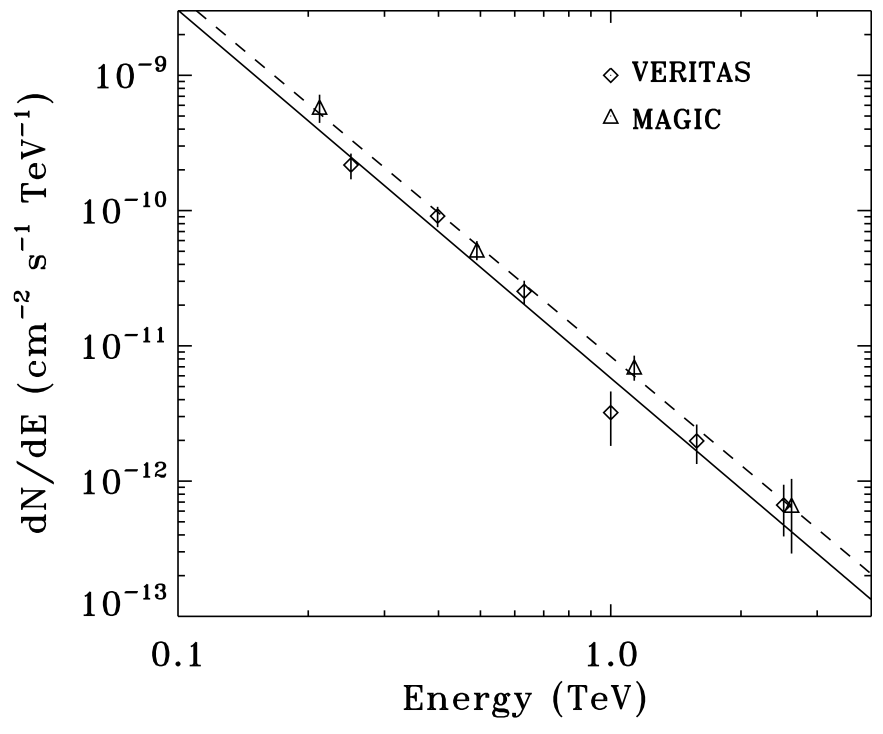
Figure 5: VHE spectrum from VERITAS (diamonds) and MAGIC (triangles), including the best-fit power-law models. The VERITAS fit is shown with a
solid line, and the MAGIC fit is shown with a dashed line. The slopes of the power-law models agree well (VERITAS = 2.72 ± 0.15stat ± 0.10sys and MAGIC = 2.67 ± 0.21stat ± 0.20sys). The slight normalization offset corresponds to the moderately higher VHE flux levels during the MAGIC
observation. The vertical bars show 1σ statistical errors.
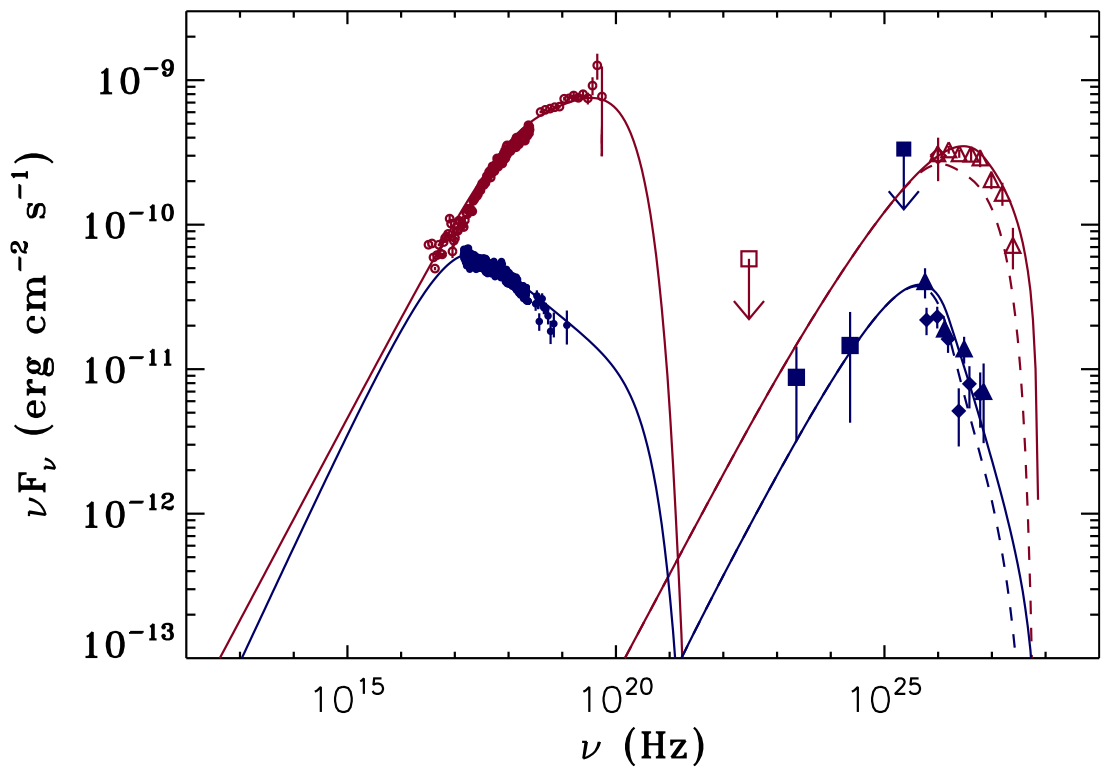
Figure 6: SEDs of Mrk 501 in the quiescent state (in filled points) and during the 1997 extreme outburst (in open points). The former is made from
data obtained in the present campaign with Suzaku (filled circles), Fermi (filled squares), VERITAS (filled diamonds), and MAGIC (filled triangles).
The latter was taken from Pian et al. (1998) and Djannati-Ataï et al. (1999), with X-ray data from BeppoSAX (open circles), GeV γ-ray upper limit from
EGRET (open square), and VHE γ-ray data from the Whipple 10 m (open diamond), and the CAT Cerenkov telescope (open triangles). Note that the Whipple 10 m spectral point overlaps with the lowest energy CAT spectral point. The vertical bars for all data show 1σ statistical errors and the upper limits are at the 95% confidence level. Corresponding SED models matched to the data for each year are shown. The solid lines show the SSC match; dashed lines take EBL absorption into account. The VHE data points are not EBL corrected.