


Next: Versatility
Up: Design Considerations
Previous: Design Considerations
Although high sensitivity measurements in the energy region above
130GeV will be accessible with a smaller array of 10m telescopes
(e.g., 3 or 4 telescopes), the energy range from 60GeV to
130GeV is only accessible with the full array of seven telescopes.
Some cosmic sources (e.g., gamma-ray pulsars or possibly
gamma-ray bursts) may be detectable only in the lowest energy
range which is accessible with the full seven-telescope array.
However, energy measurements on all sources will benefit from
having meaningful spectral measurements over a wide range of
energies. The differential flux sensitivity is defined as the flux
level over an energy interval of 1/4 of a decade over which an energy
measurement can be made to the 20% level in 50 hours of
observation. This is the meaningful level for astrophysical
measurements. The flux sensitivity for the full array is shown in
Figure 2 where it is contrasted with the flux
sensitivity for a three telescope array (Sub-array).
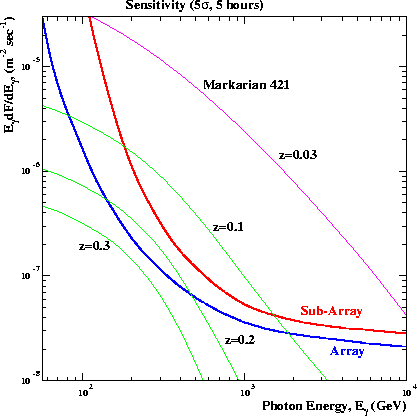
Figure 2:
The flux sensitivity, expressed as E*dF/dE, for the full
VERITAS array (seven telescopes) and the sub-arrays (three telescopes)
for a five-hour exposure. For reference, the spectrum of
Markarian421 as seen on May 7, 1996 is shown, with an extrapolation
of the spectrum below 400GeV. We also show the flux which would be
seen if the source were at different redshifts, where the flux is
reduced by distance and attenuated by extragalactic absorption.
 |
The energy band from 60GeV to 130GeV is a particularly interesting
one for many astrophysical measurements:
- It is the critical region for the study of AGN with
z from 0.3 to 1.0. As seen in Figure 3, sensitivity
in this region allows the study of objects like Mrk421 beyond
redshifts of 0.3. Also, many EGRET-detected AGN are expected to have
intrinsic spectral cut-offs in this energy region.
- This region is most important for measurements of the
cutoff in gamma-rays from extragalactic sources due to pair
production on the EBL.
- It is the region with the greatest possibility for the detection
of pulsars as illustrated in Figure 4 where the
extrapolated spectrum of PSR1951+32 is shown for cutoffs of 50GeV
and 75GeV.
- Sensitivity at these low energies provides
the highest probability of gamma-ray burst detection due to their
large redshift. Information on the high energy spectra of GRBs is
scarce but in Figure 5 we show the extrapolated
spectra from EGRET measurements using an extragalactic infrared
density model of Primack and assuming a distance to the burst source
of z=0.94. If the fraction of high mass stars created during the
epoch of star formation is low, the attenuation will be considerably
less. A one minute duration is assumed for the very high energy
emission and the sensitivity is a 5
 detection per 1/8 decade
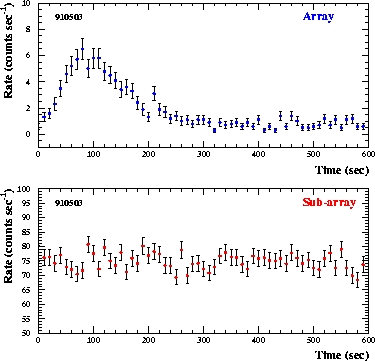
of energy. In Figure 6 the simulated relative response
of a hard-spectrum GRB is shown for the full Array and the Sub-array.
detection per 1/8 decade
of energy. In Figure 6 the simulated relative response
of a hard-spectrum GRB is shown for the full Array and the Sub-array.
- This band covers a large portion of the allowed phase space for
neutralino line emission.
- Broad-band spectral energy measurements of supernova
remnants are essential to resolve the emission mechanisms at work in
these objects. Effective combination of VERITAS with GLAST will
provide energy spectra over 6 magnitudes in gamma-ray energy.
GLAST will be able to detect gamma-rays out to 300GeV, but its
primary sensitivity range will be below about 100GeV due its small
effective area. With energy coverage significantly below 100GeV,
VERITAS will permit accurate cross-calibration with GLAST, maximizing
the scientific return of combined measurements with these instruments.
Figure 3:
The flux sensitivity, expressed in units of E2*dF/dE,
for the full VERITAS array (seven telescopes) and a sub-array (three
telescopes) for a 50 hour exposure. The measured spectrum of Mrk501
from 1997 is shown, with an extrapolation below 250GeV, as well as
model spectra for some other similar type of AGN at different
redshifts.
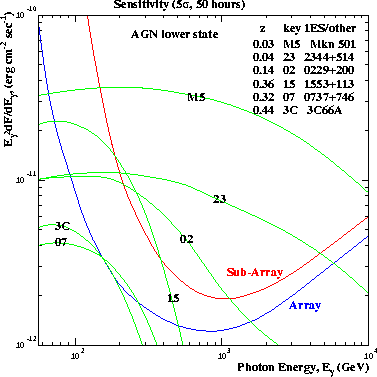 |
Figure 4:
The flux sensitivity, expressed in units of E2*dF/dE,
for the full VERITAS array (seven telescopes) and a sub-array (three
telescopes) for a 50 hour exposure. The spectrum of PSRB1951+32 is
shown extrapolated from EGRET energies with exponential cut-offs at
50GeV and 75GeV.
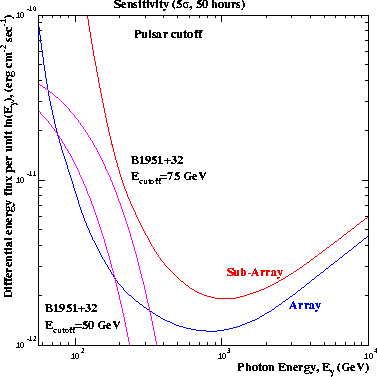 |
Figure 5:
The flux sensitivity, expressed in units of E*dF/dE,
for the full VERITAS array (seven telescopes) and a sub-array (three
telescopes) for a 1 minute exposure. An extrapolation of the spectra
measured by EGRET for several GRBs is shown after attenuating the
gamma-ray emission from interaction with the extragalactic
background light.
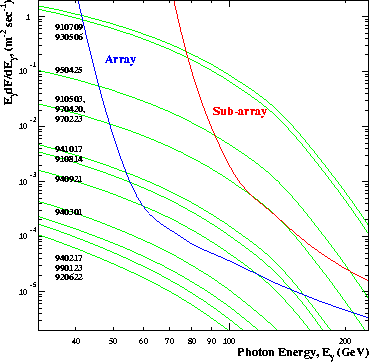 |
Figure 6:
Simulated lightcurves (without background subtraction)
measured by the full VERITAS array between 55 and 180GeV (top) and a
sub-array of three telescopes between 100 and 240GeV (bottom) for
GRB 910503 if the spectrum follows that indicated in
Fig. 5. The background dominates the
sub-array measurements because the data must be accumulated much
closer to the lower end of its sensitive energy range.
 |
Next: Versatility
Up: Design Considerations
Previous: Design Considerations
VERITAS Collaboration