The angular size of a star is a critical factor in determining its basic properties. Direct measurement of stellar angular diameters is difficult: at interstellar distances stars are generally too small to resolve by any individual imaging telescope. This fundamental limitation can be overcome by studying the diffraction pattern in the shadow cast when an asteroid occults a star, but only when the photometric uncertainty is smaller than the noise added by atmospheric scintillation. Atmospheric Cherenkov telescopes used for particle astrophysics observations have not generally been exploited for optical astronomy due to the modest optical quality of the mirror surface. However, their large mirror area makes them well suited for such high-time-resolution precision photometry measurements. Here we report two occultations of stars observed by the VERITAS Cherenkov telescopes with millisecond sampling, from which we are able to provide a direct measurement of the occulted stars’ angular diameter at the < 0.1 milliarcsecond scale. This is a resolution never achieved before with optical measurements and represents an order of magnitude improvement over the equivalent lunar occultation method. We compare the resulting stellar radius with empirically derived estimates from temperature and brightness measurements, confirming the latter can be biased for stars with ambiguous stellar classifications.
Figure 1: Ingress and egress light curves for both asteroid occultations. a: The light curves of the ingress of the (1165) Imprinetta / TYC 5517-227-1 occultation, with the best-fit diffraction pattern (red line) and theoretical point-source model (dashed blue line). Each telescope light curve is normalized such that the unocculted and occulted intensity levels correspond to 1 and 0 respectively, with an added y-axis offset between telescopes for clarity. The combined (averaged) residual with respect to the point-source (grey empty squares) and best-fit (black filled circles) models are shown in the bottom panels. Vertical error bars are defined as the 68% containment radius, including systematics. b: The same for the egress of the (1165) Imprinetta / TYC5517-227-1 occultation. c: The same for the ingress of the (201) Penelope / TYC278-748-1 occultation. d: The same for the egress of the (201) Penelope / TYC278-748-1 occultation.
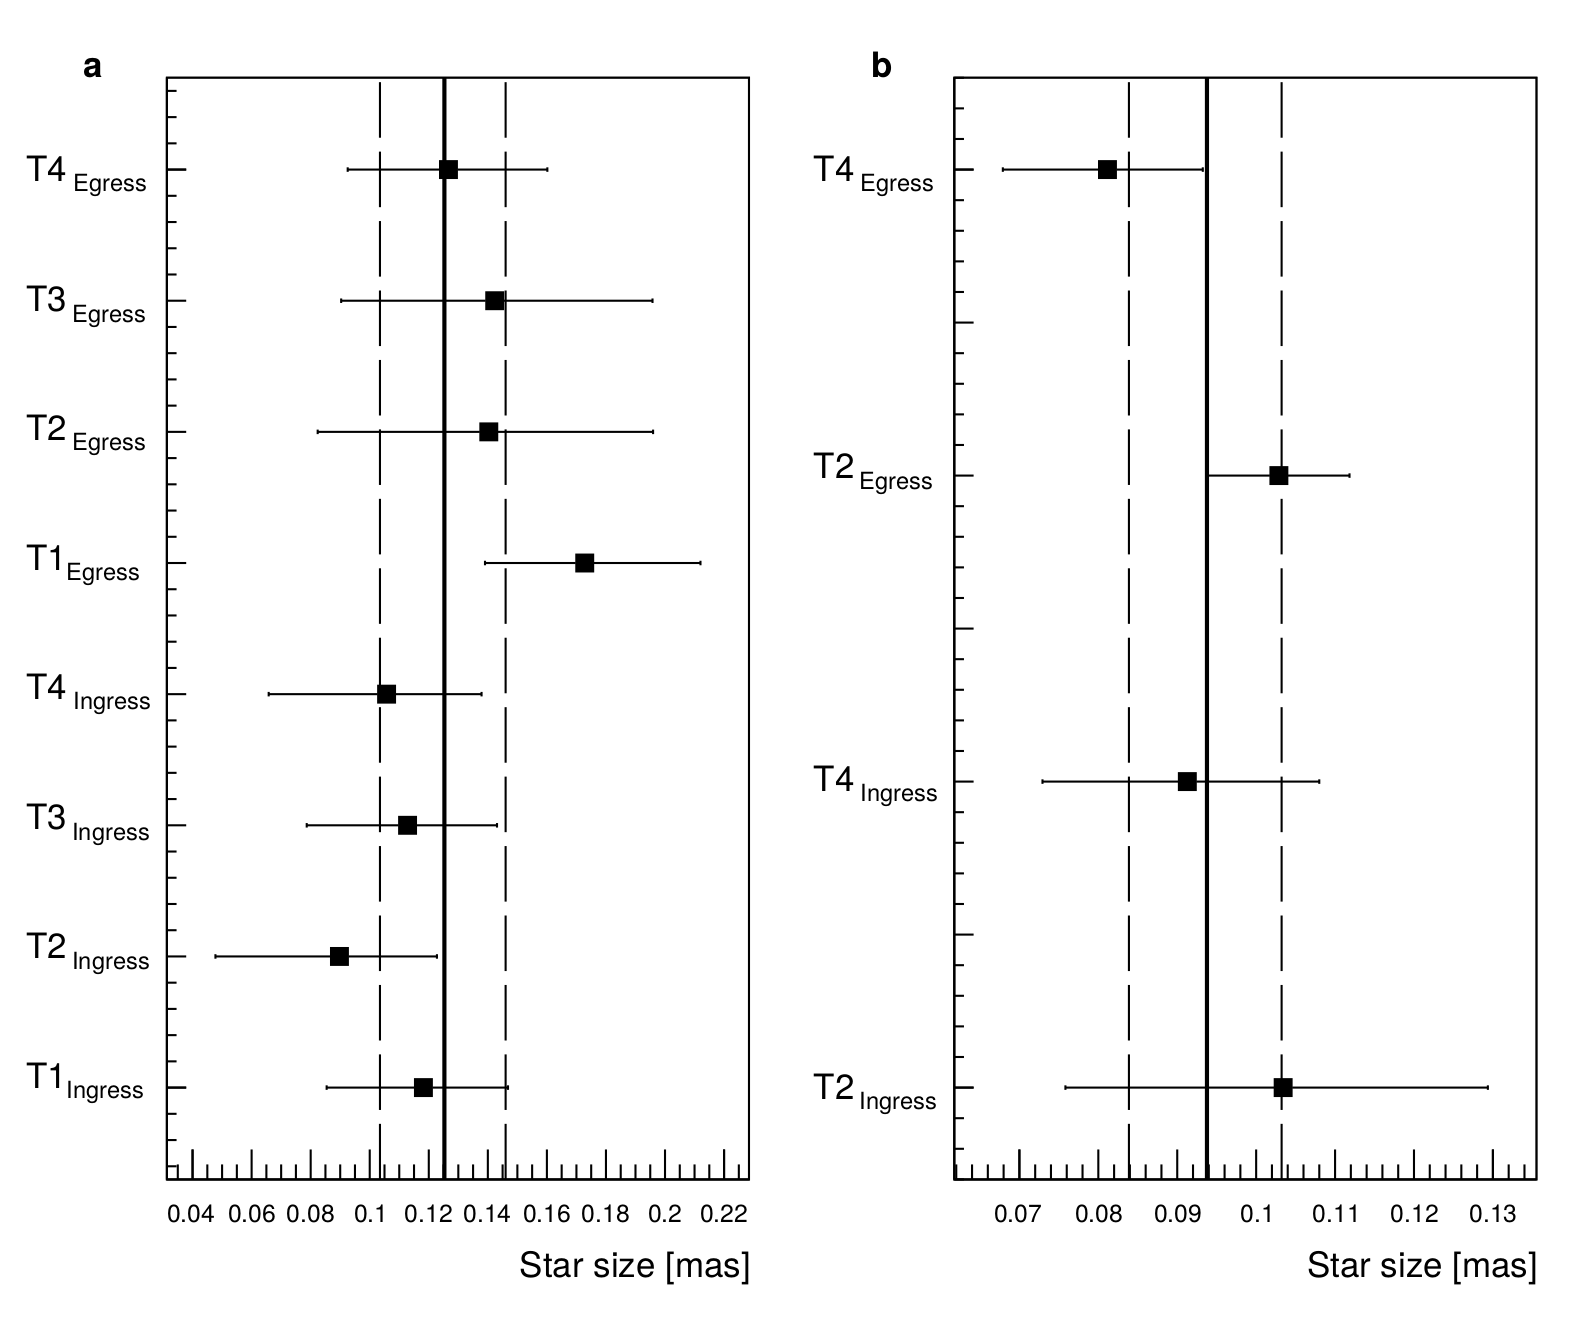
Figure 2: Individual and combined stellar size measurements. a: Stellar size measurements of TYC 5517-227-1 from each ingress and egress light curve assuming an uniform disc profile. Vertical lines show the final stellar size measurements with their 1- uncertainty regions (dashed lines), obtained from the combined 2 minimisation of all available measurements (see Methods section for details). Horizontal error bars refer to the 68% containment radius associated to each measurement individually. b: the same for TYC278-748-1. Only two of the telescopes were used for this analysis.
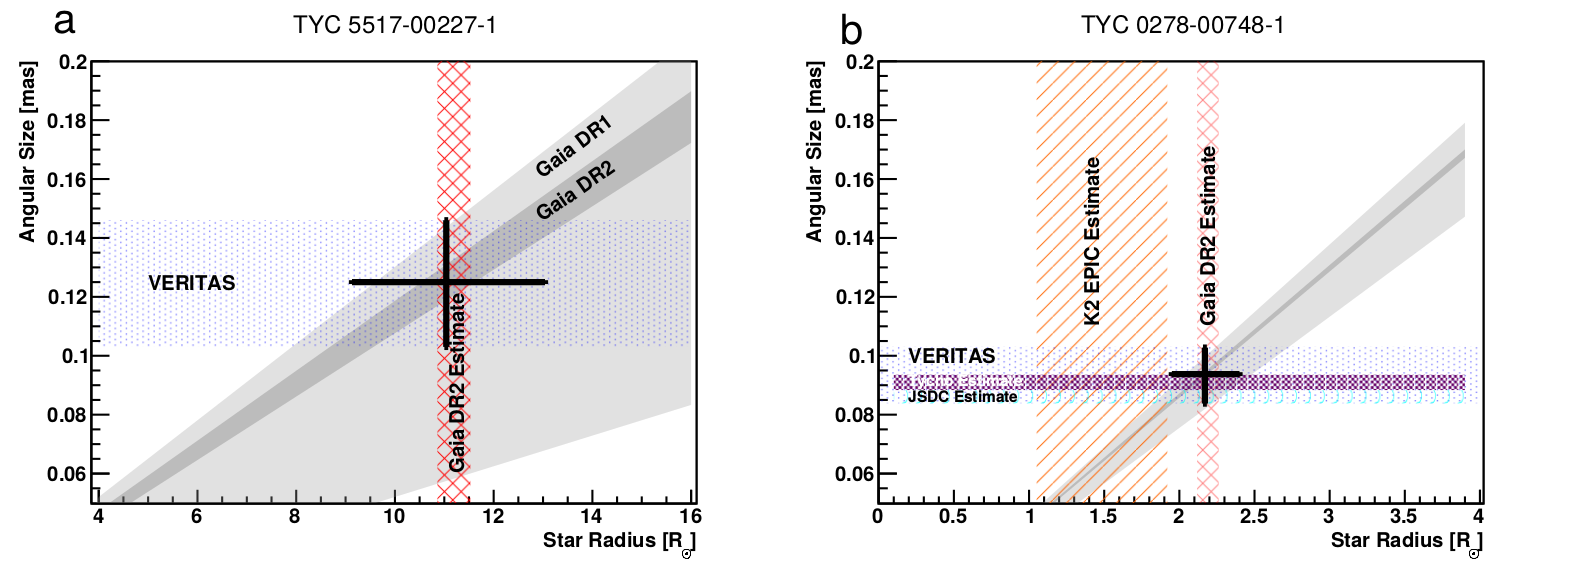
Figure 3: Comparison of the angular size measurements and stellar radius estimates in this work compared to those available in the literature. a: Angular size as a function of stellar radius for the parallax distance of TYC 5517-227-1 as determined by Gaia Data Release 1 (light grey band) and Gaia Data Release 2 (dark grey band). A model estimate of the stellar radius from Gaia FLAME is shown by the red hatched box, the best-fit angular size from our measurements is shown by the blue stippled box, and the estimated uniform disc approximation stellar radius for our best fit angular size at the Gaia DR2 parallax distance is marked by a cross. b: The same for TYC 278-748-1, with the addition of the angular size estimates from the Tycho (magenta box) and JSDC (cyan box) catalogues and the radius estimate from the Kepler K2 EPIC catalogue (orange diagonal-stripe box).
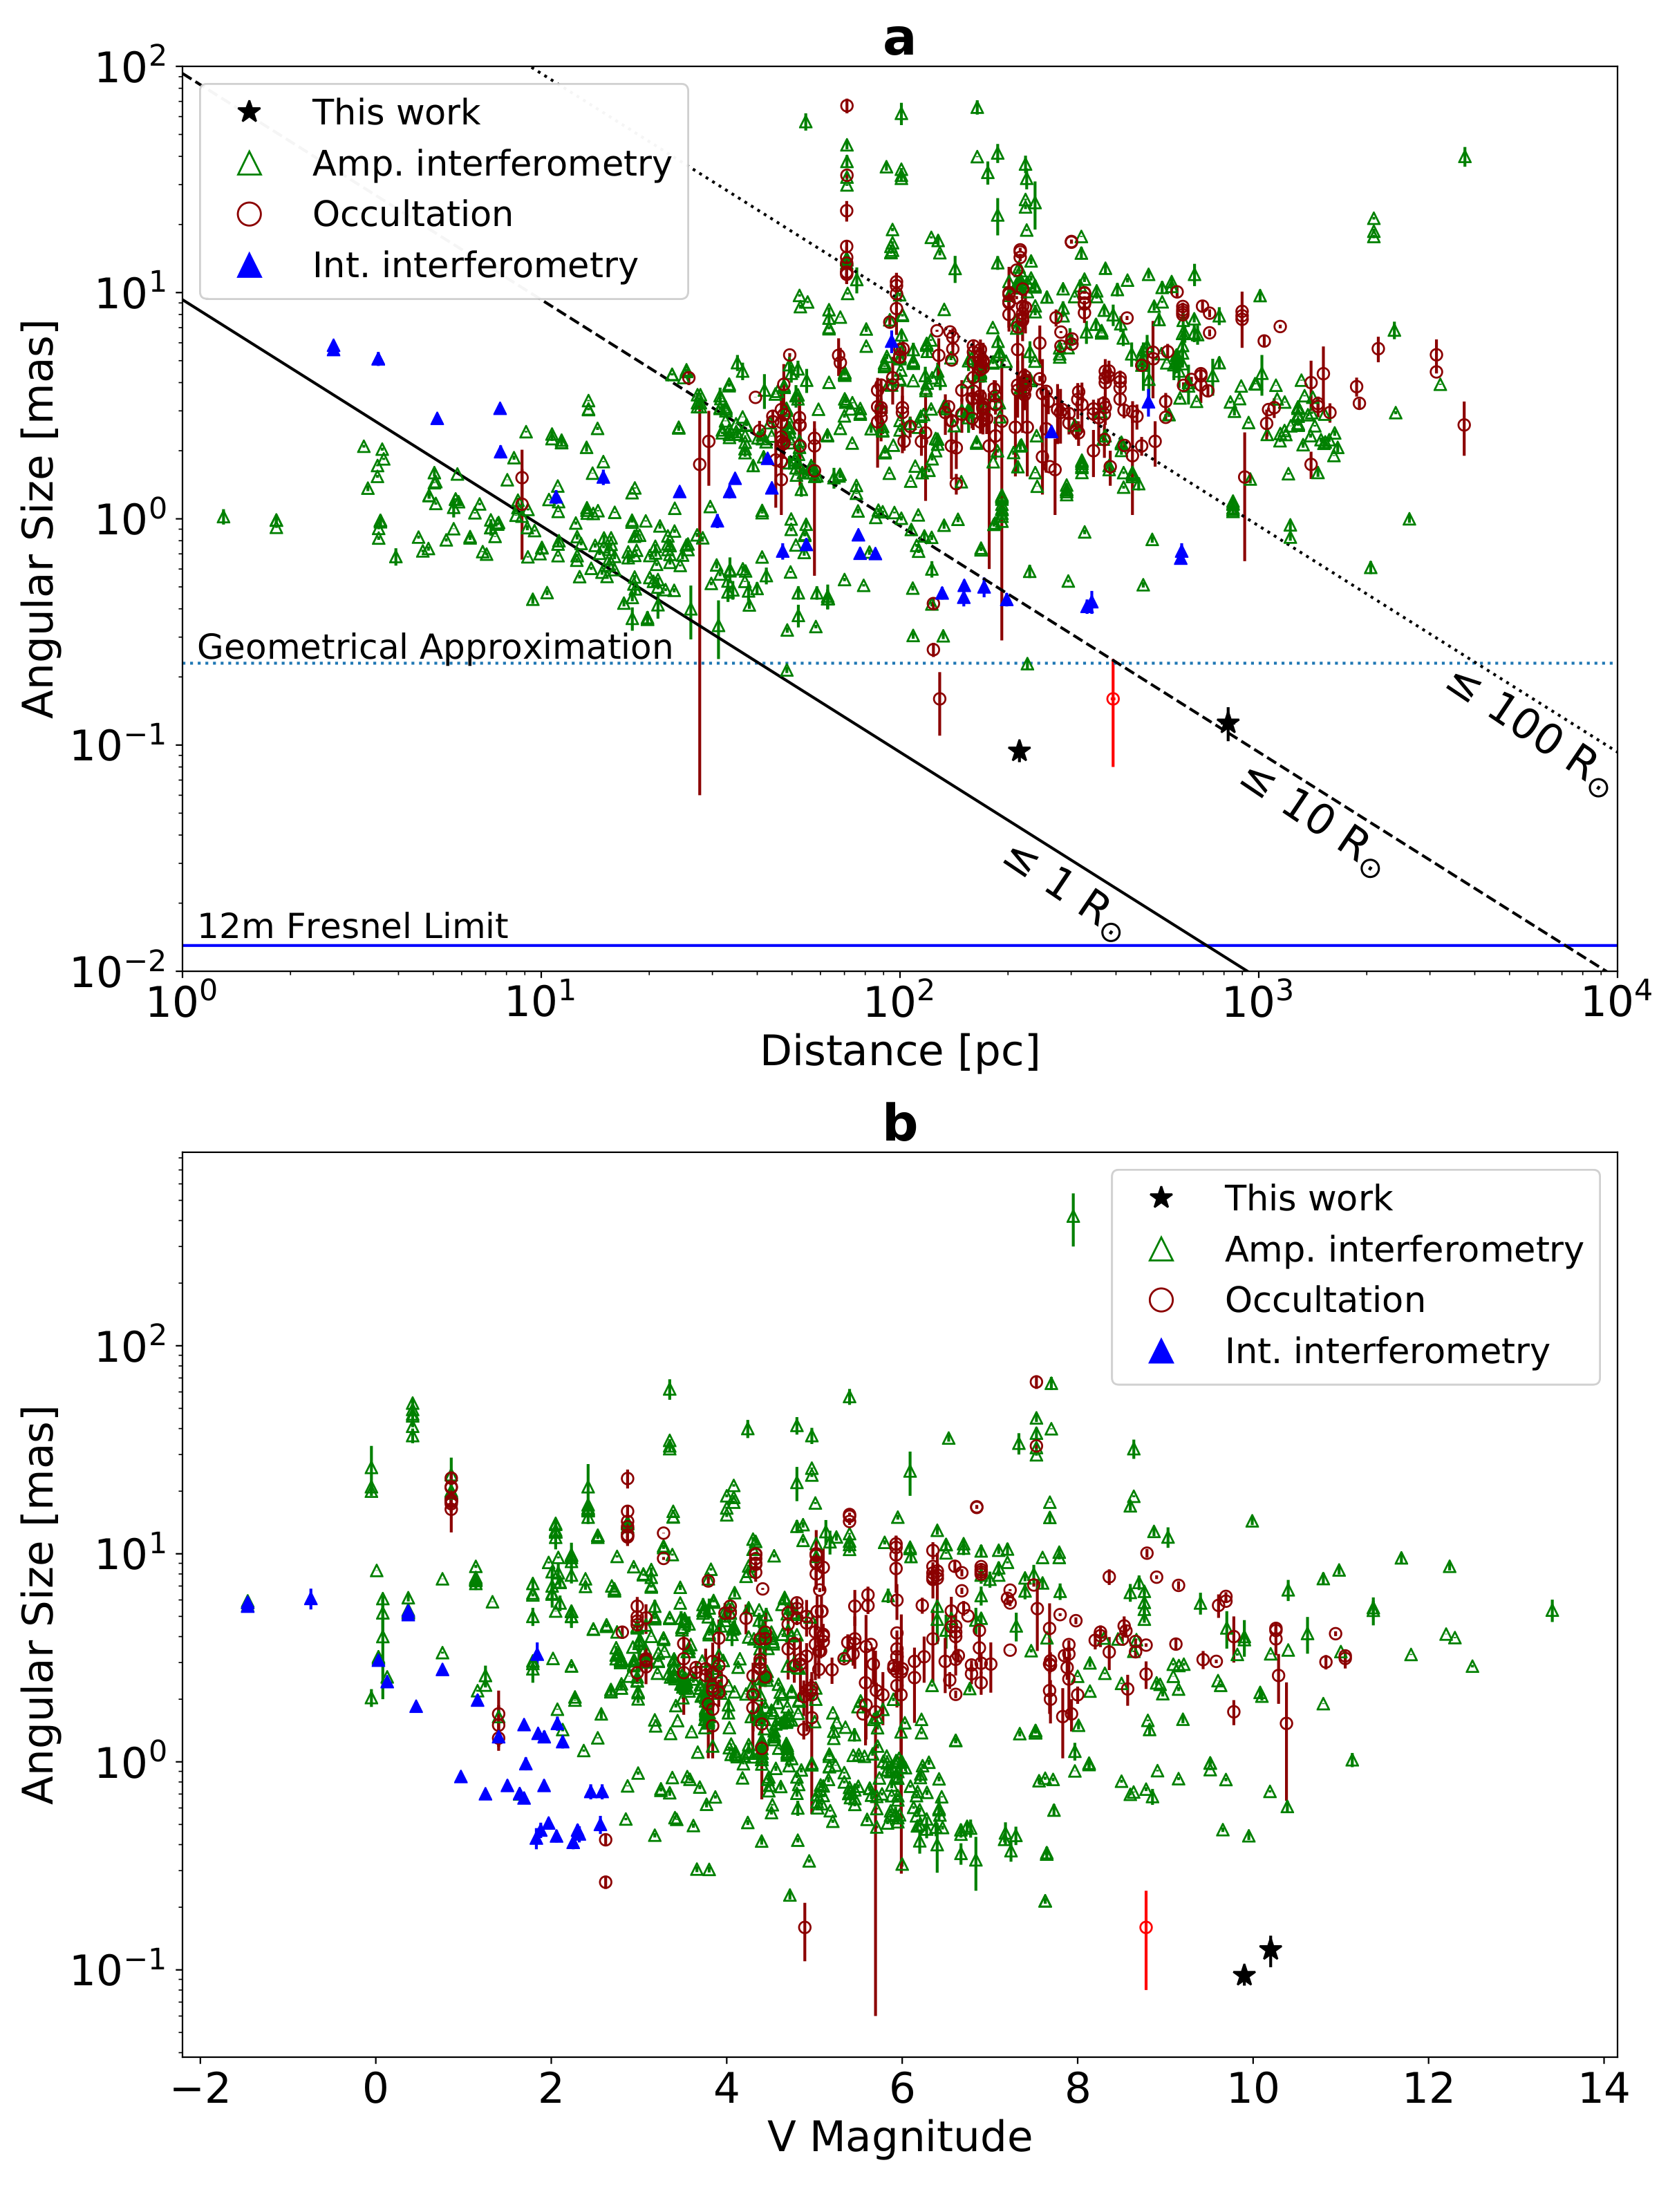
Figure 4: Comparison to the available directly measured stellar angular size measurements. a: The angular size as a function of distance for all stars with direct measurements. The asteroid occultation measurements are marked with stars, this work in black, the (3) Juno occultation in red; amplitude interferometry measurements by open green triangles; intensity interferometry by blue triangles; and all other occultation measurements by open dark red circles. The solid, dashed and dotted lines respectively show the expected value for a 1, 10 and 100 solar radius star. The blue solid line gives the theoretical limit for discriminating between a point-like source and a resolved star by its Fresnel diffraction and the blue dashed line the region where the diffraction pattern completely disappears for a geometrically resolved star. b: As before, but for angular size as a function of apparent magnitude. Errors for this work are the 68% confidence level, all others are taken from the respective catalogue entry.

