The observations of fast TeV gamma-ray flares probe the structure and emission mechanism of blazar jets. In extreme cases, the length scale being probed is comparable to the Schwarzschild radius of the central black hole, which is currently unresolved with even the instruments of the highest angular resolution. However, only a handful of such flares have been detected to date, and only within the last few years have these flares been observed from lower-frequency-peaked BL Lac objects and flat-spectrum radio quasars. It is possible that fast TeV flares in some blazars (especially intermediate- and low-frequency-peaked BL Lac objects like BL Lacertae) are associated with the emergence of superluminal radio emission features based on observations with the Very Long Baseline Array (VLBA).
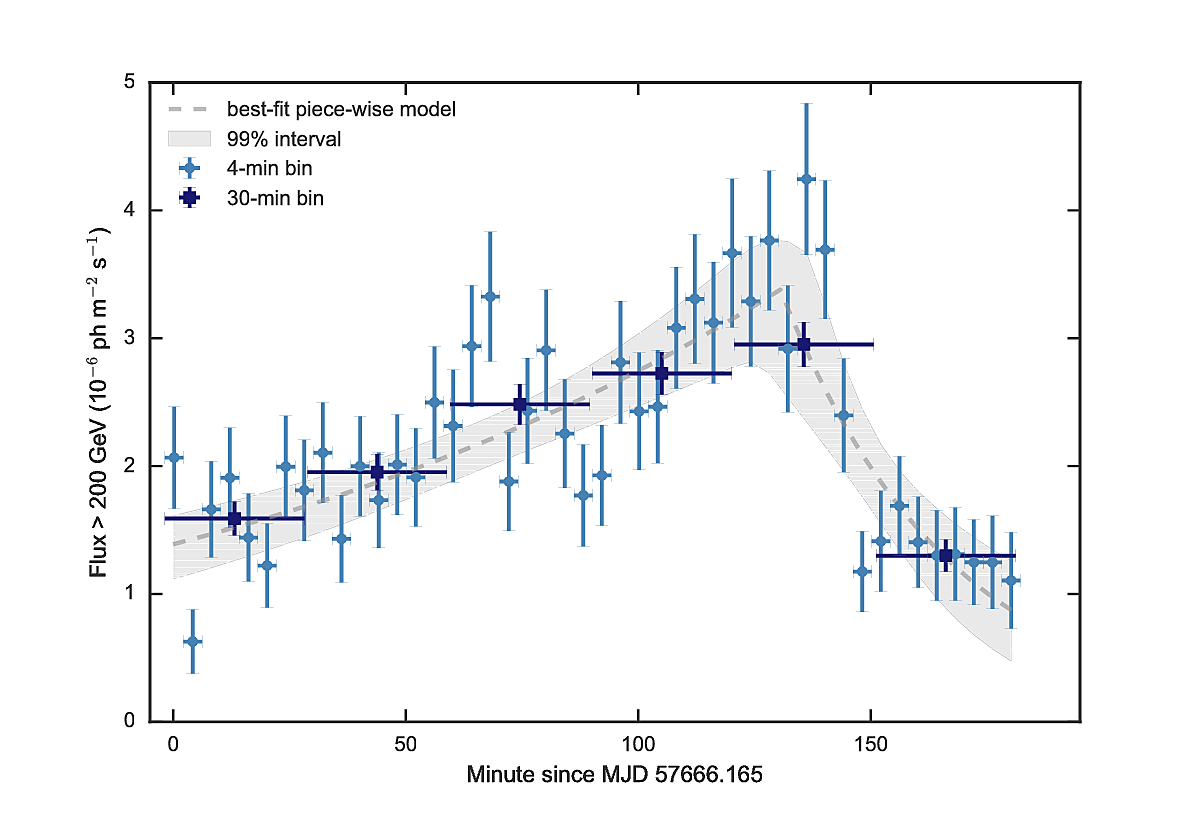
We report on a fast TeV gamma-ray flare from the blazar BL Lacertae observed by VERITAS, with a rise time of ~2.3 hr and a decay time of ~36 min. This was the second time that VERITAS has detected a fast TeV gamma-ray flare from BL Lacertae. The peak flux above 200 GeV is (4.2 ± 0.6) x 10-6 photon m-2s-1 measured with a 4-minute-binned light curve, corresponding to ~180% of the flux which is observed from the Crab Nebula above the same energy threshold. Variability contemporaneous with the TeV gamma-ray flare was observed in the GeV gamma-ray, X-ray, and optical fluxes, as well as in optical and radio polarization. Additionally, a possible moving emission feature with superluminal apparent velocity was identified in VLBA observations at 43 GHz, potentially passing the radio core of the jet around the time of the gamma-ray flare. Such a superluminal radio emission feature was also observed during the first TeV gamma-ray flare from the source observed by VERITAS.
We were able to put constraints on the size, Lorentz factor, and location of the emitting region of the flare, based on two different assumptions on the emitting mechanism. We also discussed a few interpretations of the multi wavelength data with several theoretical models which invoke relativistic plasma passing stationary shocks.
Figure 1: The VERITAS TeV gamma-ray light curves of BL Lacertae above 200 GeV on 2016 Oct 5 (minute zero corresponds to 03:57:36 UTC). The light blue filled circles and the dark blue squares show the light curve in 4-min and 30-min bins, respectively. The grey dashed line shows the model (see Equation 1) with the best-fit parameters and the shaded region illustrates the 99% confidence interval, both of which are derived from simulations using Markov chain Monte Carlo sampling.
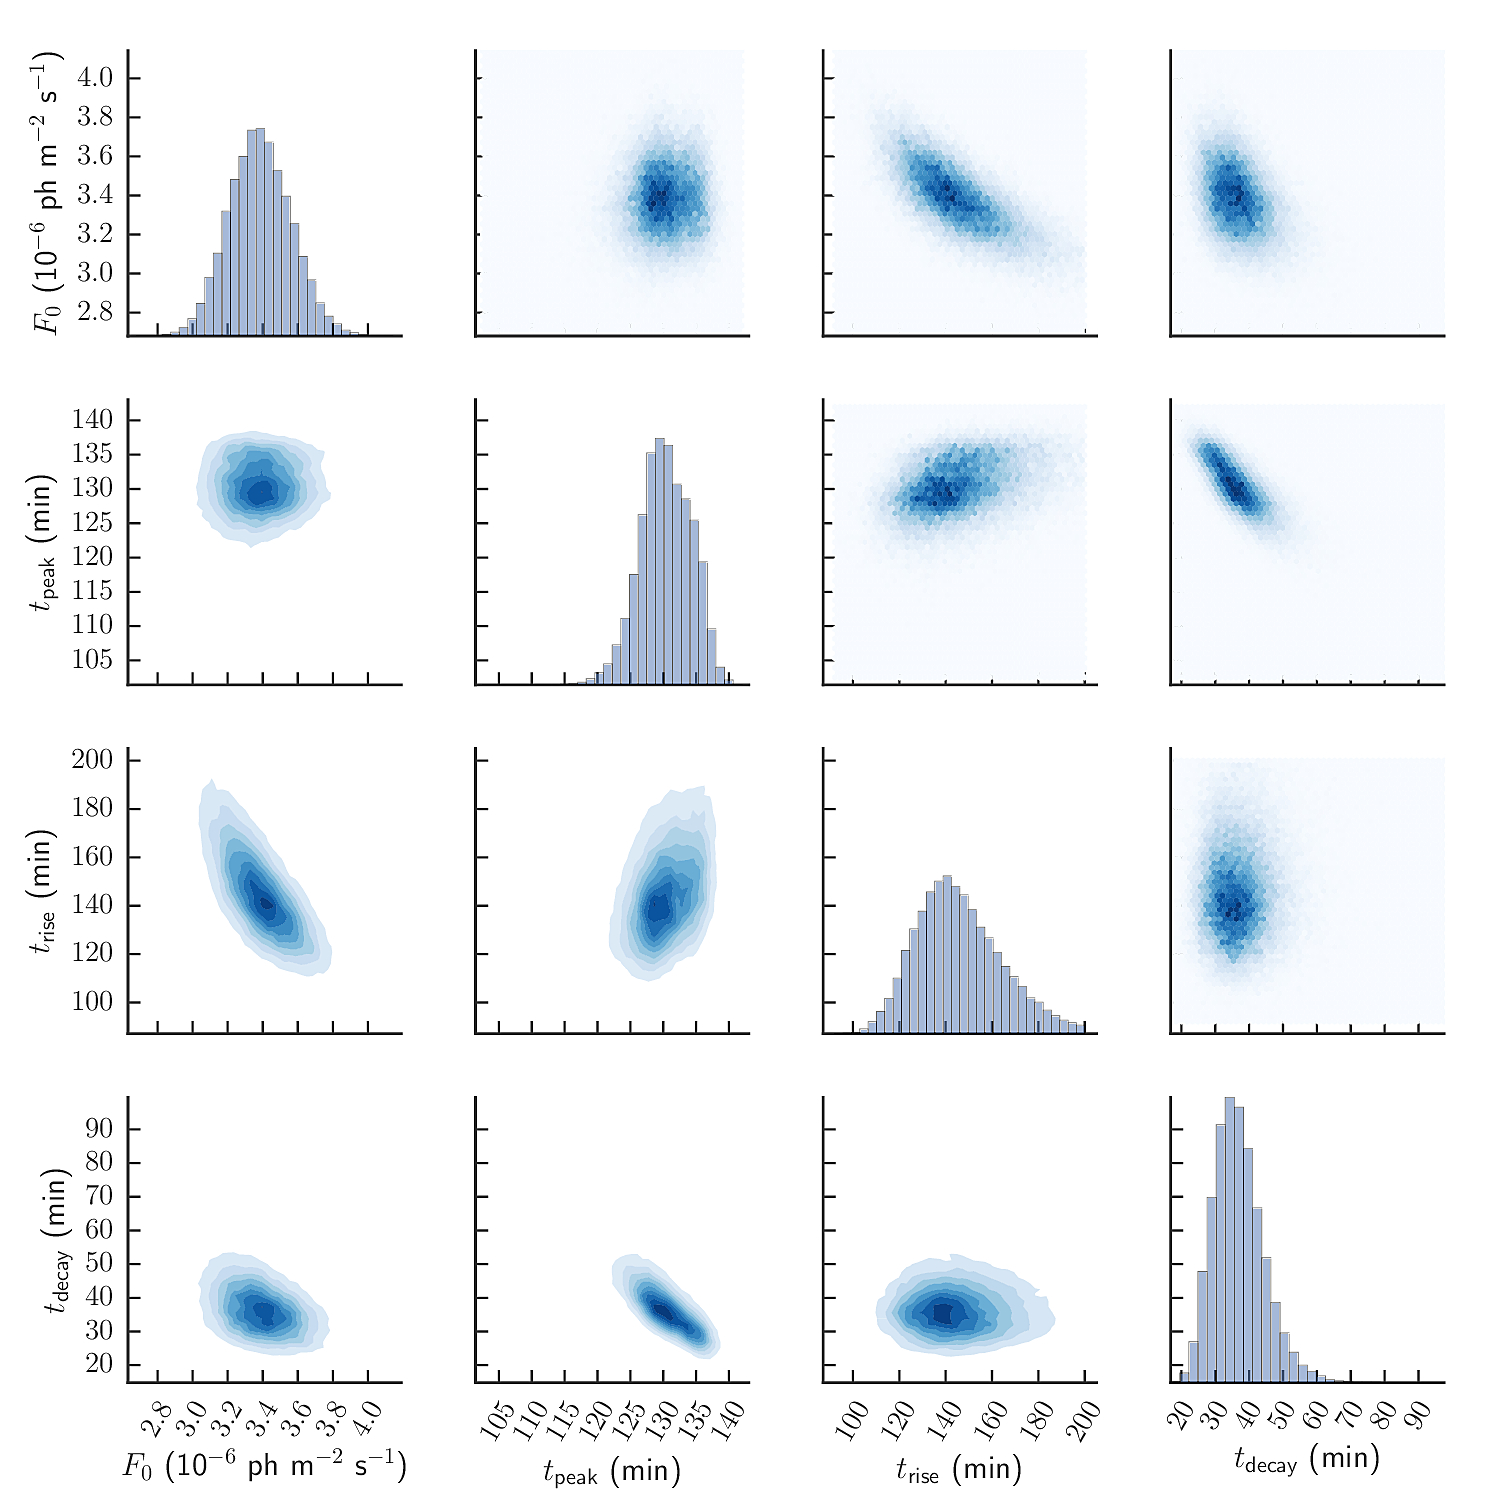
Figure 2: The joint posterior distributions of the parameters in Equation 1 obtained via MCMC simulations. The diagonal plots show the probability distribution histograms of individual parameters; the upper and lower diagonal plots show the two-dimensional histograms with hexagon binning and the kernel density estimations of the joint posterior distributions, respectively.
Figure 3: The gamma-ray SEDs of BL~Lacertae measured by Fermi-LAT and VERITAS. The Fermi-LAT SEDs strictly simultaneous with VERITAS observations on the night of the flare (2016 Oct 5) and from the three days around it are shown in blue and grey, respectively. The observed and de-absorbed VERITAS SEDs averaged over all observations on the night of the flare are shown in red and green, respectively. Each shaded region is derived from the 1-sigma confidence intervals of the best-fit parameters for the corresponding spectrum.
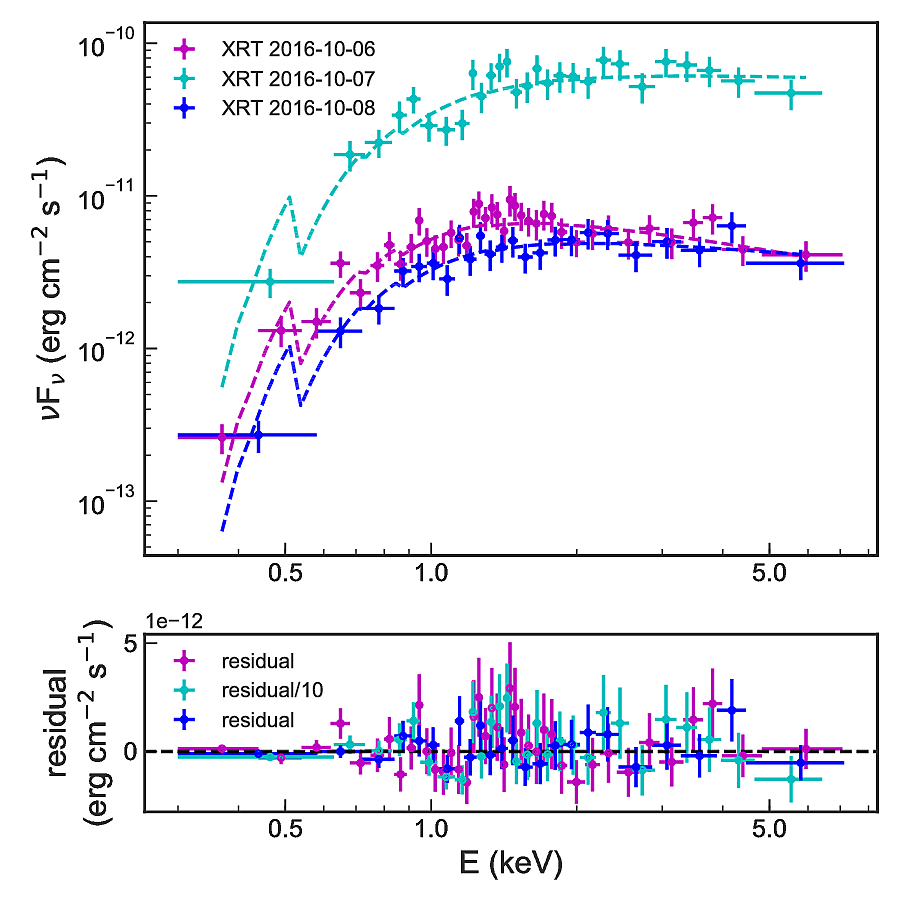
Figure 4: The X-ray SEDs measured by Swift-XRT on 2016 Oct 6, 7, and 8. The dashed lines are the best-fit absorbed-power-law model with NH fixed at 2.9 x 1021 cm-2. Bottom: the distributions of the fit residuals of each X-ray SED. Note that the residual values on Oct 7, shown in cyan, are divided by 10 to facilitate comparison with the other two distributions shown.
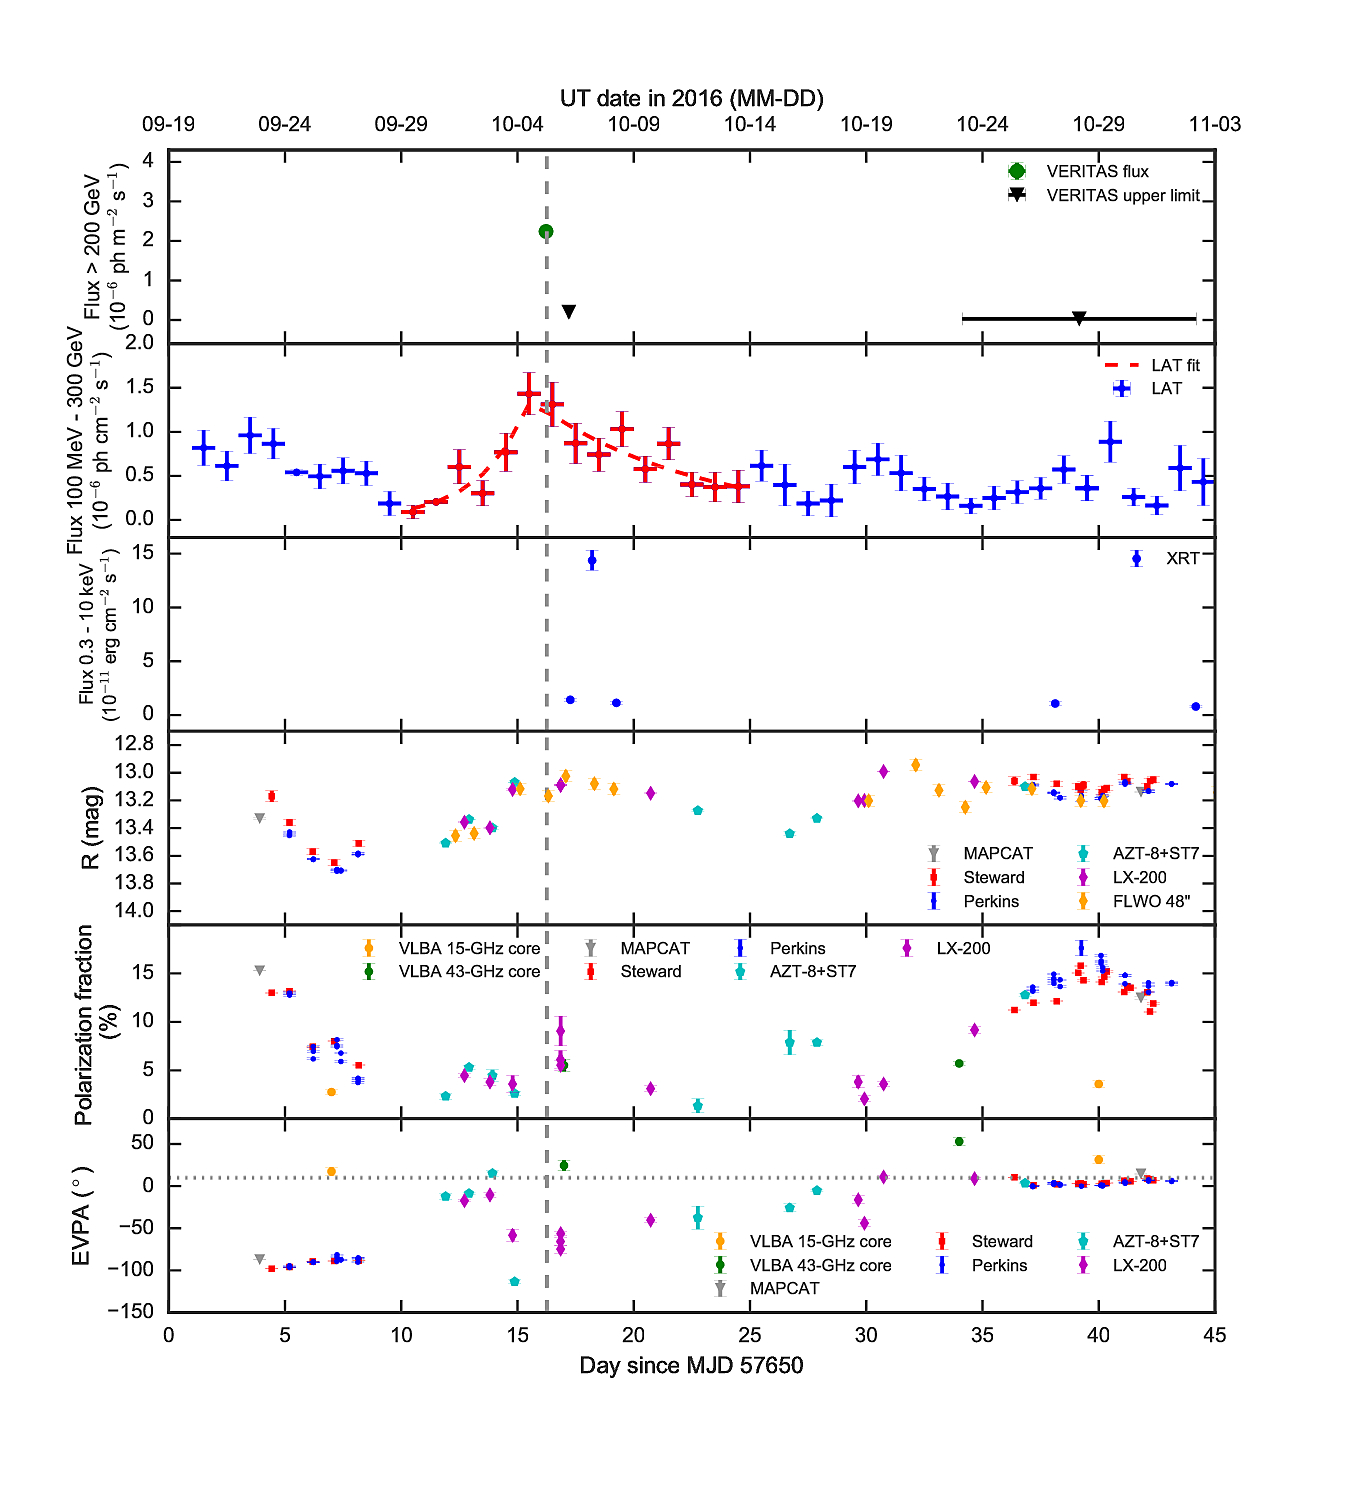
Figure 5: The 45-day MWL light curves of BL Lacertae around the time of the VHE flare. The top panel shows the TeV gamma-ray flux measured by VERITAS on the night of the flare, as well as the upper limits obtained later. The second panel shows the daily-binned GeV gamma-ray light curve measured by Fermi-LAT, as well as a piecewise exponential fit (see Equation 1) to a 15-day interval around the TeV gamma-ray flare (red dashed line). The third panel shows the X-ray energy flux from the five Swift-XRT observations. The bottom three panels show the R-band photometric and polarimetric measurements (see Section 2.4). The grey vertical dashed line shows the peak time of the TeV gamma-ray flare observed by VERITAS. The fractional polarizations and the EVPAs of the 43-GHz and 15-GHz core are also shown in the bottom two panels. The grey horizontal dotted line in the bottom panel shows the position angle of the jet.

Figure 6: The 43 GHz VLBA total (contours) and polarized (color scale) intensity images of BL Lac. The total intensity peak is 1.15 Jy/beam. The contours are 0.2,0.4, 0.8, ..., 51.2, 96% of the peak. The restoring beam shown in the right bottom corner is a circular Gaussian with FWHM=0.1 mas. Linear segments within the images indicate position angles of the polarization, with the length of segments proportional to the local polarized intensity. Red horizontal lines mark the mean locations of the three quasi-stationary features; the blue line across the epochs from 2016 October to December traces the motion of the superluminal knot K16.
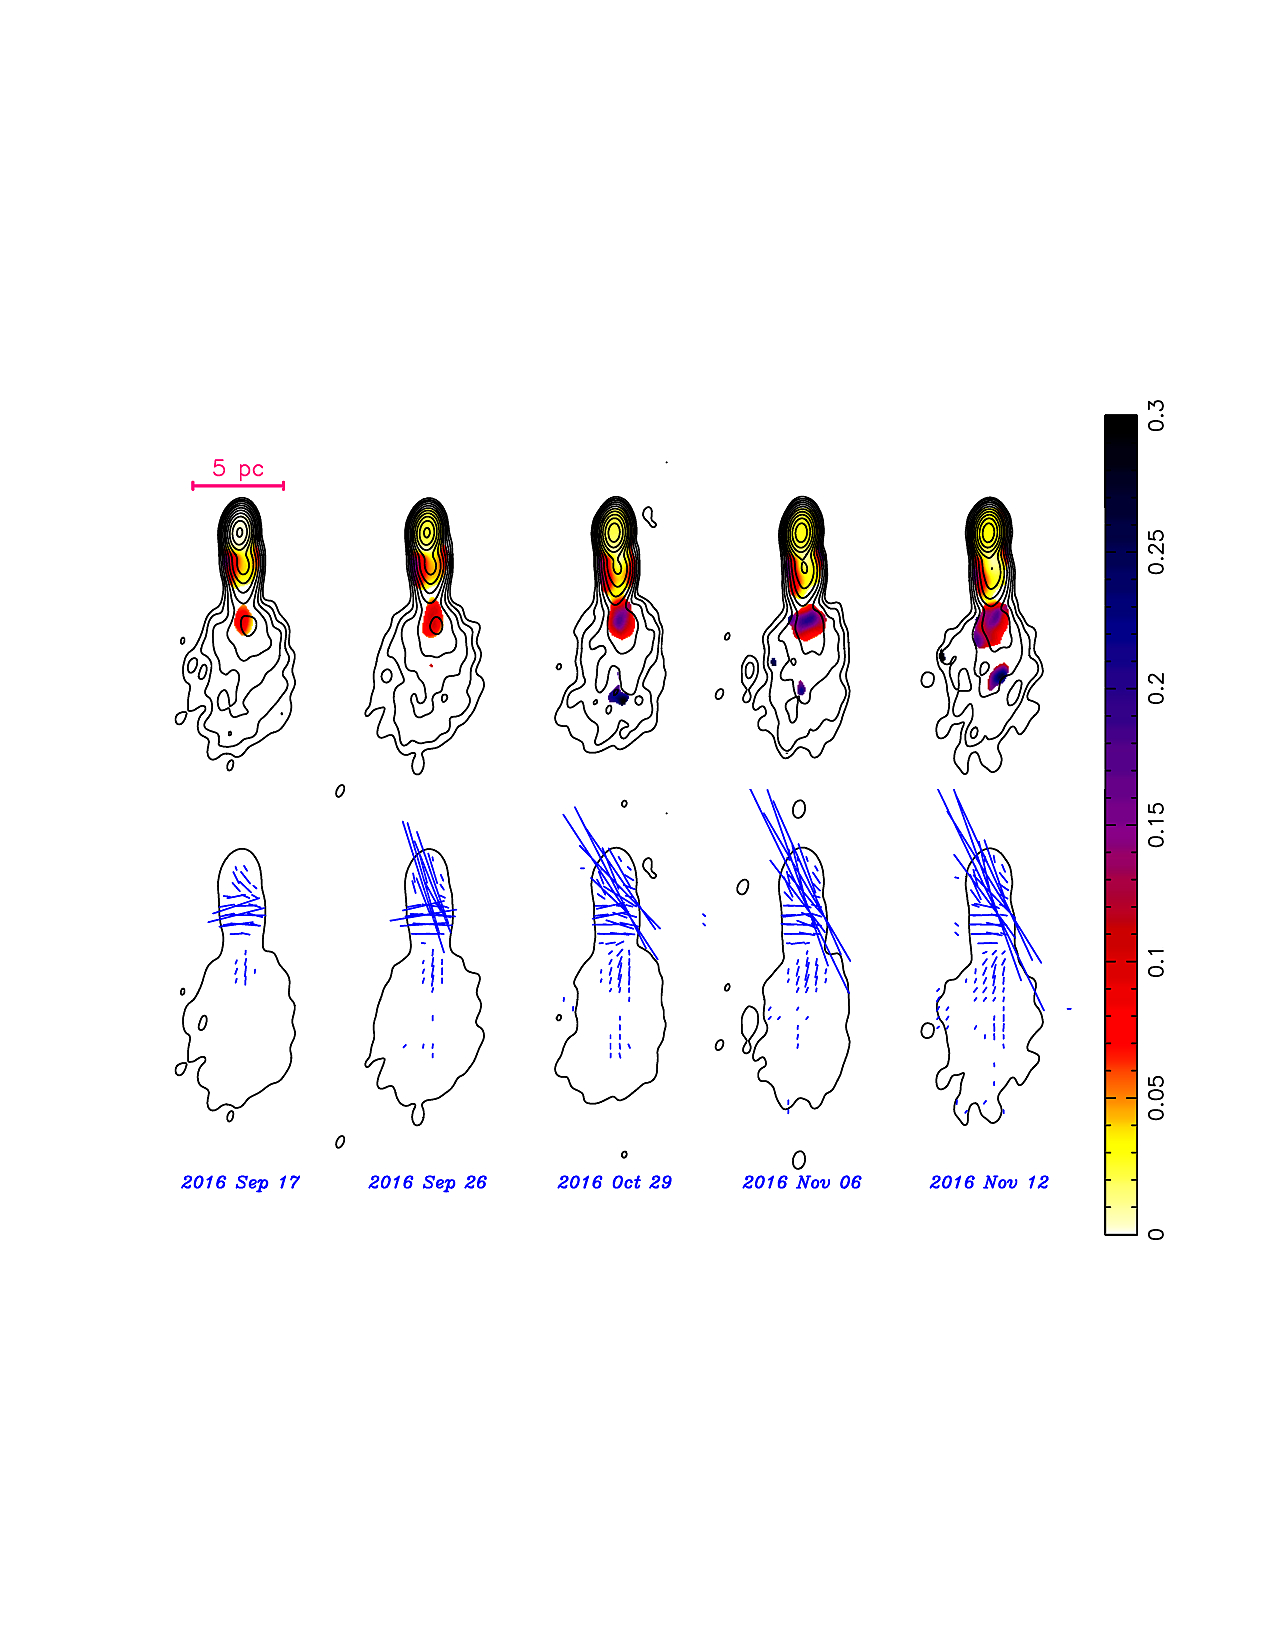
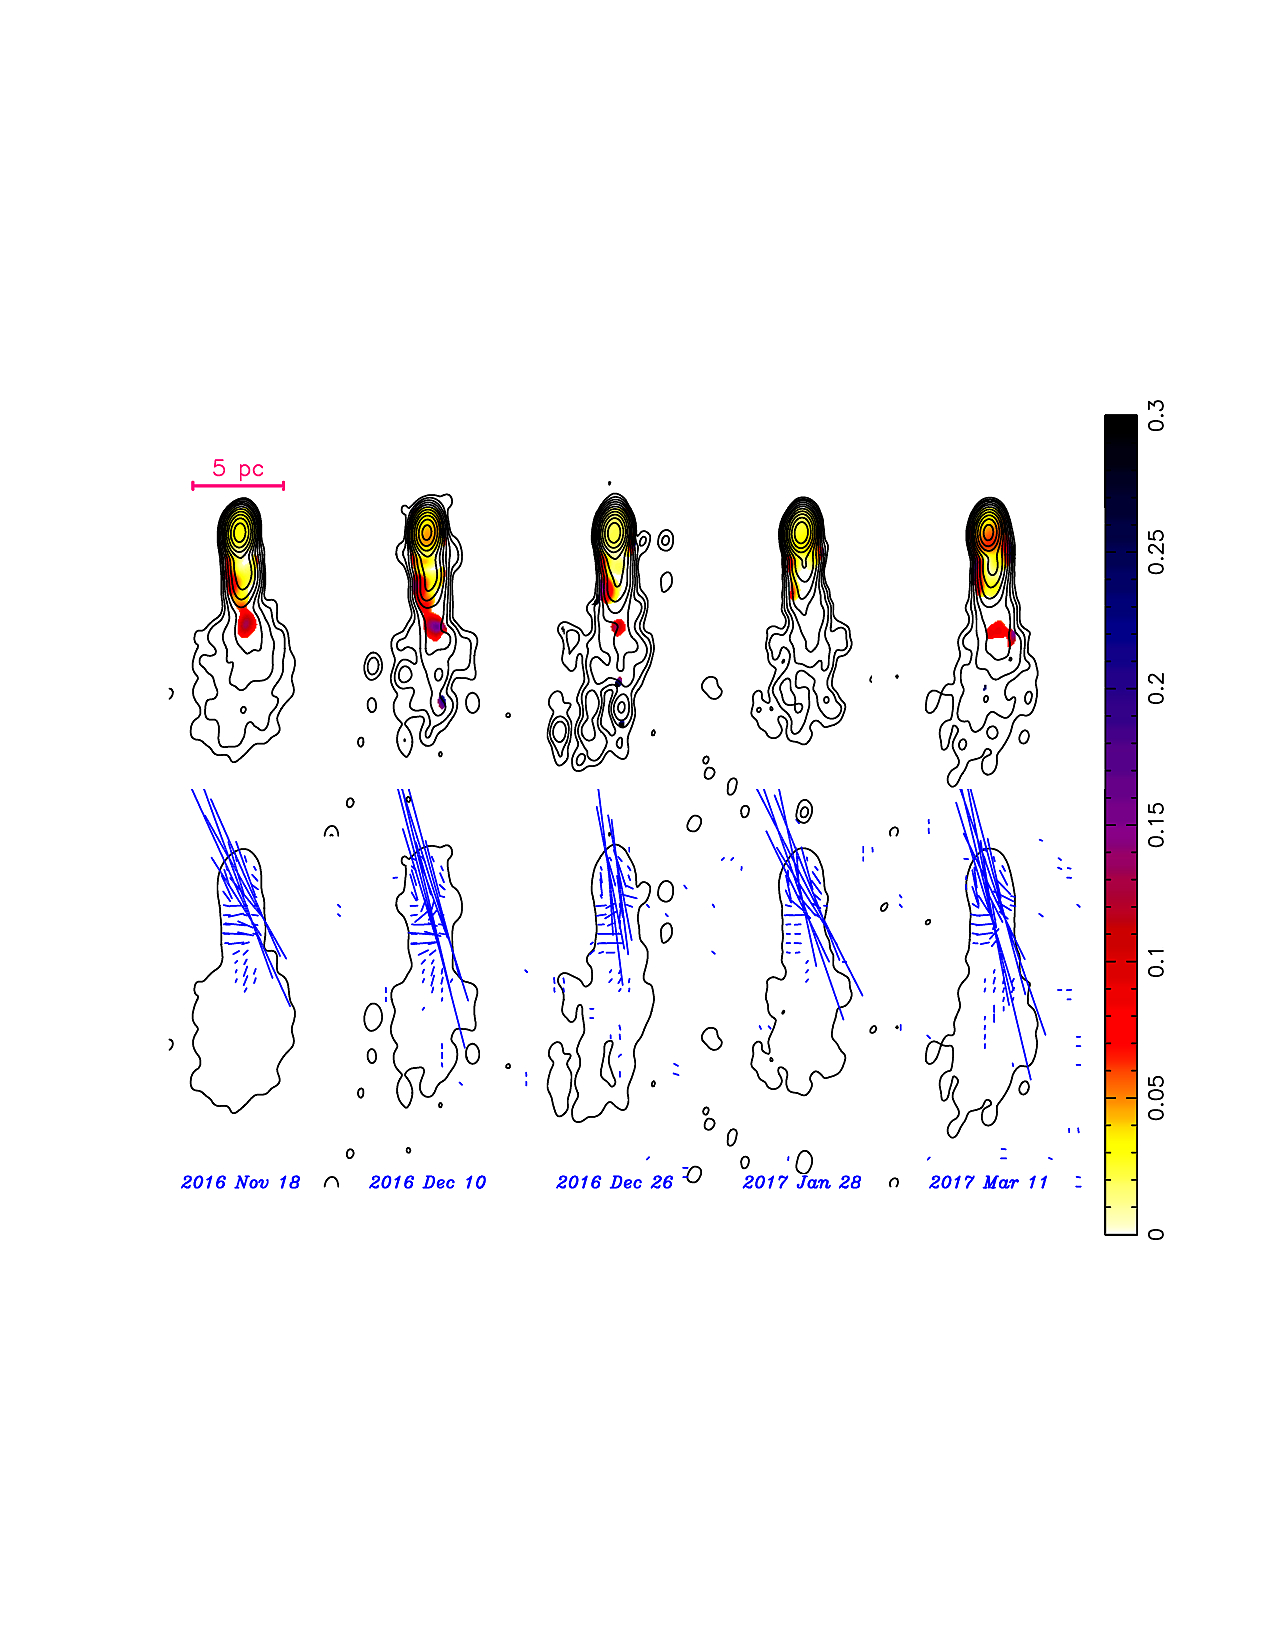
Figure 7: Images of BL Lacertae from VLBA observations at 15.4 GHz for ten epochs. A Gaussian restoring beam with dimensions 0.883 mas x 0.56 mas and a position angle -8.2 deg was used. The colors in the top rows of each panel show the fractional polarized level. The direction of the blue line segments in the bottom rows illustrate the EVPA, and their length corresponds to polarized intensity, the lowest of which shown is 0.5 mJy/beam. The contours show the total intensity, with a base contour of 1.1 mJy/beam in both top and bottom rows, and successive contours increment by factors of two in the top rows. The typical total and polarized intensity image rms values in these images are 0.09 mJy/beam and 0.1 mJy/beam, respectively.
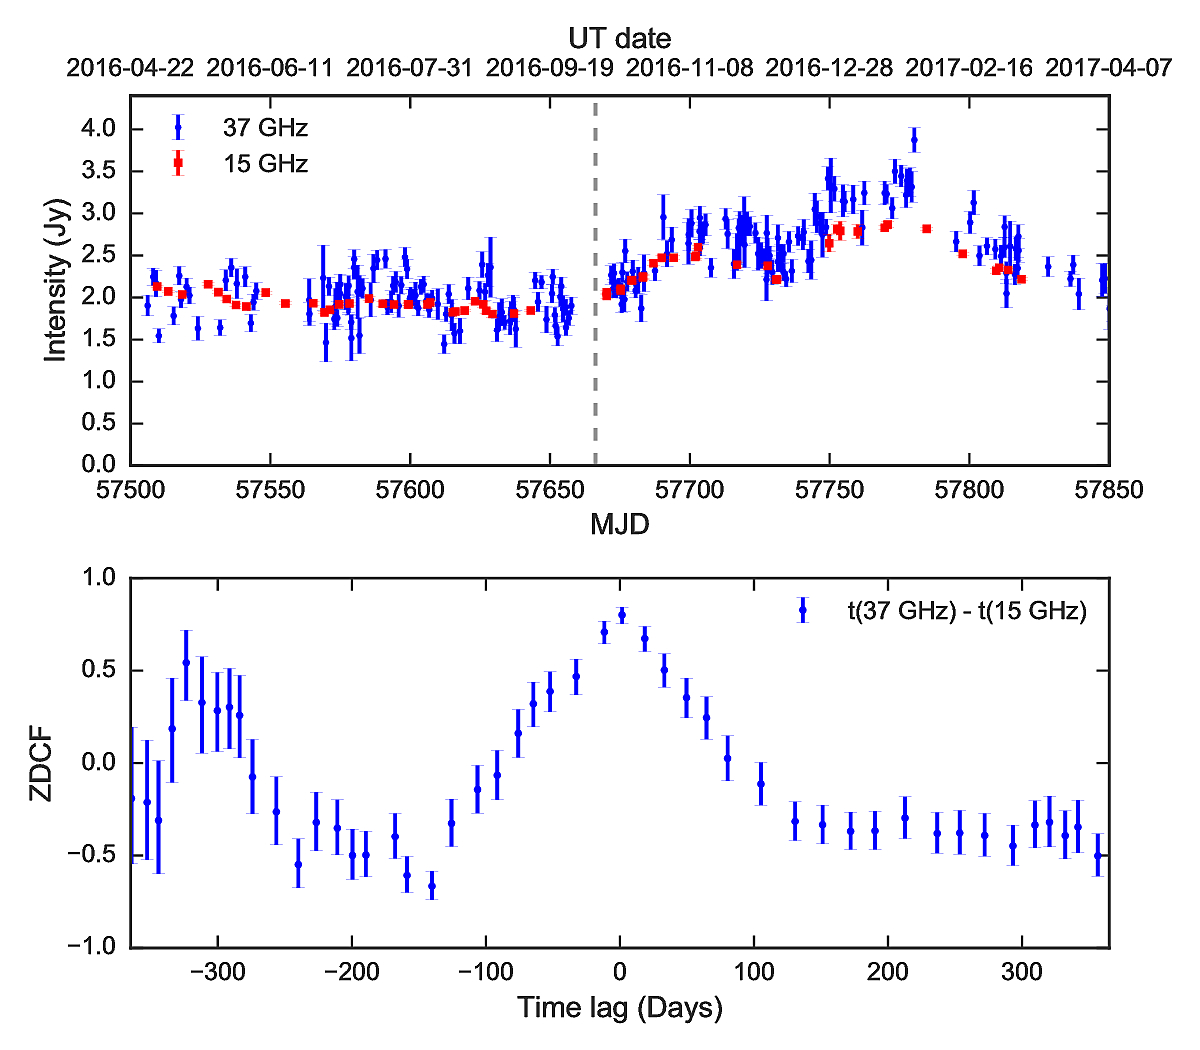
Figure 8: The top panel shows the 37-GHz (blue dots) and 15-GHz (red squares) radio light curves measured over ~1 yr by Metsahovi and OVRO, respectively. The grey dashed line shows the peak time of the TeV flare observed by VERITAS. The bottom panel shows the z-transformed discrete cross correlation between the two light curves above. The time lag values are calculated as the difference in time t between 37~GHz and 15~GHz so that positive time lags correspond to the 37-GHz flux leading the 15-GHz flux.
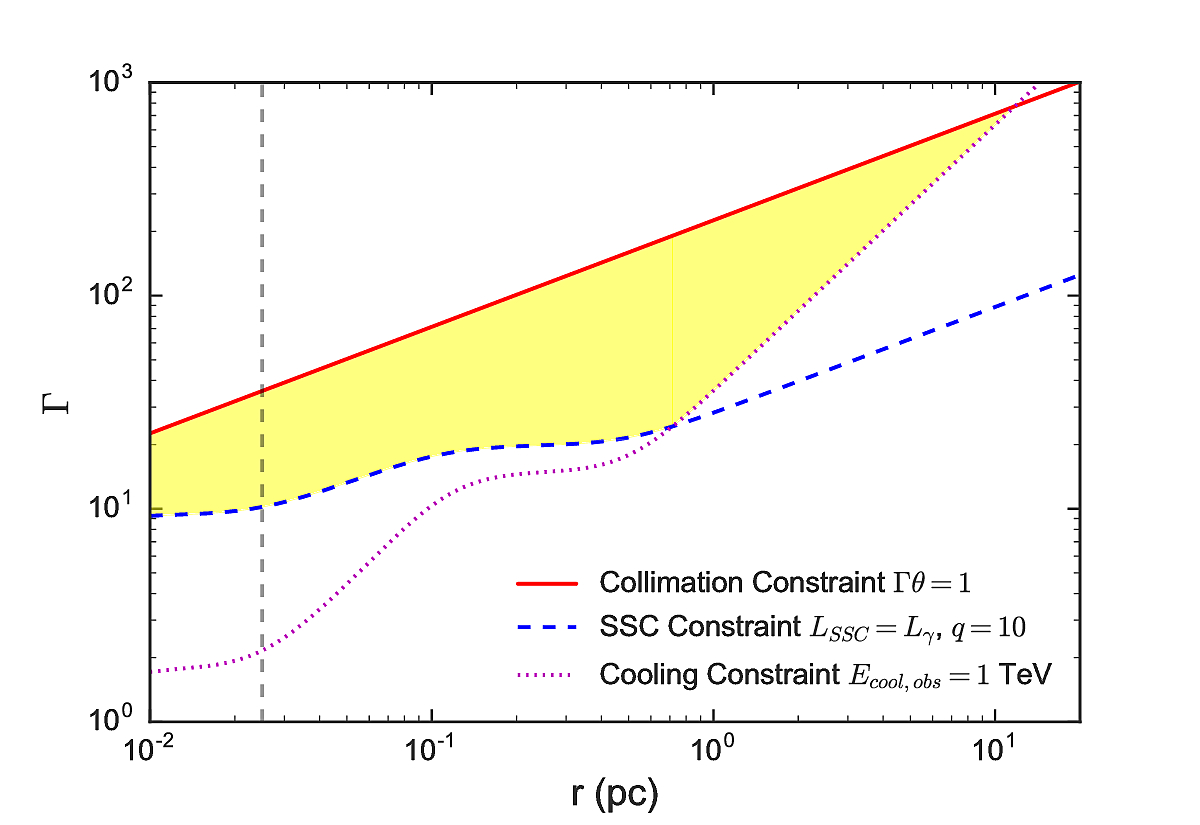
Figure 9: The constraints on the Lorentz factor (Γ) and the distance (r) between the central black hole and the gamma-ray emitting location. The grey vertical dashed line indicates the location of the BLR (0.025 pc) used in the calculation. The yellow shaded region illustrates the allowed parameter space.