
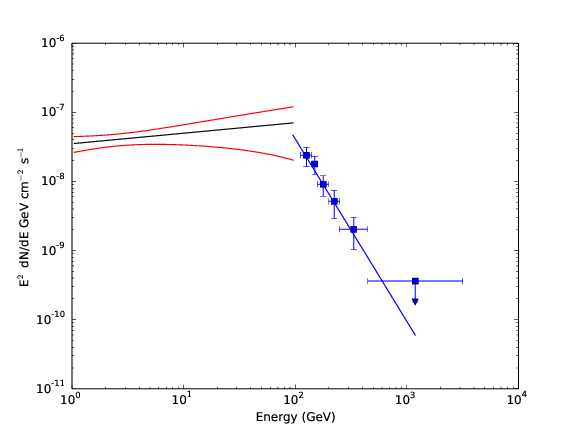
Gamma ray SED of RGB J2243+203 during the flare. See Figure 2 below for details.
Reference: A. U. Abeysekara et al. (The VERITAS Collaboration), Astrophysical Journal Supplement Series 233:7, 2017
Full text version
ArXiv: ArXiV:1709.05403
Contacts: Udara Abeysekara
On 21 December 2014, an automated Fermi-LAT analysis pipeline used by VERITAS collaborators indicated that the daily Fermi-LAT flux of RGB J2243+203 was marginally elevated from the average flux. VERITAS observed the source from 21 December 2014 through 24 December 2014 for a total of 264 minutes of good quality data. The source was detected at 5.6 sigma. This paper reports VERITAS measured flux, light curve, and contemporaneous multiwavelength observations of Fermi-LAT and Swift-XRT. This paper also derives an upper limit of the source redshift, and the location of the very high energy gamma-ray emission.
FITS files: N/A.
Figures from paper (click to get full size image):
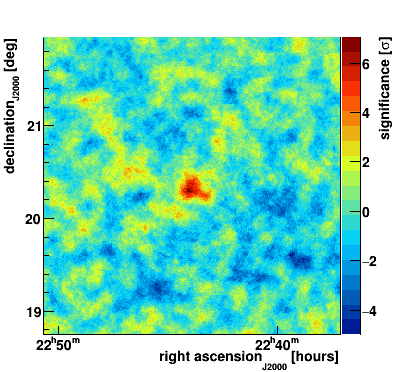
Figure 1: VERITAS skymap of the region around RGB J2243+203.
Figure 2: Gamma ray SED of RGB J2243+203 during the flare from 2014-12-21 01:44:00 UTC to 2014-12-24 03:34:00 UTC (MJD 57012.072 to MJD 57015.14861). The solid black line represents the best fit SED of the Fermi -LAT detection, and the red bow tie represents the one sigma uncertainty of the likelihood fit to the Fermi -LAT data. VERITAS fluxes are shown as blue points, and the solid blue line represents the best fit to the VERITAS data.
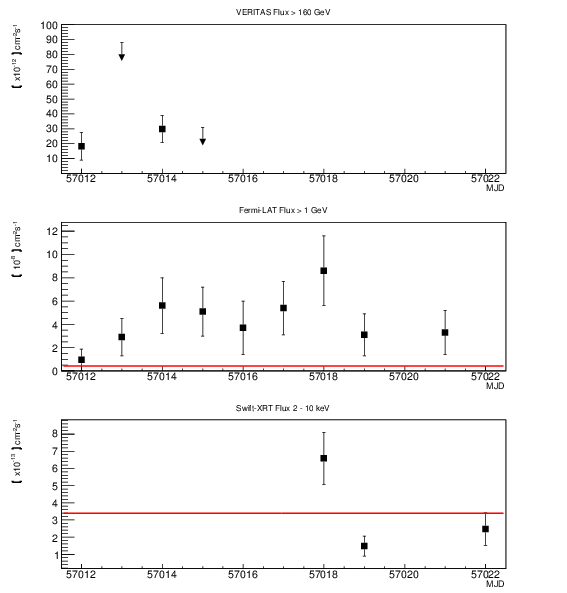
Figure 3: Top: December 2014 VERITAS light curve from the 21st (MJD 57012) to 24th (MJD 57015) in nightly bins. 95% confidence level upper limits are shown for the bins with significance less than 2σ . Middle: Fermi-LAT light curve from 21 (MJD 57012) to 31 December 2014 (MJD 57022) in nightly bins. The red line shows the four-year average flux as reported in the 3FGL catalog. Bottom: Swift -XRT light curve. The red line shows the best fit to a constant.
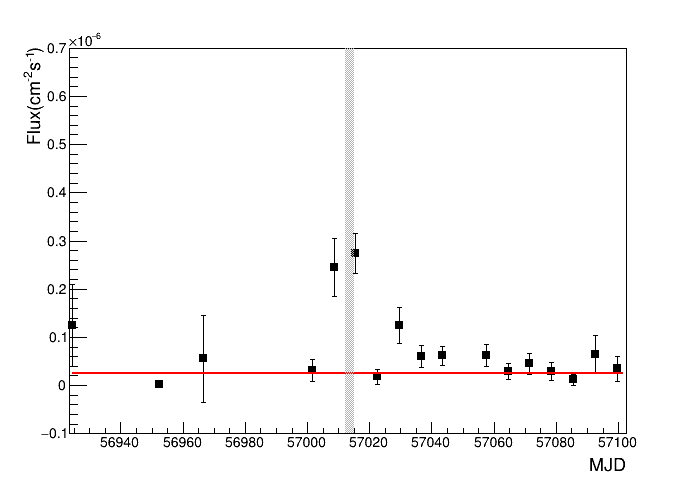
Figure 4: Fermi -LAT light curve of RGB J2243+203 with seven day bins. The solid red line indicates the four-year time-averaged flux reported in the Fermi-LAT 3FGL catalog. Flux measurements are not plotted for bins with TS less than 4. The shaded vertical strip is the VERITAS observation window of the source.
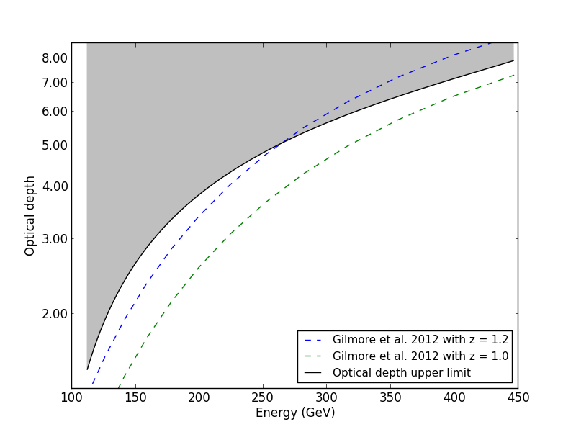
Figure 5: The black solid line indicates the maximum EBL-induced pair absorption optical depth at different energies along the line of sight to RGB J2243+203 that is derived from VERITAS and Fermi-LAT data. Two dashed lines indicate the modeled (Gilmore et al. 2012) EBL-induced pair absorption optical depth as a function of energy for redshifts of 1.2 and 1.0. The shaded area is the excluded region.

Figure 6: The minimum difference between the calculated maximum EBL-induced pair absorption optical depth and the model predicted EBL-induced pair absorption optical depth as a function of redshift.
Figure 7: