Reference: S. Archambault et al. (The VERITAS Collaboration), Astrophysical Journal 835: 288 (2017)
Full text version
ArXiv: ArXiV:1701.00372
Contacts: Elisa Pueschel
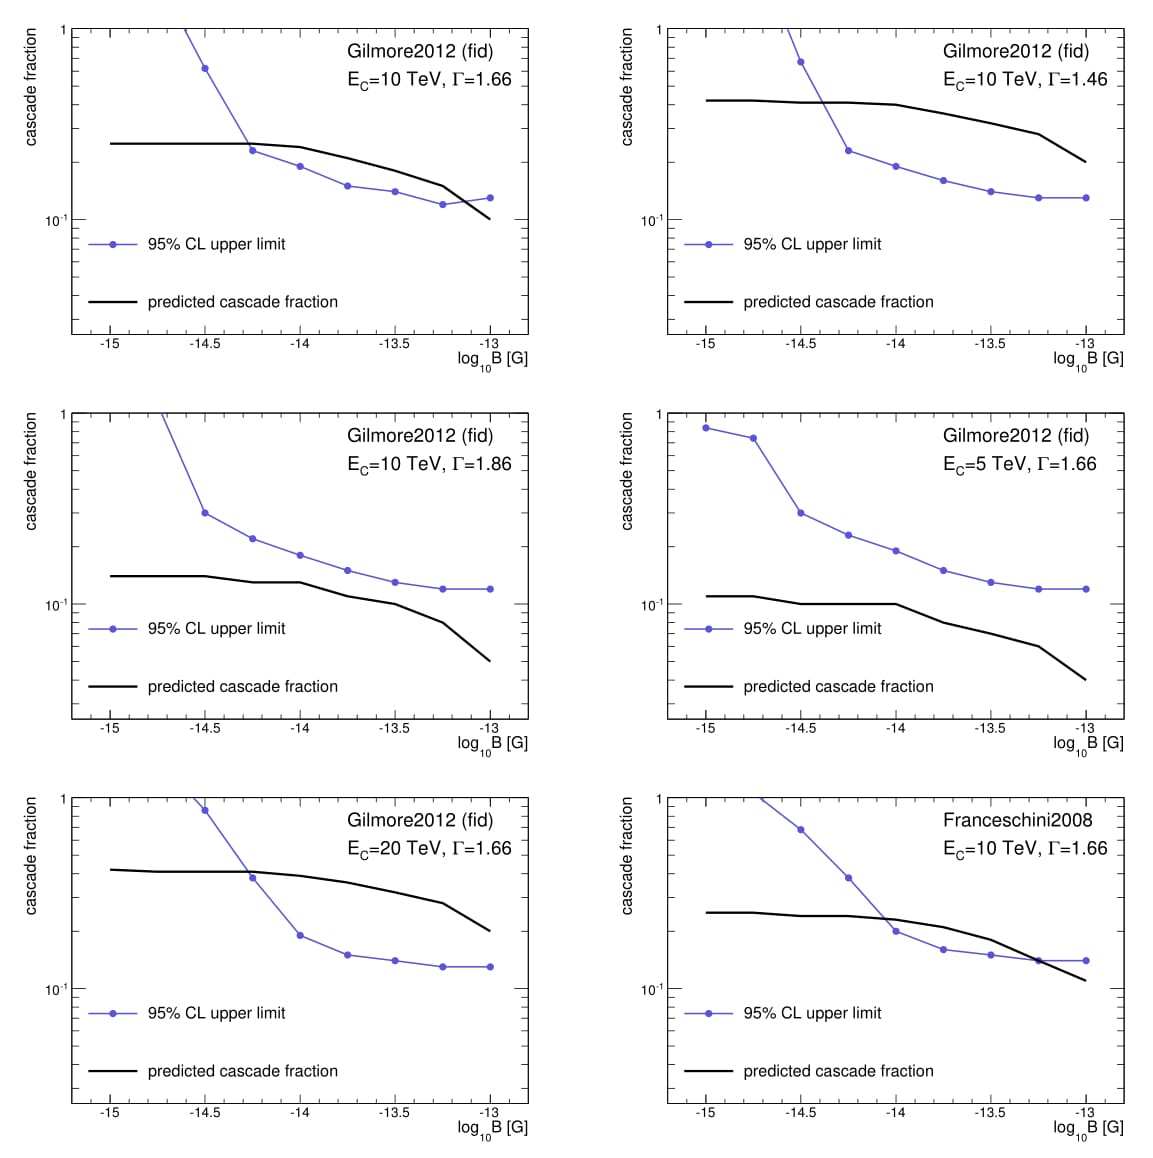
The intergalactic magnetic field (IGMF) is known to be very weak, but the exact strength and correlation length are not known. Measuring these parameters would allow discrimination between competing theories of the field's generation. In this paper, constraints are placed on the IGMF strength via a search for angularly-broadened cascade emission from blazars. Cascade emission is produced when multi-TeV photons from blazars interact with extragalactic background light photons to produce electron-positron pairs, which then interact with cosmic microwave background photons via inverse-Compton scattering to produce gamma-rays. The IGMF deflects the electrons and positrons, leading to an angular broadening and time delay of the cascade component with respect to the unscattered primary emission.
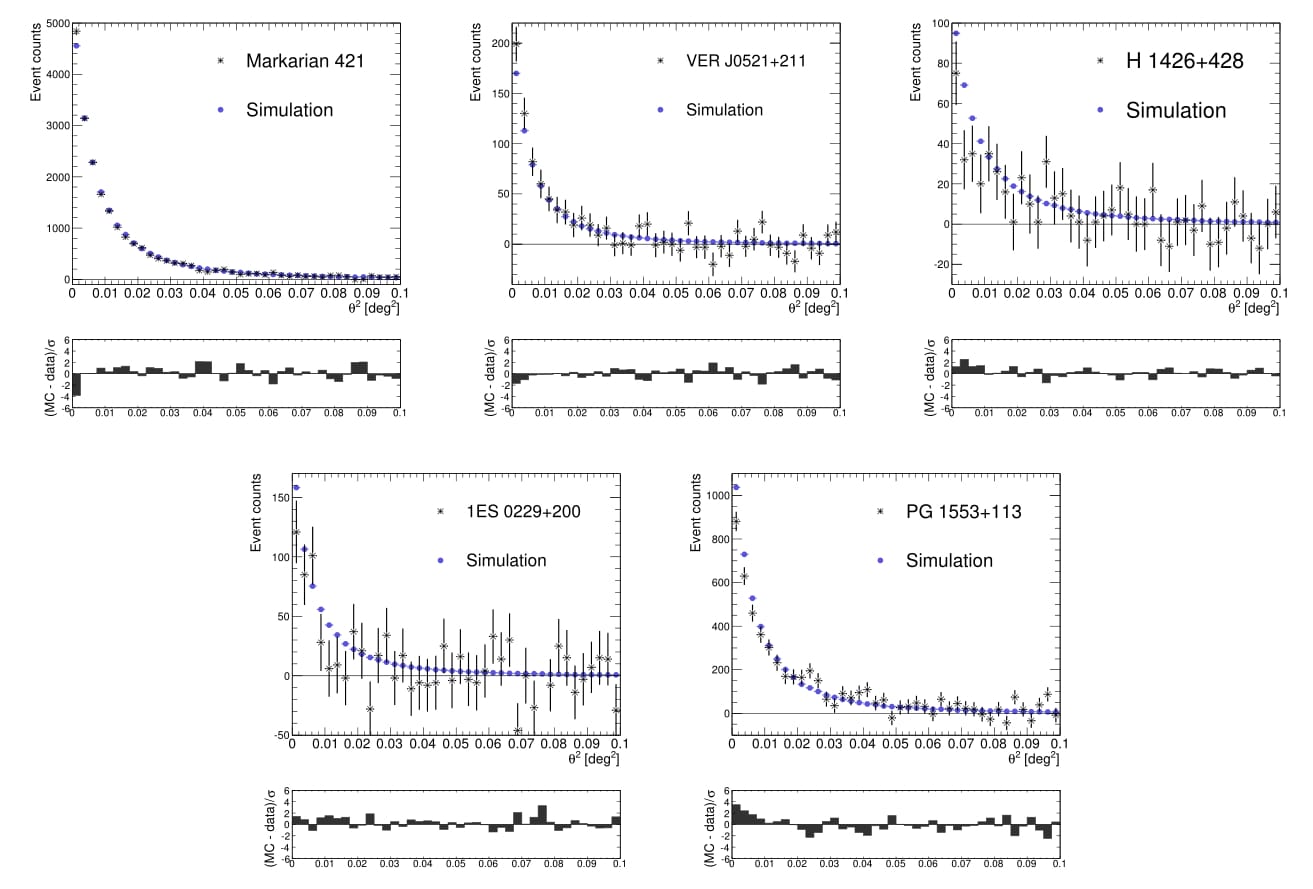
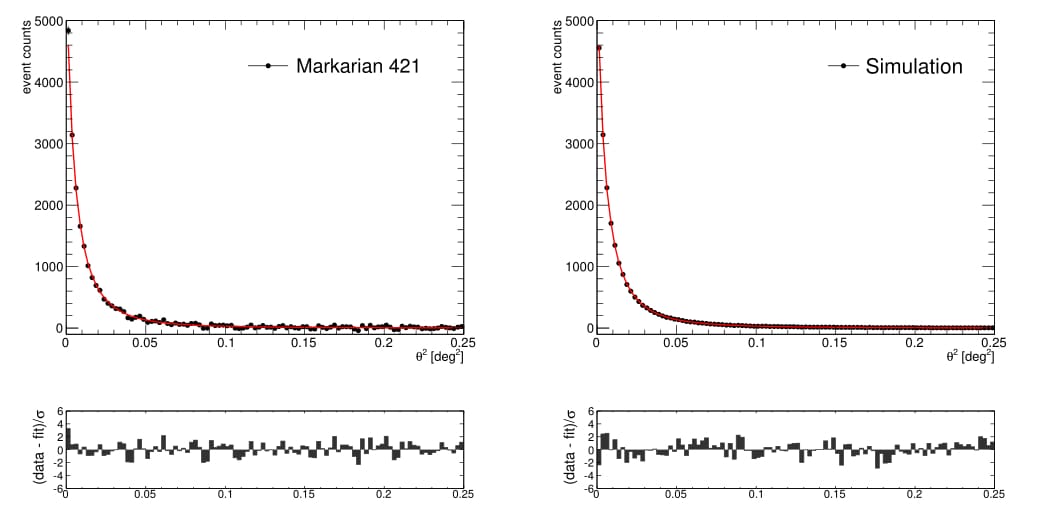
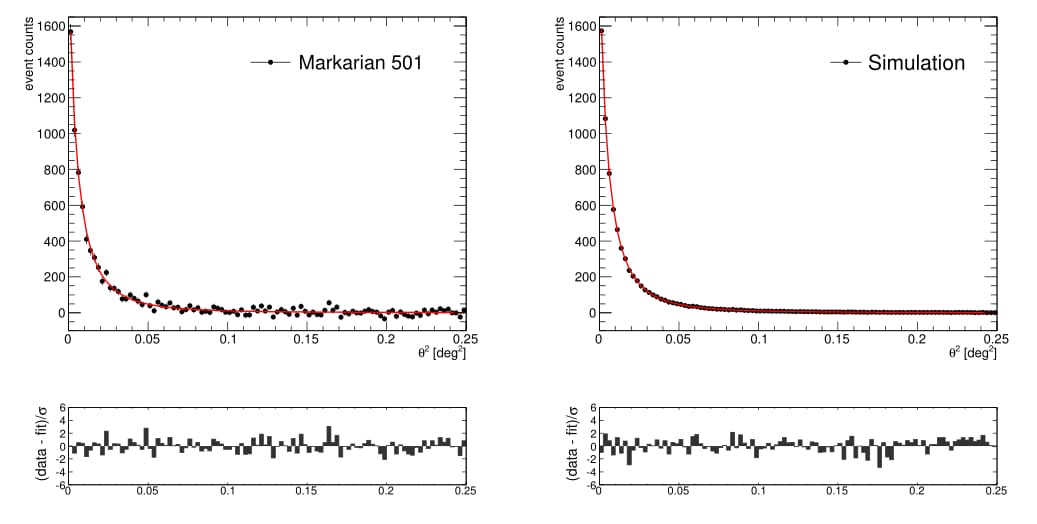
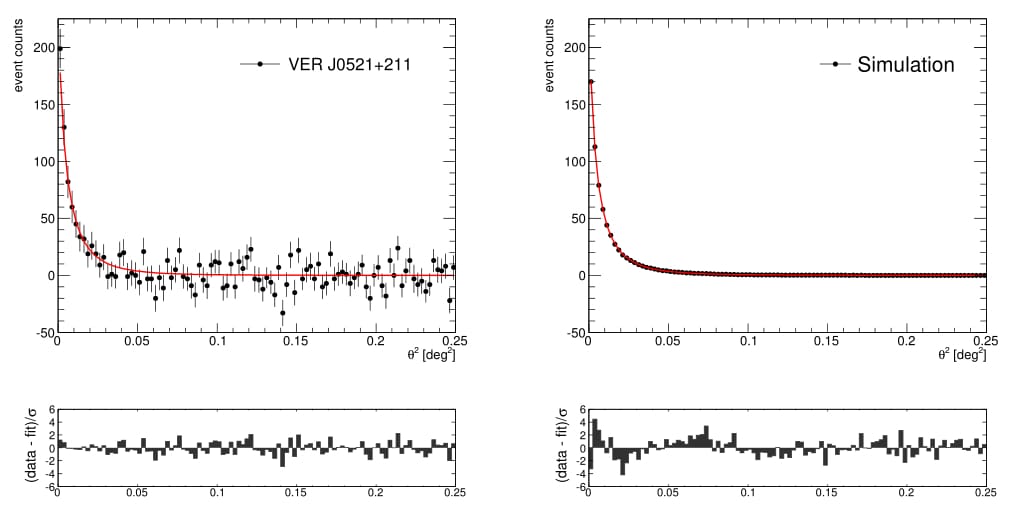
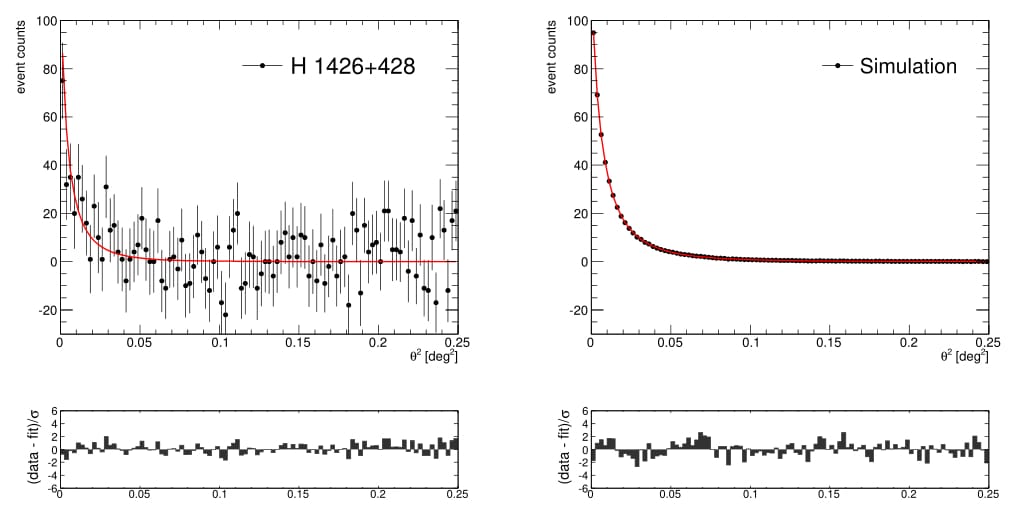
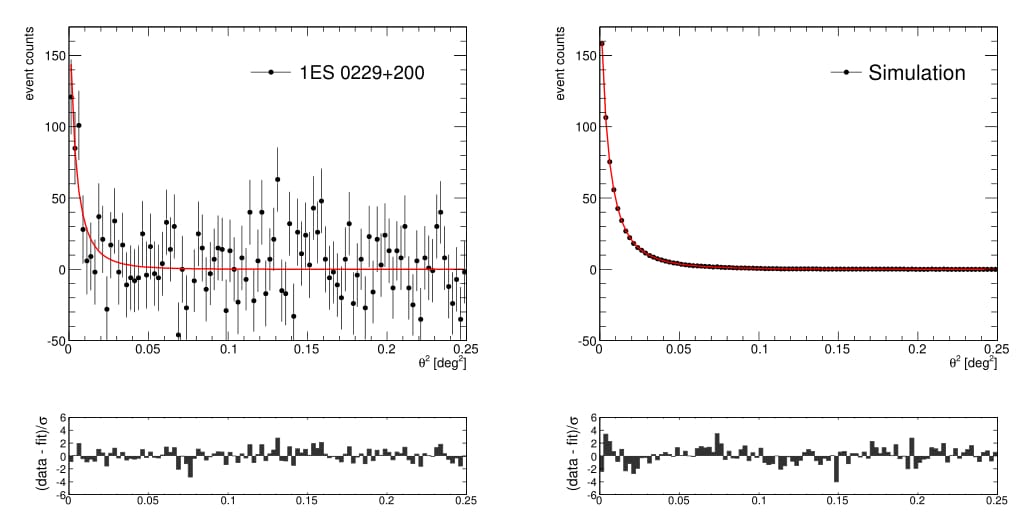
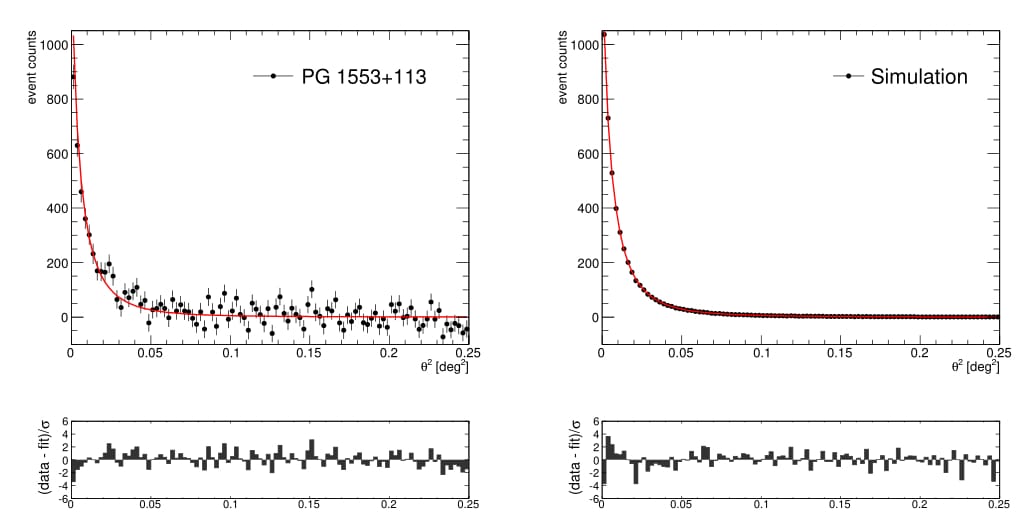
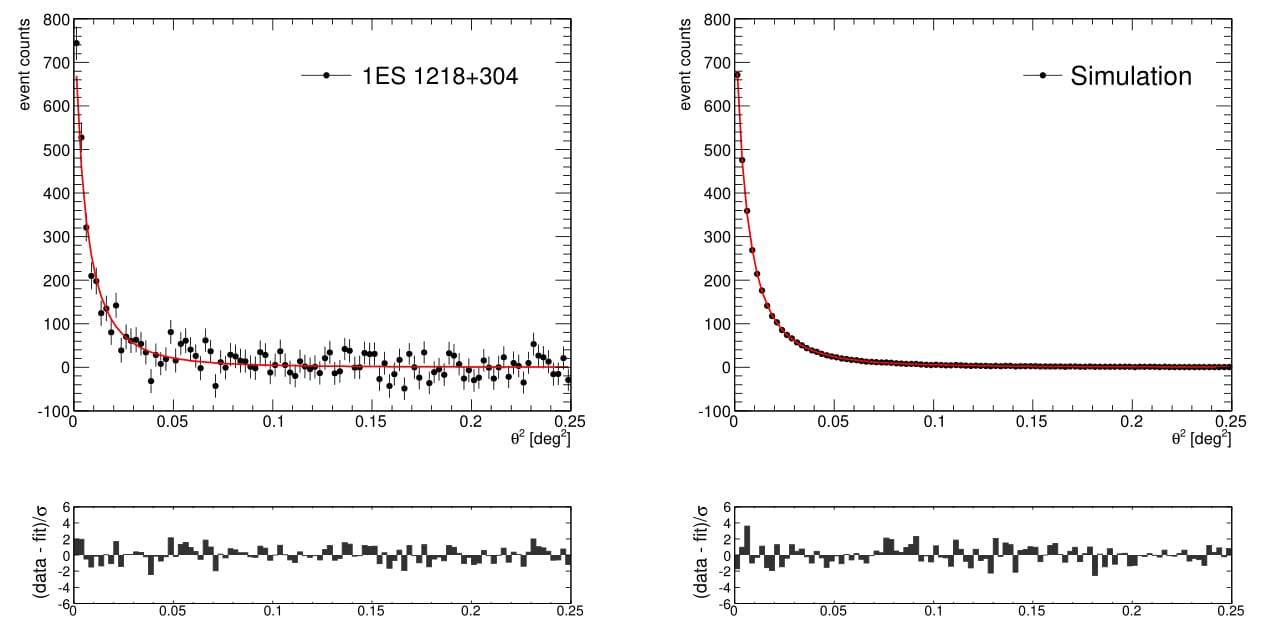
No evidence of angular extension beyond the VERITAS point spread function was found in a study of seven blazars: Mrk 421, Mrk 501, VER J0521+211, H 1426+428, 1ES 0229+200, 1ES 1218+304, and PG 1553+113. The predicted cascade fraction, based on the source's redshift and spectral properties, is greatest for 1ES 1218+304. Based on the non-detection of an angular extension from 1ES 1218+304, an IGMF strength of around 10-14 G is excluded at the 95% confidence level. The exclusion range is found to vary significantly depending on assumptions about the source's intrinsic energy spectrum. Upper
limits on the flux due to extended emission are set for all sources.
FITS files: N/A
Figures from paper (click to get full size image):