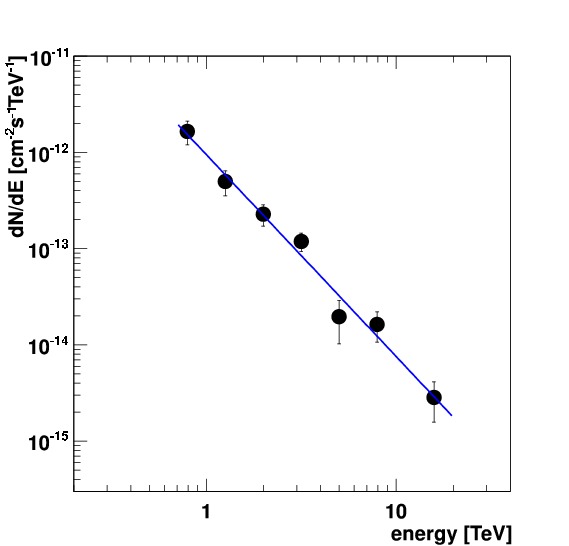
In this paper VERITAS reports on a deep observation of TeV J2032+4130. This source, originally detected in 2002, was the first to have no counter part at any other wavelength. Using almost 50 hours of data the source was detected at 8.7 standard deviations and is found to be extended and asymmetric, with a width of 9.5'±1.2' along the major axis and 4.0'±0.5' along the minor axis. The spectrum is well described by a power-law dN/dE = N0(E/1 TeV)-Γ , with a differential spectral index of Γ = 2.10 ± 0.14stat ± 0.21sys, and normalization N0= (9.5 ± 1.6stat ±2.2sys ) 10-13cm-2s-1TeV-1.
Here we argue that the TeV emission is the result of a pulsar wind associated with the recently discovered Fermi-LAT pulsar PSR J2032+4127, which lies along the major axis of the asymmetry. The integral TeV flux above 1 TeV corresponds to 0.3% of the pulsar's
spin-down power, assuming a distance of 1.7 kpc.
We show that the TeV, X-ray and pulsar properties are similar to those of other detected TeV pulsar wind nebula. Interestingly it is also shown that the morphology of the emission matches void a seen at other wavelengths and no energy dependence to the morphology can be observed.
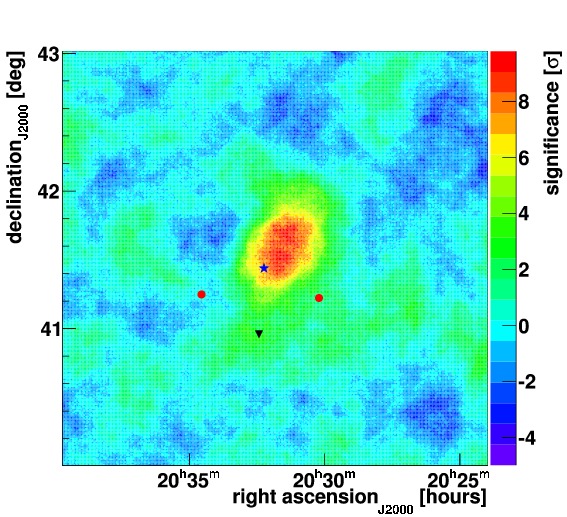
Figure 1: VERITAS gamma-ray signifi cance map centered on VER J2031+415. The color indicates the signi cance within an integration window of 0.23o . The blue star marks the location of the Fermi-LAT pulsar PSR J2032+4127, the black triangle is the location of Cygnus X-3 and the red circles represent the shared wobble locations.
Figure 2: VERITAS di fferential gamma-ray spectrum of VER J2031+415. The blue line shows the power-law t to the data points. A list of flux points can be found in Table 2.
Figure 3: Left : correlated excess maps in the energy bands less than 1.46 TeV, 1.46 to 2.72 TeV and above 2.72 TeV. The white boxes represents a cross-section aligned with the major axis of the excess. The Fermi-LAT pulsar PSR J2032+4127 is marked by the blue star. Right: slices of the uncorrelated excess map. The excess is fi tted to a Gaussian distribution shown by the solid black line. Also plotted is the instrument response to a point source following the same analysis procedure (dotted line). The vertical dotted line represents the position of the Fermi-LAT pulsar. See text for details.
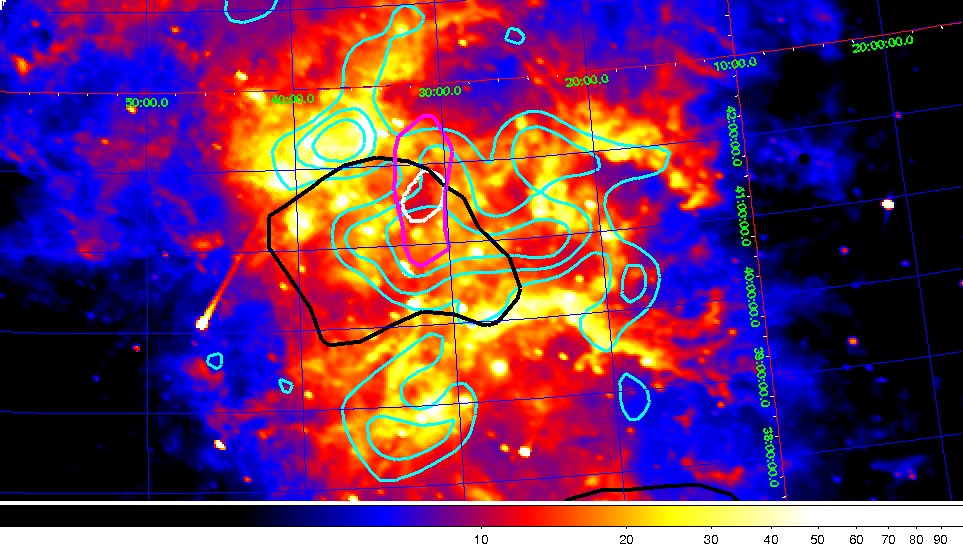
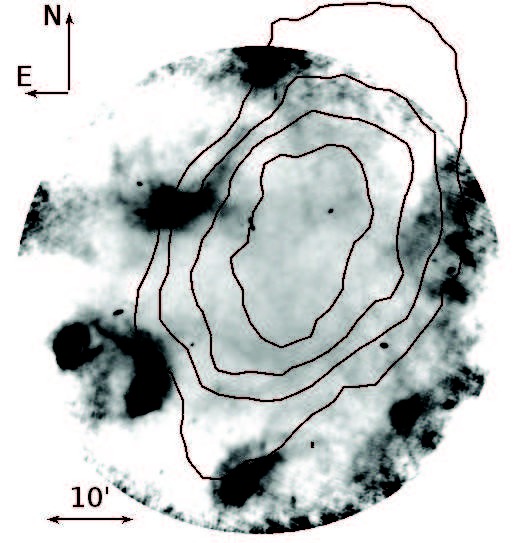
Figure 4: MSX 8 m infrared survey (color, W m-2 sr-1, in log scale) for the region around VER J2031+415. The black, magenta and white contours represent the Milagro, ARGO and VERITAS 5 standard deviation level. The Fermi-LAT 0.16, 0.24 and 0.32 photons/bin contours are shown in cyan.
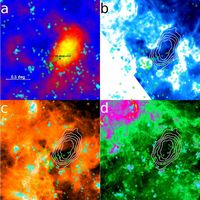
Figure 5: VER J2031+415 and its vicinity at diff erent wavelengths. a: VERITAS significance map with the position of Fermi-LAT PSR J2032+4127 indicated by a black cross. b: 1.4 GHz image from the Canadian Galactic Plane Survey (CGPS; Taylor et al. (2003)). c: Spitzer MIPS 24 m image from the MIPSGAL survey (Rieke et al. 2004). d: Spitzer GLIMPSE 8 m image (Churchwell et al. 2009; Benjamin et al. 2003). In images b, c, and d the VERITAS signi cance contours from 4 to 8 standard deviations are shown as white curves. Green circles are OB stars (Comer on & Pasquali 2012). Cyan circles are star forming regions Avedisova (2002).
Figure 6: VLA 20-cm (L-band) image with VERITAS 4 to 8 contours overlaid (Condon et al. 1998).
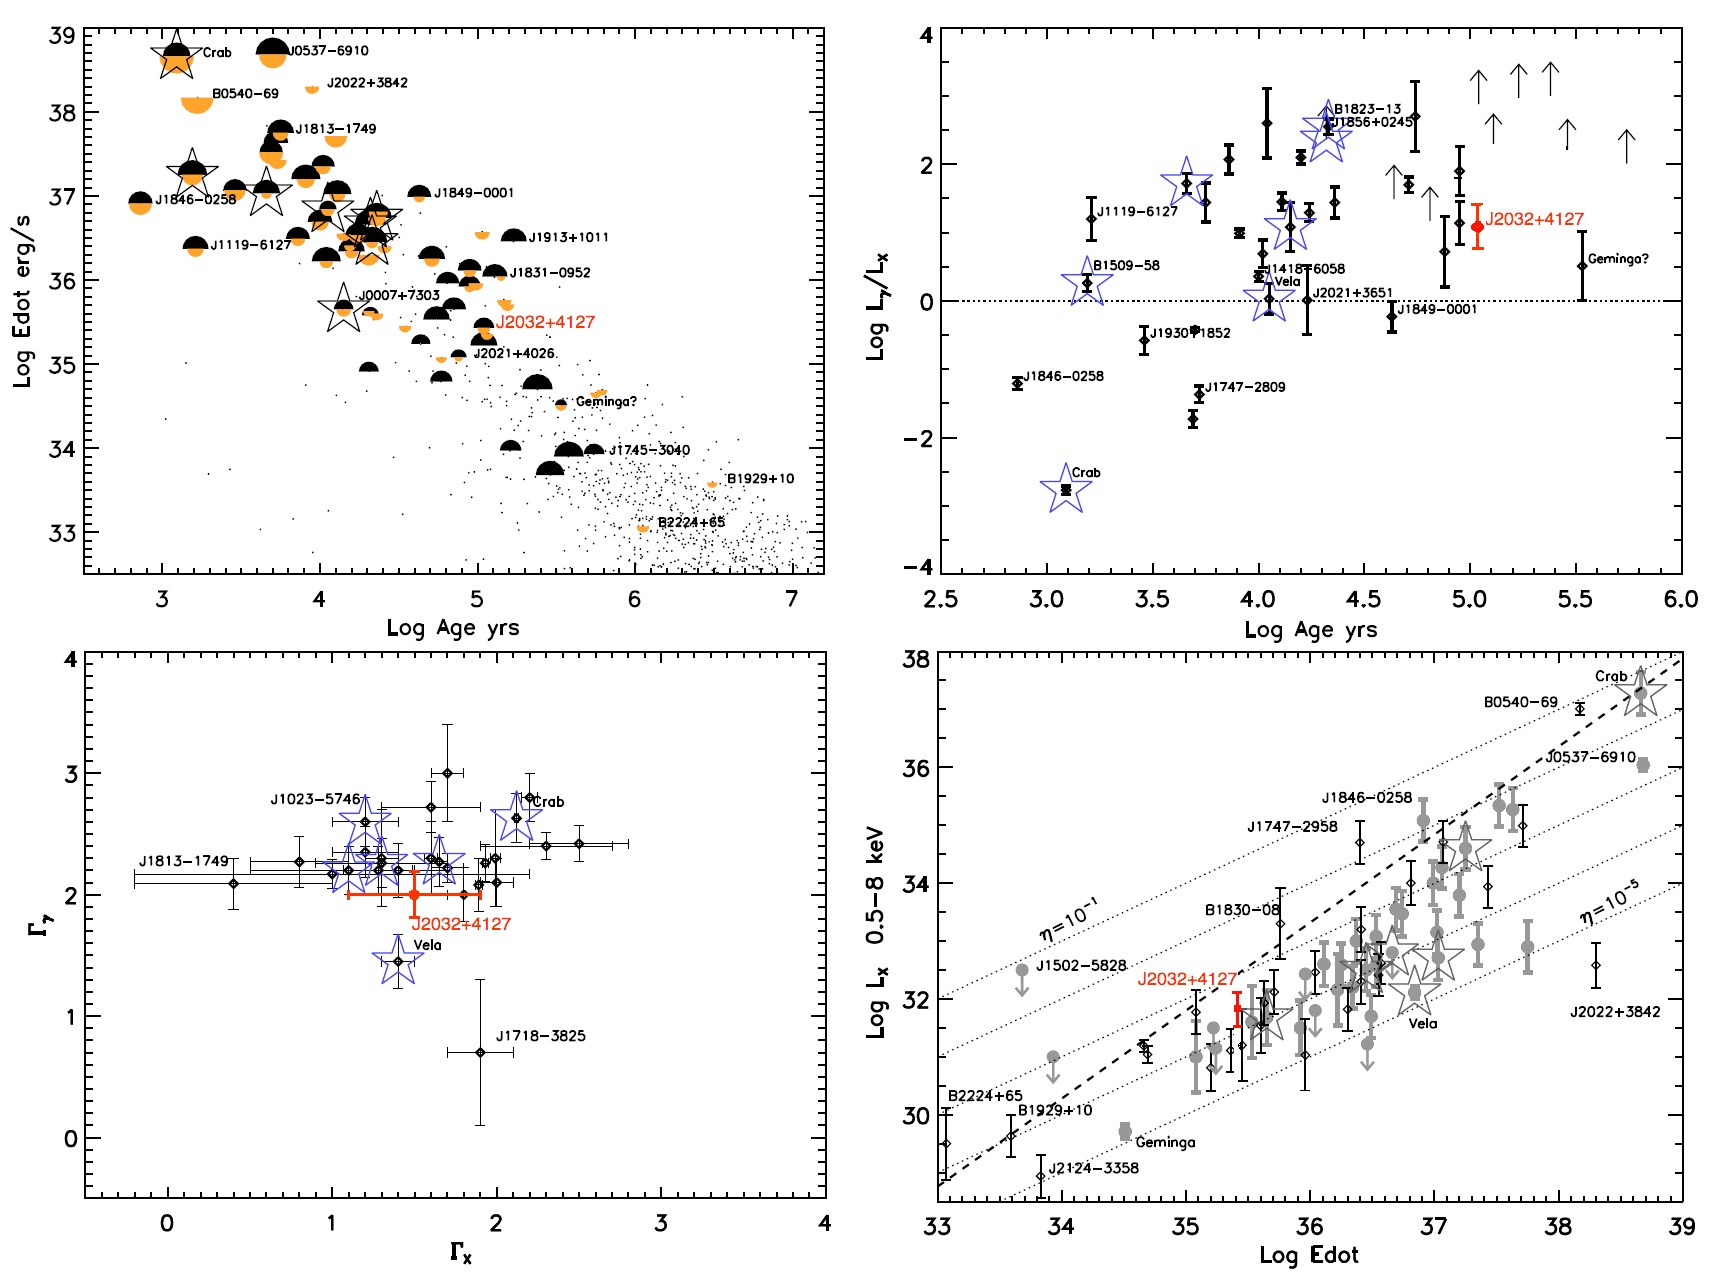
Figure 7: Top left: Pulsars with detected PWNe (or PWN candidates) in the τsd-E-dot diagram. The semi-circles correspond to X-ray (orange) and TeV (black) PWNe, their sizes are proportional to logarithms of the corresponding PWN luminosities. The small black dots denote the pulsars from the ATNF catalog Manchester et al. (2005). Pulsars with PWNe detected by Fermi are marked by stars. Top right: TeV-to-X-ray luminosity ratio vs. pulsar's age for PWNe and PWN candidates. Limits are shown by arrows. The PWNe detected by Fermi are marked by stars. Uncertain detections are shown by thin lines. The dotted lines corresponds to LΥ = LX. Bottom left: TeV vs. X-ray photon indices for PWNe and PWN candidates. Bottom right: X-ray luminosities of PWNe and PWN candidates vs. pulsar's E-dot. TeV PWNe and TeV PWN candidates are shown with grey thick error bars. The dotted straight lines correspond to constant X-ray effi ciencies; the upper bound, log LcrX = 1.51logdotE - 21.4, is shown by a dashed line. The PWNe detected in GeV by Fermi are marked by stars. Figures adapted from Kargaltsev et al. (2013). In all panels PWN of PSR J2032+4127 is marked in red.