The detection of GeV/TeV emission from X-ray binaries (XRBs) has established a new class of high-energy (HE, >0.1 GeV) and very-high-energy (VHE, >100 GeV) gamma-ray emitters. XRBs are formed by a compact object, either a neutron star or a black hole, and by an optical companion star. Some of these XRBs are known to possess collimated relativistic jets, and are called microquasars. VERITAS has conducted observations of the microquasar Cygnus X-3. Many theoretical models predict VHE emission when these sources manifest persistent relativistic jets or transient ejections. In light of these considerations, VERITAS has been employed to study Cygnus X-3 for possible TeV emission. With the aid of VERITAS, it can be possible to cast light on the particular conditions which could trigger VHE emission. This can help us understand the mechanisms that may trigger VHE gamma-ray emission, thus improving our knowledge of particle acceleration and radiative processes in the jets. The implications have far reaching consequences on the understanding of other microquasars and also of active galactic nuclei, which are in many ways similar to microquasars and are prominent VHE gamma-ray sources themselves.
FITS files: not yet available.
Figures from paper (click to get full size image):
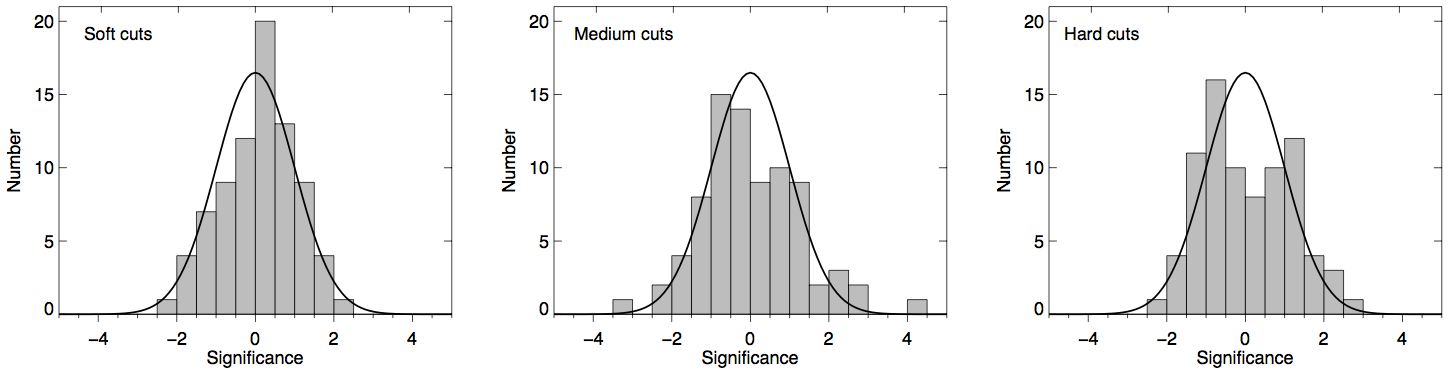
Figure 1: Gaussian signi cance (in units of σ ) distributions for VERITAS nightly searches. The results from di fferent data cuts are shown separately. The Gaussian functions with mean zero and σ one are shown in solid lines.
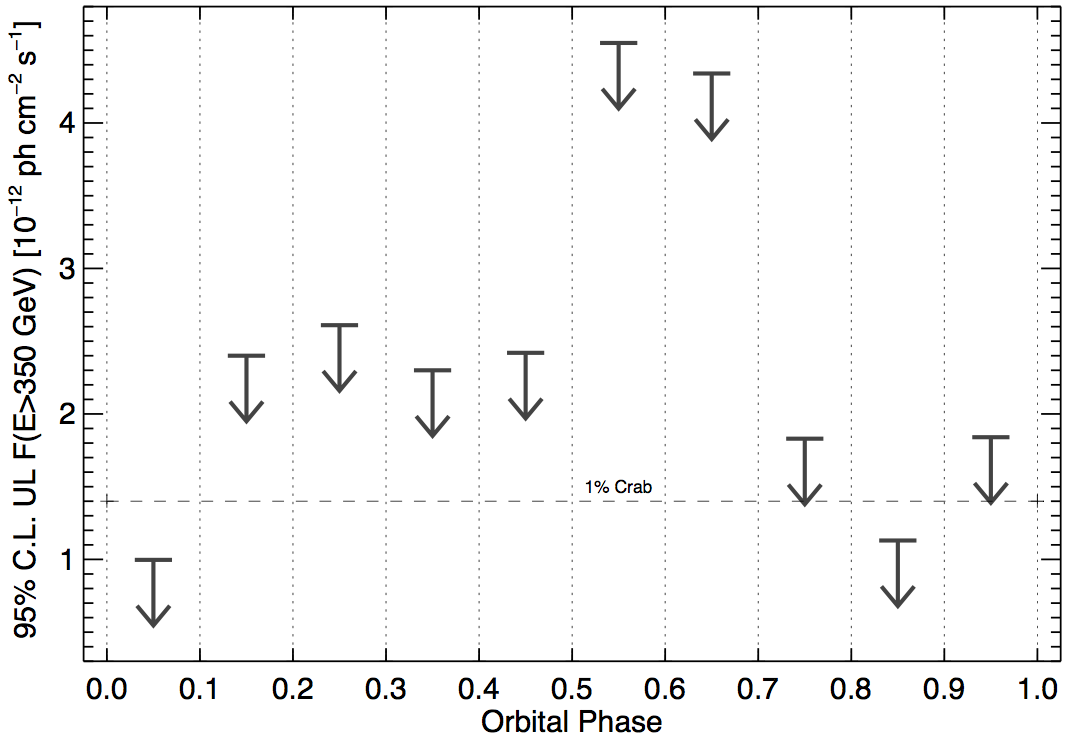
Figure 2: VERITAS phase-folded 95% C.L. integral (E > 350 GeV) flux upper limits of Cygnus X-3. For reference, the level of 1% Crab is indicated (in dashed line).
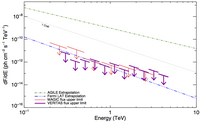
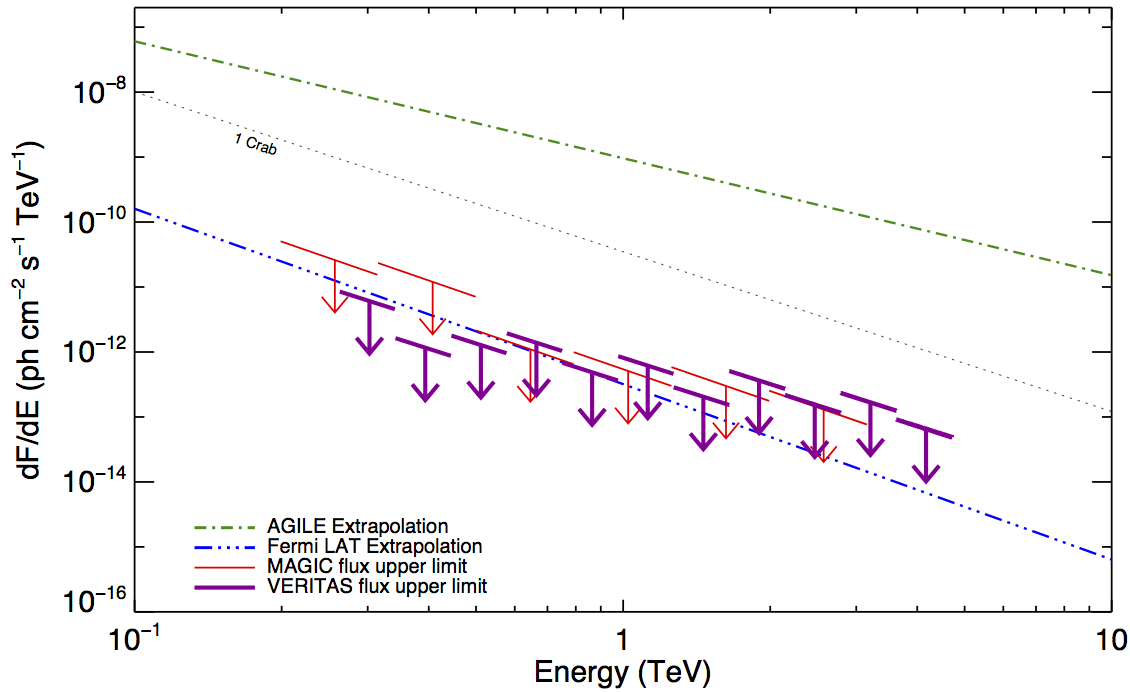
Figure 3: VERITAS 95% C.L. di fferential flux upper limits of Cygnus X-3. For comparison, the published MAGIC upper limits are shown in (red) thin solid lines. See Figure 1 and Table 2 of Aleksi c et al. (2010) for further details concerning the MAGIC results. A nominal spectrum of the Crab Nebula is shown in the (black) dotted line, for reference. The (blue) dot-dot-dot-dashed line and (green) dot-dashed line show the extrapolations of the power-law spectra measured with the Fermi LAT and AGILE at GeV energies, respectively.
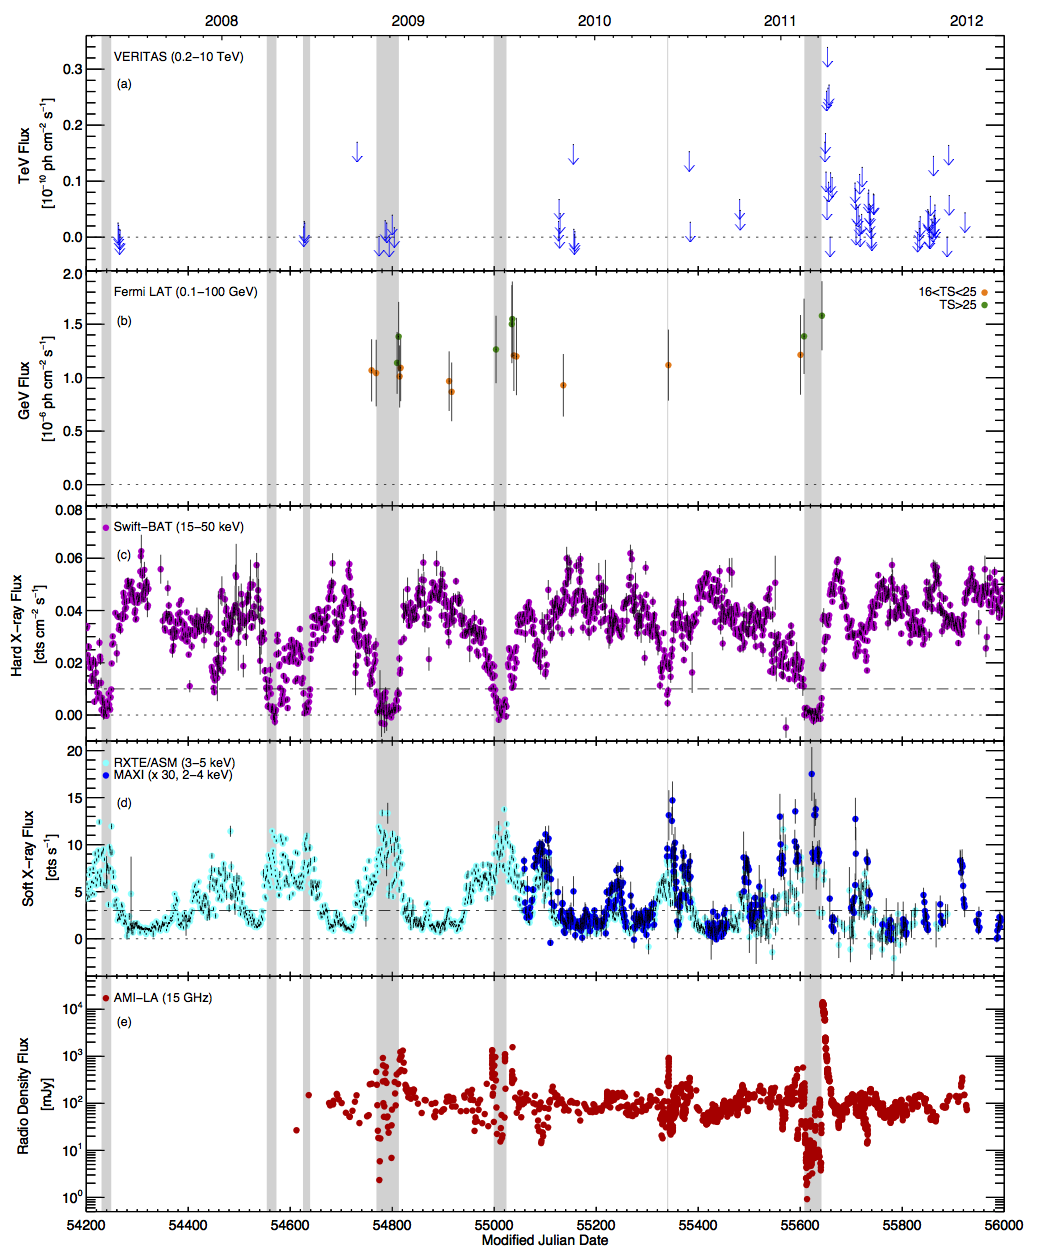
Figure 4: Multi-wavelength light curves of Cygnus X-3. Panels (a): TeV gamma ray. The VERITAS 99% C.L. integral (E >263 GeV) flux upper limits are shown for individual nights. (b): GeV gamma ray. The data points are color-coded by the detection signi cance: moderate signifi cance (16< TS < 25) in orange, and high signifi cance (TS>25) in green. (c): Hard X-ray. (d): Soft X-ray. The ASM 3-5 keV measurements are shown in cyan and the MAXI 2-4 keV measurements in blue. Note that the MAXI flux values have been multiplied by 30 for clarity. (e): Radio. The AMI-LA 15 GHz measurements are shown. The shaded areas indicate the quenched state. The dot-dashed line in (c) and (d) shows roughly the threshold for transition into or out of the quenched state.