Leptonic model, under the assumption of PWN as the source class. For more details, see Figure 4.
Reference: C.B. Adams et al. (The VERITAS, HAWC, and XMM-Newton Collaborations), Accepted for publication in ApJ. (2025)
Full text version
We report observations of the ultra-high-energy gamma-ray source LHAASO J2108+5157, utilizing VERITAS, HAWC, Fermi-LAT, and XMM-Newton. VERITAS has collected ~40 hours of data that we used to set ULs to the emission above 200 GeV. The HAWC data, collected over ~2400 days, reveal emission between 3 and 146 TeV, with a significance of 7.5𝝈 , favoring an extended source model. The best-fit spectrum measured by HAWC is characterized by a simple power-law with a spectral index of 2.45 ±0.11stat. Fermi-LAT analysis finds a point source with a very soft spectrum in the LHAASO J2108+5157 region, consistent with the 4FGL-DR3 catalog results. The XMM-Newton analysis yields a null detection of the source in the 2 - 7 keV band. The broadband spectrum can be interpreted as a pulsar and a pulsar wind nebula system, where the GeV gamma-ray emission originates from an unidentified pulsar, and the X-ray and TeV emission is attributed to synchrotron radiation and inverse Compton scattering of electrons accelerated within a pulsar wind nebula. In this leptonic scenario, our X-ray upper limit provides a stringent constraint on the magnetic field, which is <1.5 µG.
FITS files: N/A
Figures from paper (click to get full size image):
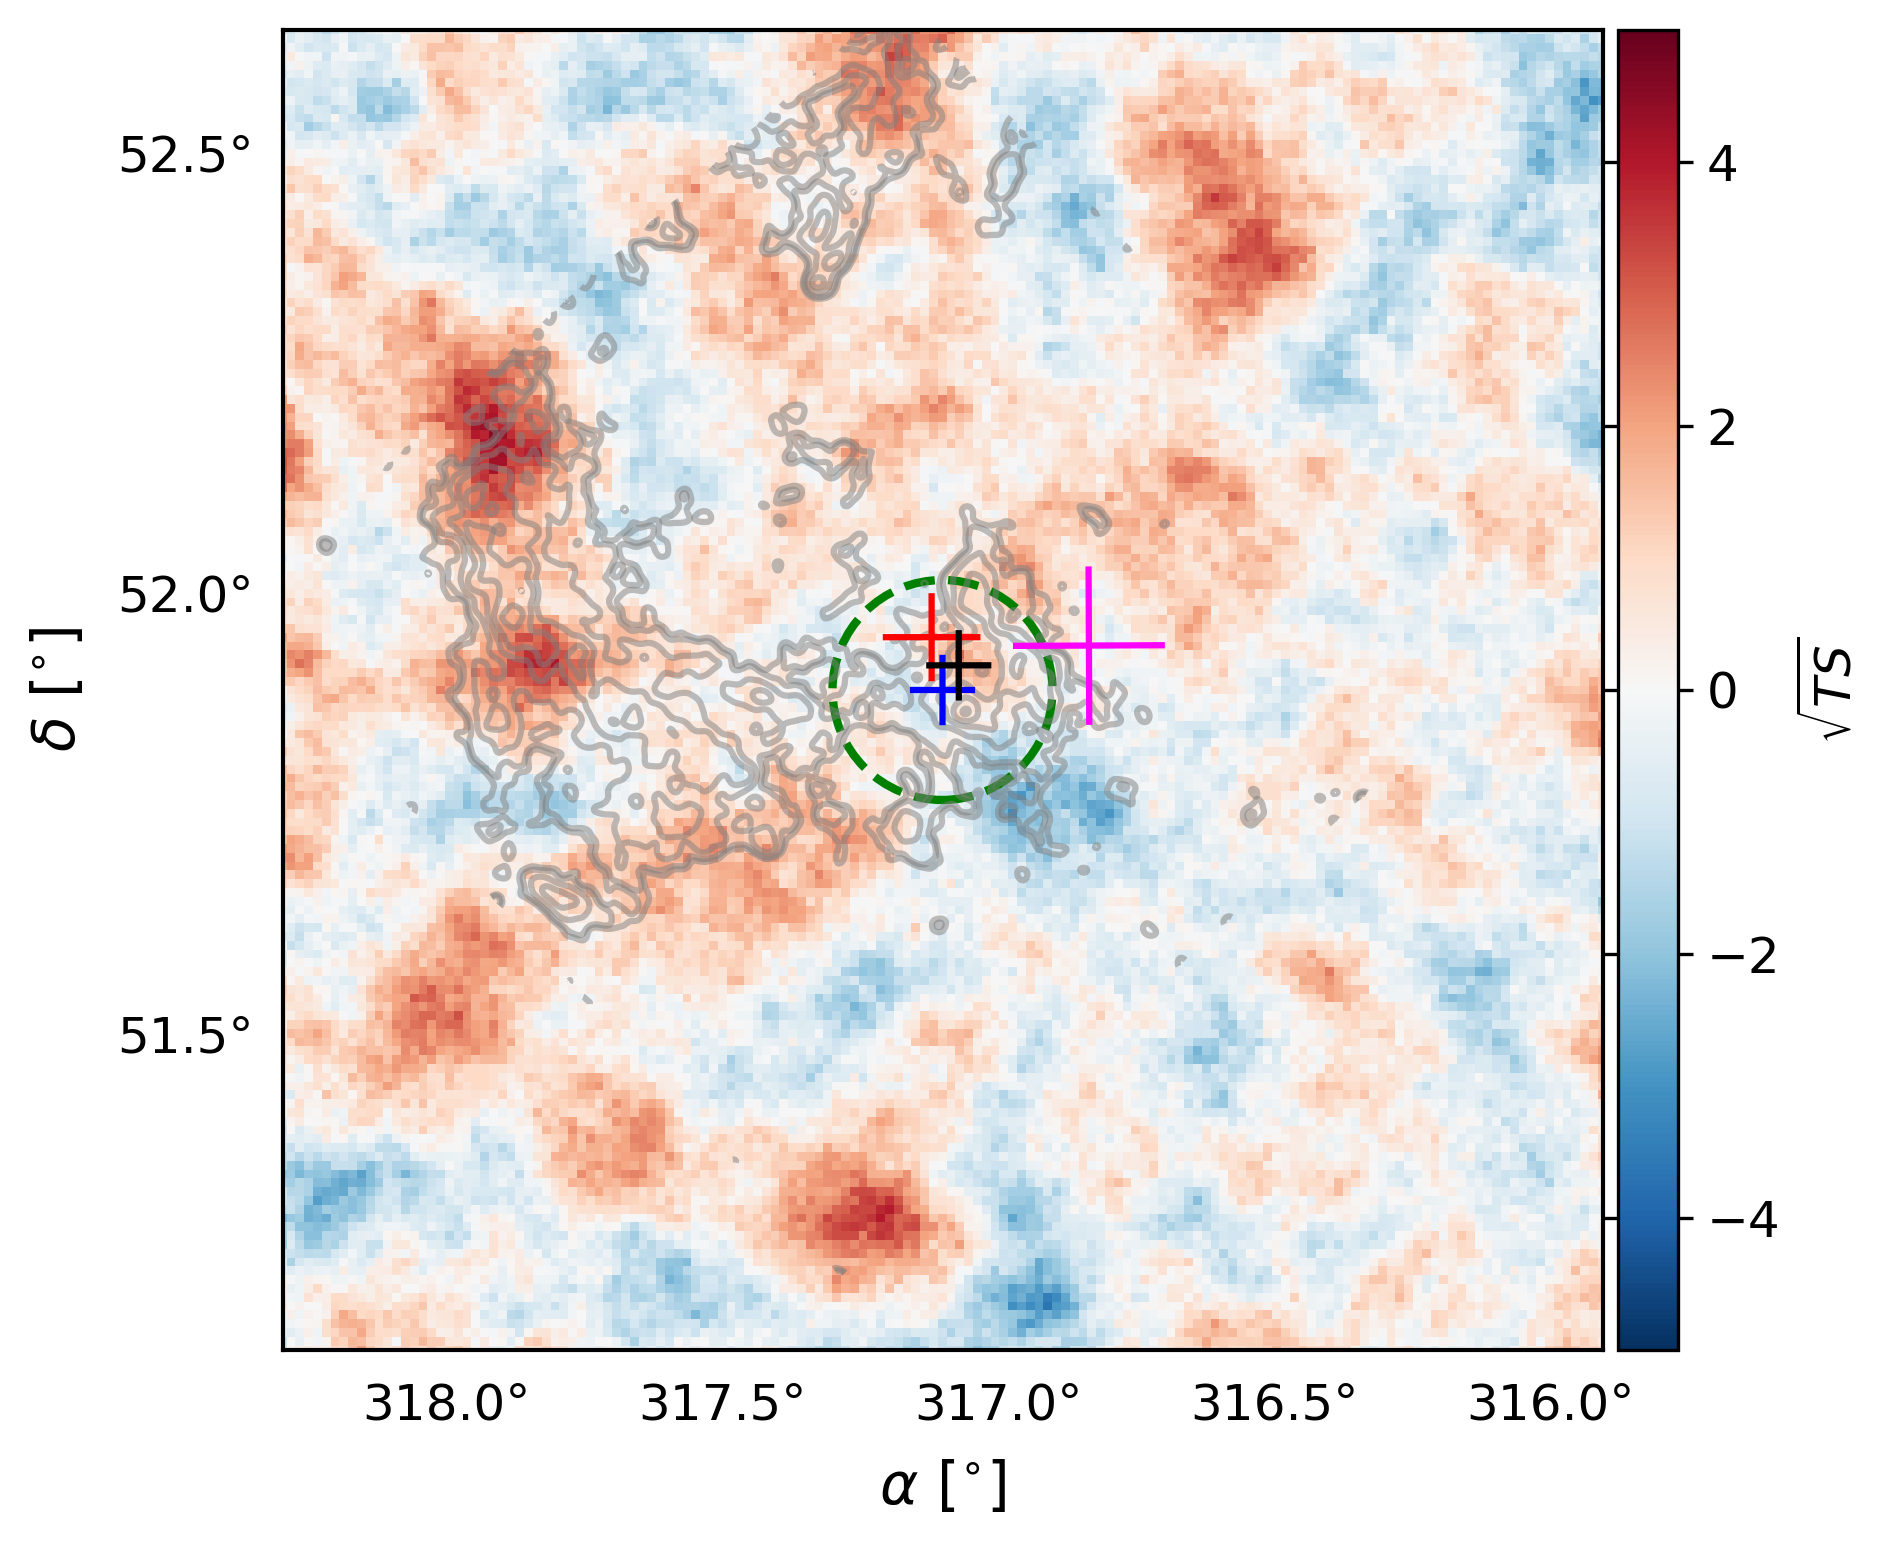
Figure 1: VERITAS significance map above 200 GeV, created with an integration radius of 0.09◦. The green dotted circle shows the integration radius (θ = 0.25◦) used to extract spectral ULs from VERITAS. The best-fit positions measured by WCDA, KM2A, HAWC and Fermi-LAT with their error bars are also shown as magenta, blue, red and black plus signs respectively. Light gray contours from the 13CO map, integrated between -20 to -8 km s−1, are also shown. These contours correspond to levels of [−4, 4, 5, 8, 12, 16, 20] times the rms value of 0.5 K km s−1 (de la Fuente et al. 2023).
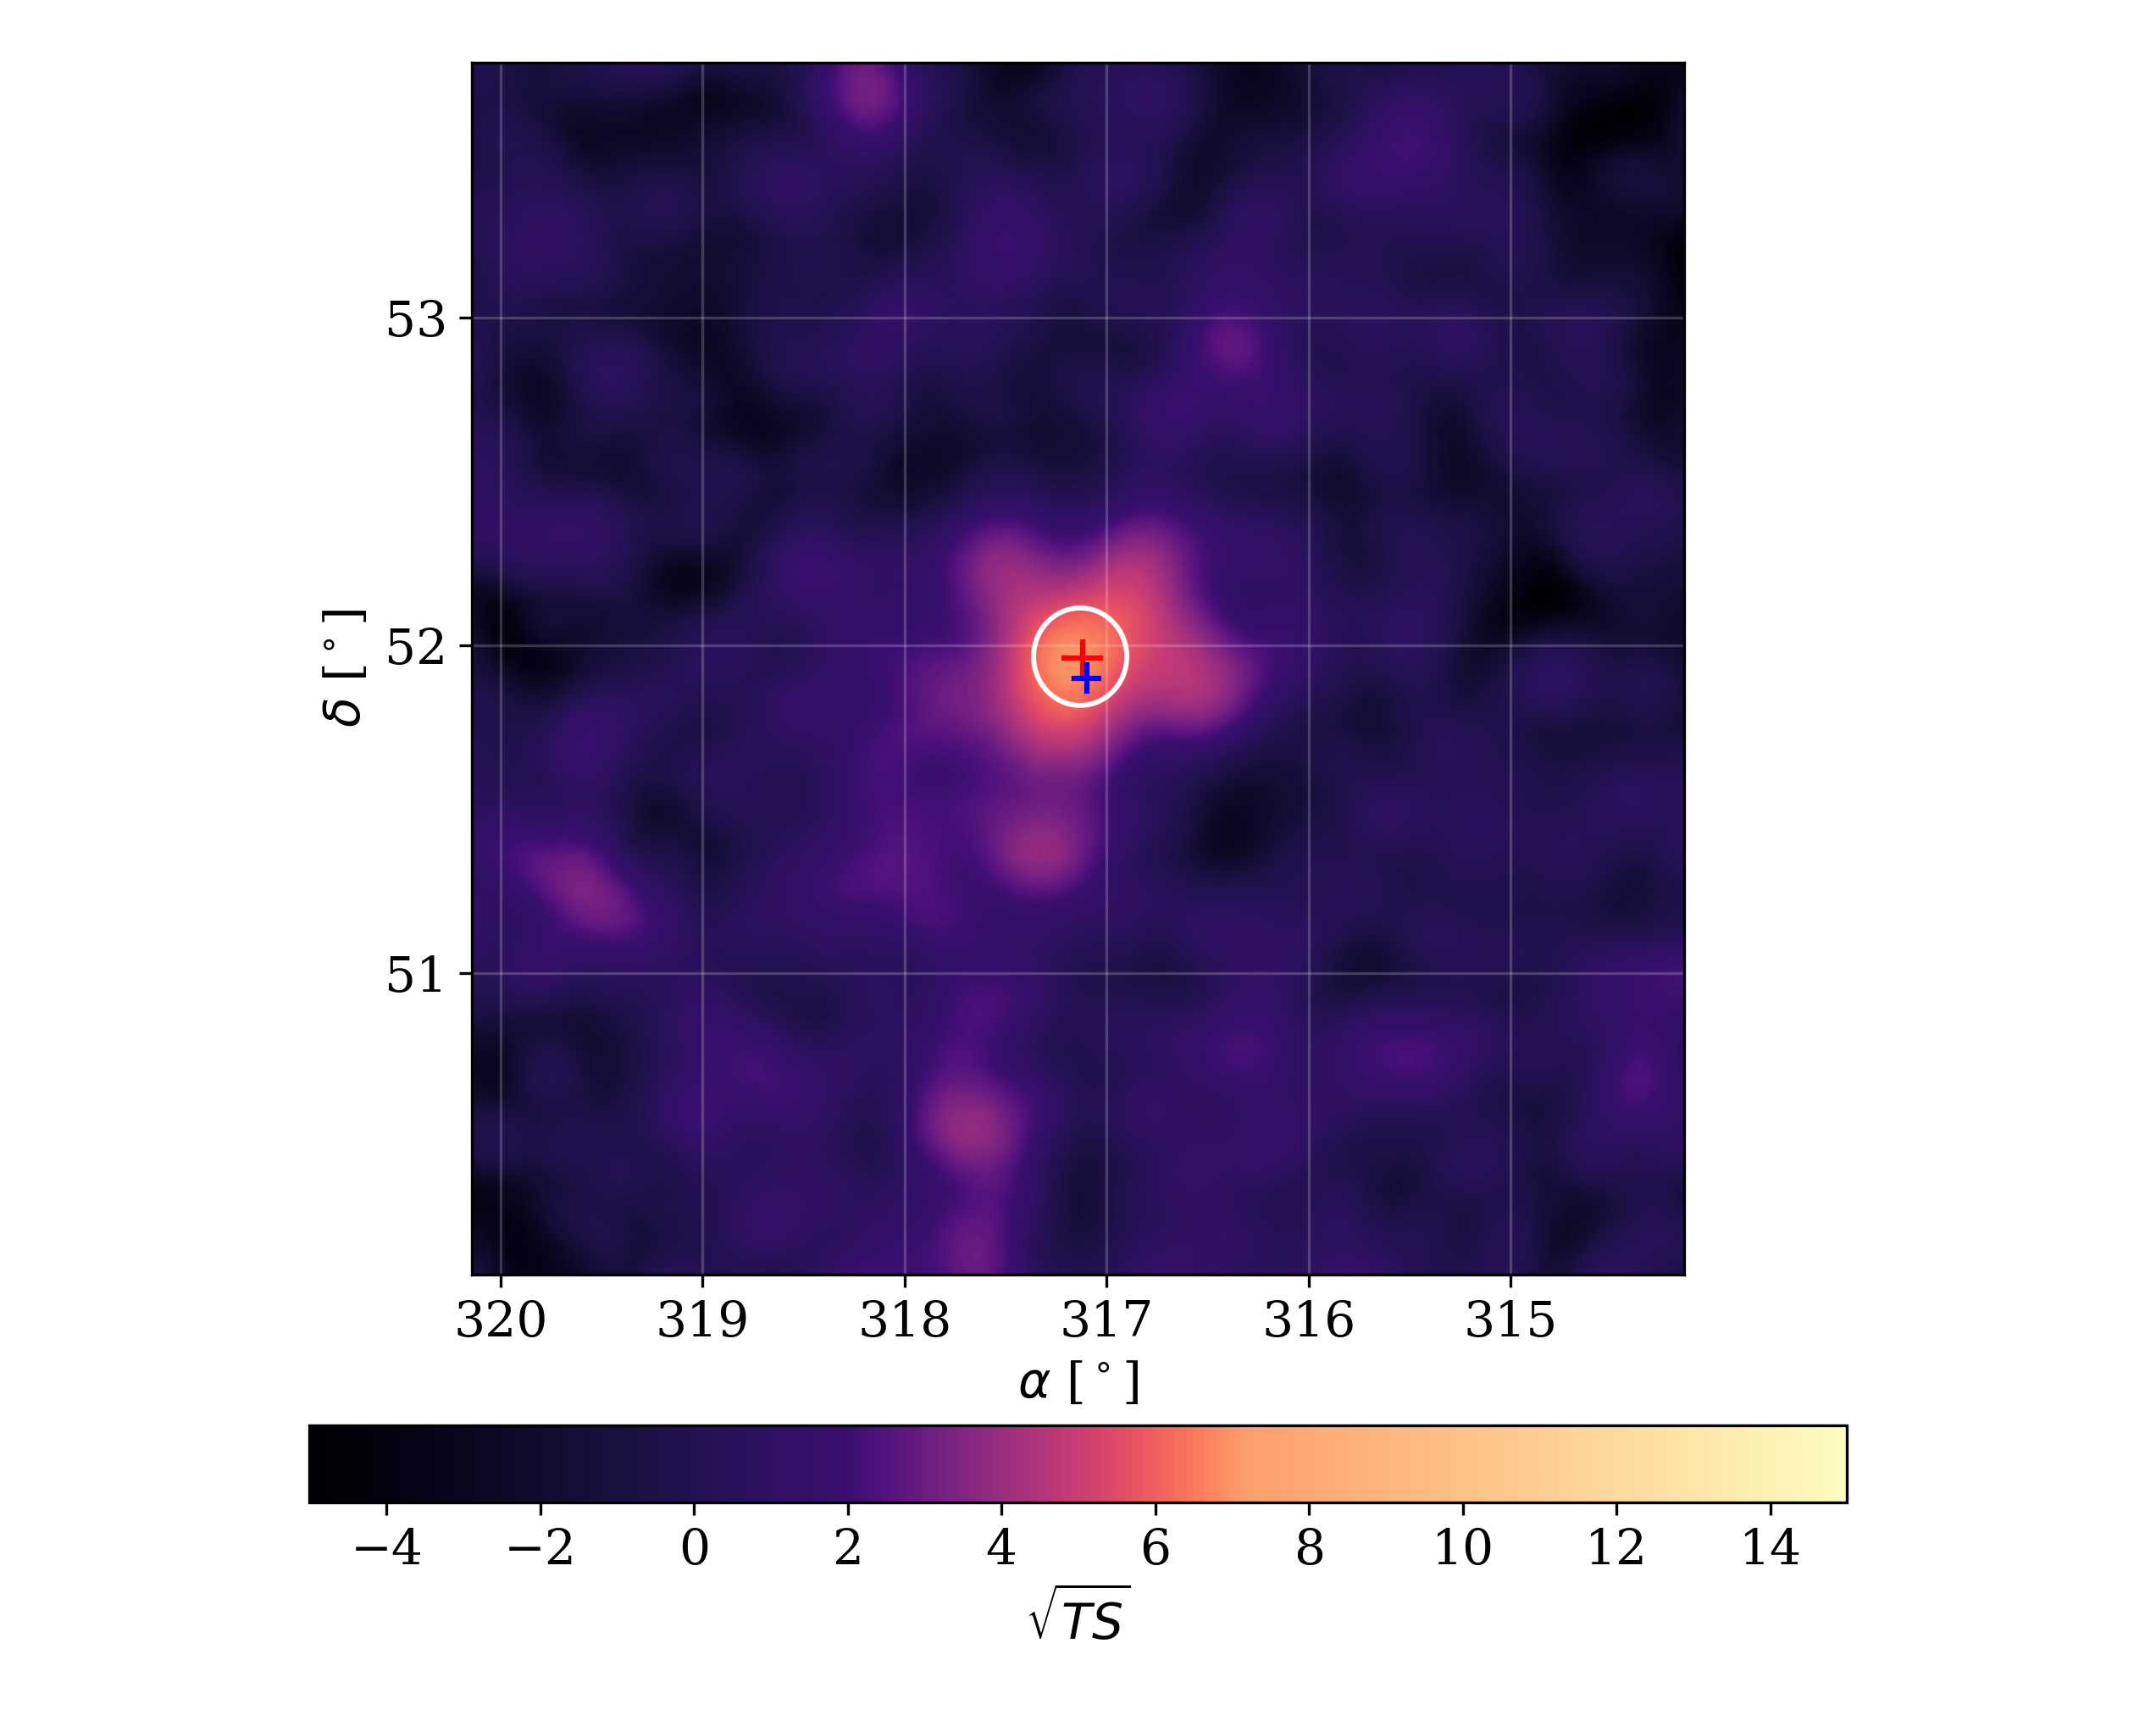
Figure 2: HAWC significance map of the LHAASO J2108+5157 region above 300 GeV. The best-fit positions measured by HAWC and KM2A are represented as red and blue markers, respectively, along with their error bars. A white circle around the HAWC position indicates the best fit extension.
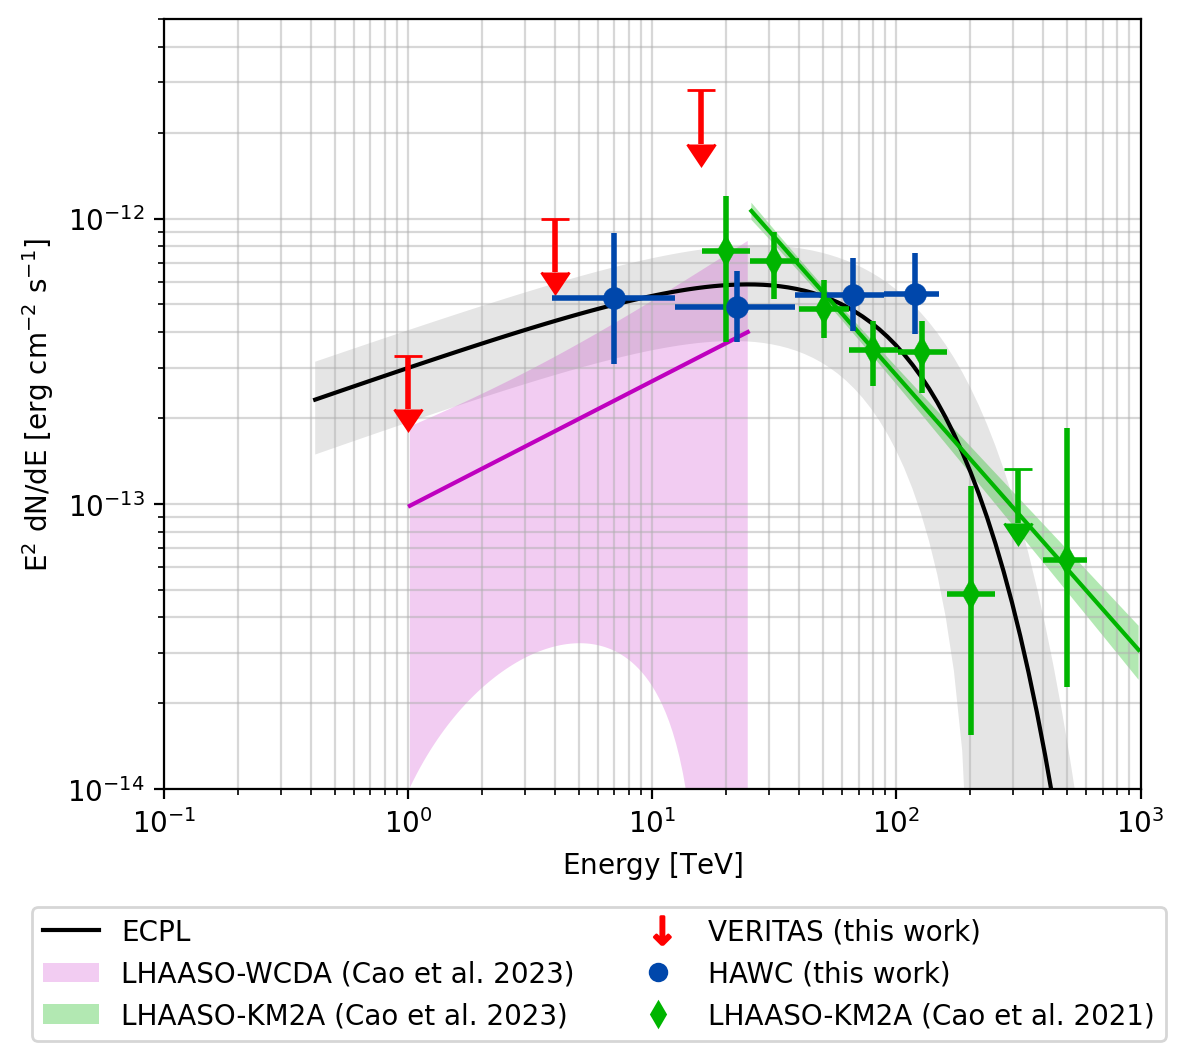
Figure 3: The spectral energy distribution of LHAASO J2108+5157 measured by VERITAS and HAWC. Notably, the VERITAS ULs are derived from a circular region with 0.25◦ radius for energies above a threshold of 500 GeV. The data from LHAASO-KM2A reported in Cao et al. (2021) were included in the joint fit. The fitting model used is a power-law with exponential cutoff (ECPL). The spectral index is fixed to a value of 1.7, consistent with Cao et al. (2023). This fitting constrains the cutoff energy to 82±30 TeV. The gray band represents the 68% error band of the ECPL model. The magenta and green bands represent the power-law spectral energy distribution plots for WCDA and KM2A, respectively, as reported in Cao et al. (2023).
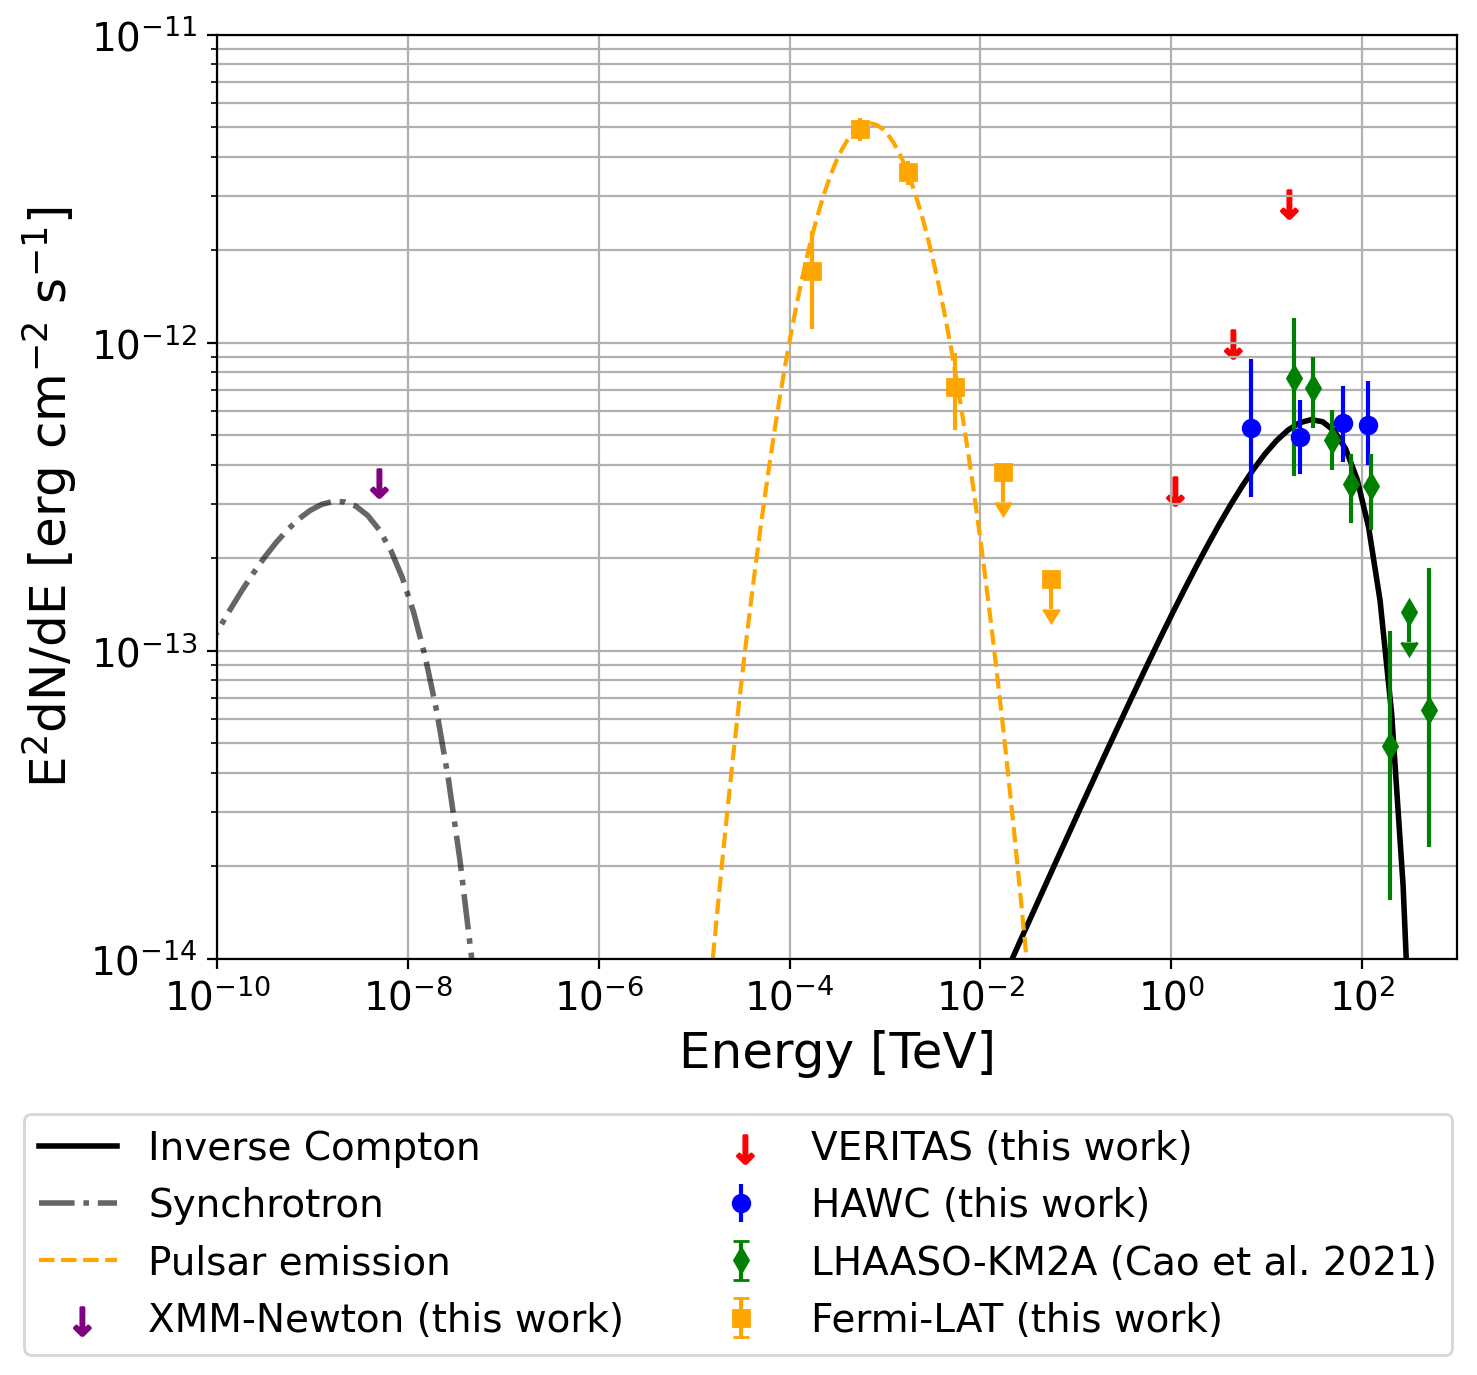
Figure 4: Leptonic model under the assumption of PWN as source class. The sharp cutoff around 100 TeV observed by LHAASO-KM2A favors a super-exponential cutoff (β = 2) in the electron spectrum. Our benchmark model with the electron power-law index αe = 1.6 and cutoff energy Ee,cut = 196 TeV explains the VERITAS, HAWC, and LHAASO observations. Our XMM-Newton flux UL constrains the magnetic field to ≲ 1.5 μG.
