Flat spectrum radio quasars (FSRQs) are the most luminous blazars at GeV energies, but only rarely emit detectable fluxes of TeV gamma rays, typically during bright GeV flares. In this paper, we explore the gamma-ray variability and spectral characteristics of three FSRQs that have been observed at GeV and TeV energies by Fermi-LAT and VERITAS, making use of almost 100 hours of VERITAS observations spread over 10 years: 3C 279, PKS 1222+216, and Ton 599.
We explain the GeV flux distributions of the sources in terms of a model derived from a stochastic differential equation describing fluctuations in the magnetic field in the accretion disk, and estimate the timescales of magnetic flux accumulation and stochastic instabilities in their accretion disks. We identify distinct flares using a procedure based on Bayesian blocks and analyze their daily and sub-daily variability and gamma-ray energy spectra.
Using observations from VERITAS as well as Fermi, Swift, and the Steward Observatory, we model the broadband spectral energy distributions of PKS 1222+216 and Ton 599 during VHE-detected flares in 2014 and 2017, respectively, strongly constraining the jet Doppler factors and gamma-ray emission region locations during these events. Finally, we place theoretical constraints on the potential production of PeV-scale neutrinos during these VHE flares.
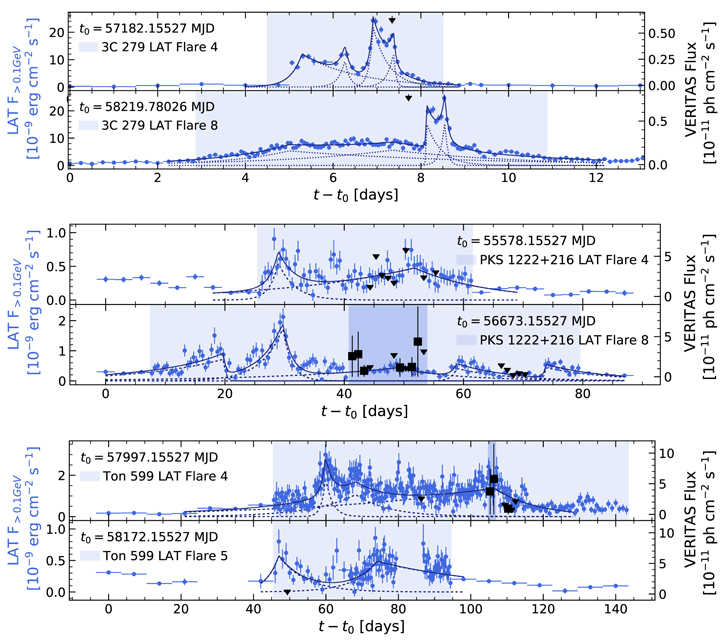
Figure 1: Fermi-LAT light curves of 3C 279 (top), PKS 1222+216 (middle), and Ton 599 (bottom). The flux points (black circles) are shown for 1, 3, and 7 day time bins for the three sources, respectively. 5σ �Bayesian blocks are shown with blue lines. The time intervals in which VERITAS observed the sources are marked in magenta. For 3C 279, time intervals in which the Sun is less than 20o� from the source are shown in orange and a Fermi-LAT low state from MJD 56230-56465 (see Section 6) is marked with a dashed line.
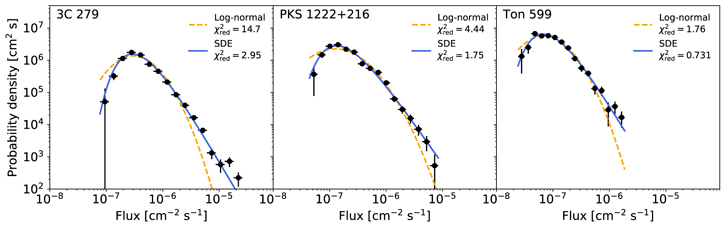
Figure 2: Flux distributions of the three FSRQs, scaled as probability densities. The distributions are fit with a log-normal PDF (dashed orange) and the stationary-state PDF corresponding to the SDE of Tavecchio et al. (2020) (solid blue). In all three cases, the SDE provides a better �fit.
Figure 3: LAT daily and sub-daily light curves (blue points) around selected flaring episodes (light shaded areas). The dotted blue lines show the fi�tted exponential profi�les, with their sums shown in solid blue. The dark shaded areas indicate the periods considered for the SED modeling (Section 7). The VERITAS data points and 95% upper limits are shown as black squares and downwards arrows.
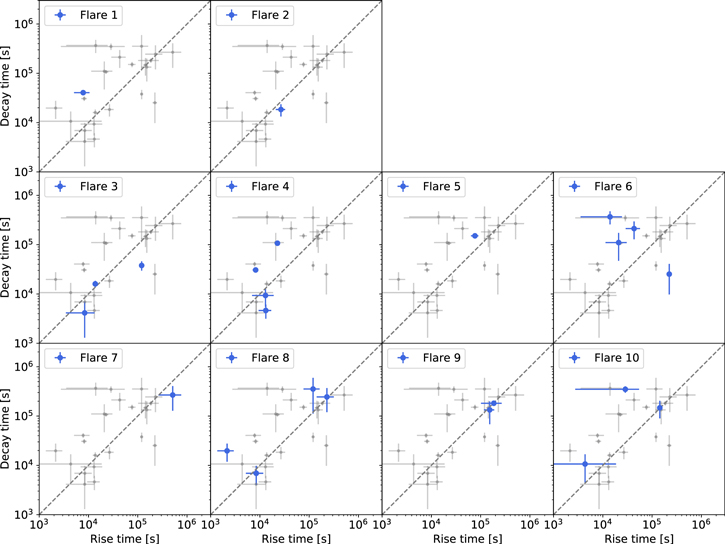
Figure 4: Decay time vs. rise time for each of the resolved exponential components in the flares of 3C 279. The points corresponding to all of the components are shown in gray. The dashed reference line shows where the rise and decay times are equal.
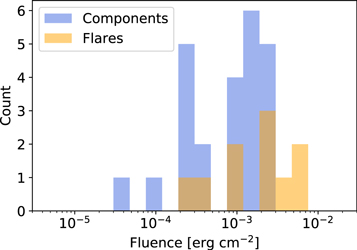
Figure 5: Fluence distributions of the twenty-four resolved are components and ten flares of 3C 279.
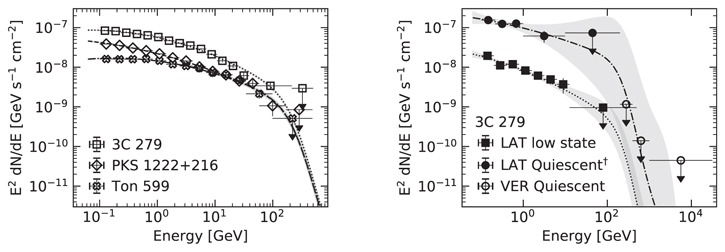
Figure 6: Left: Global Fermi-LAT spectra for 3C 279, PKS 1222+216, and Ton 599. The LAT spectra are extrapolated to the VERITAS energy range, incorporating EBL absorption. Right: Two baseline states of 3C 279. The Fermi-LAT spectrum corresponding to the multiwavelength low state (MJD 56230-56465; see Figure 1), is shown by �filled squares. The strictly simultaneous Fermi-LAT spectrum and VERITAS spectral upper limits during the quiescent state are shown by black fi�lled and unfilled circles and contours. The superscript in the legend of the right-hand plot indicates that the LAT spectrum corresponds to data strictly simultaneous with VERITAS observations. Downward arrows show 95% con�dence level upper limits.

Figure 7: Fermi-LAT spectrum and VERITAS spectral upper limits of 3C 279 during four flares, strictly simultaneous with the VERITAS observations. The quiescent spectrum (gray circles and contour) is shown for comparison. The strictly simultaneous quiescent state LAT data and VERITAS upper limits are represented with �filled and unfi�lled markers, respectively. The LAT spectra are extrapolated to the VERITAS energy range, incorporating EBL absorption. Downward arrows show 95% con�fidence level upper limits.
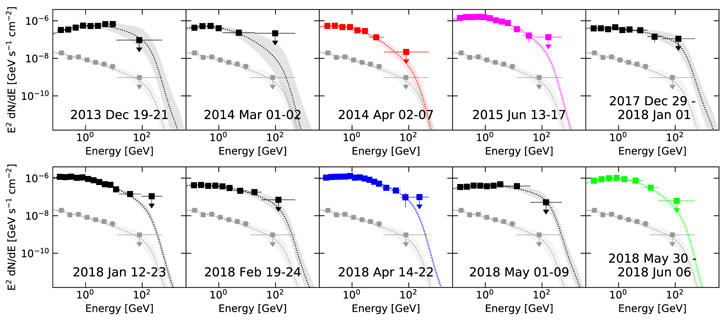
Figure 8: Fermi-LAT spectra of 3C 279 during ten flares, for the intervals selected using the algorithm proposed in this work and described in Section 4. For comparison, the LAT low state spectrum is shown in gray squares in all of the panels. The four flares shown in color have a corresponding spectrum in Figure 7.
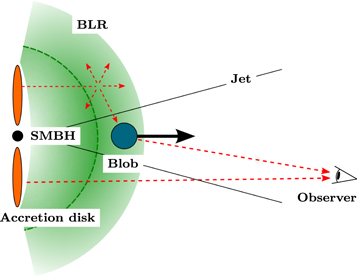
Figure 9: A schematic illustration of the emission model used in this work (not to scale). The green dashed arc represents the nominal BLR radius rBLR corresponding to the region of the maximal BLR density. The observer measures the beamed emission from the blob interacting with the BLR as well as the accretion disk's thermal emission. The accretion disk is assumed to be a point source.
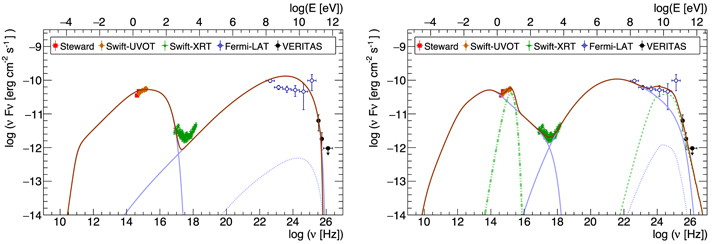
Figure 10: Broadband SED of PKS 1222+216 during the VERITAS detection from UT 2014-02-26 to 2014-03-10. Left: Pure synchrotron self-Compton model. Right: Model considering an external inverse Compton component at high energy from the interaction of blob particles with the thermal accretion disk emission reprocessed by the BLR. The solid blue lines show synchrotron and SSC emission; the dotted blue line shows second-order self-Compton emission; the heavy dashed green line shows thermal emission from the accretion disk; and the dashed green line shows inverse Compton emission from the BLR. The EBL absorption is taken into account considering the model of Franceschini & Rodighiero (2017).
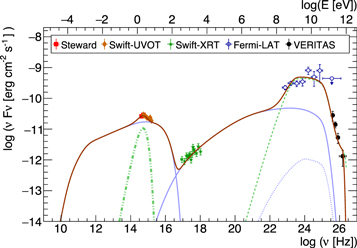
Figure 11: Broadband SED of Ton 599 during the VERITAS detection from UT 2017-12-15 to 2017-12-16. The solid blue lines show synchrotron and SSC emission; the dotted blue line shows second order self-Compton emission; the heavy dashed green line shows thermal emission from the accretion disk; and the dashed green line shows inverse Compton emission from the BLR.
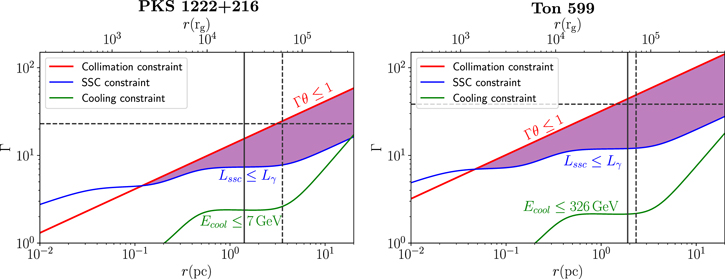
Figure 12: Constraints on the Lorentz factor Γ and distance r between the gamma-ray emission location and central black hole, adapted from Nalewajko et al. (2014). The allowed region is fi�lled in purple. The black vertical line shows the opacity constraint on r derived from the BLR modeling. The values of Γ and r derived from the SED modeling are indicated with dashed black lines.
