The Galactic Center (GC) region hosts a variety of powerful astronomical sources and rare astrophysical processes that emit a large flux of nonthermal radiation. The inner 375 pc × 600 pc region, called the Central Molecular Zone, is home to the supermassive black hole Sagittarius A*, massive cloud complexes, and particle accelerators such as supernova remnants (SNRs). We present the results of our improved analysis of the very-high-energy gamma-ray emission above 2 TeV from the GC using 125 hr of data taken with the Very Energetic Radiation Imaging Telescope Array System imaging-atmospheric Cerenkov telescope between 2010 and 2018. The central source VER J1745?290, consistent with the position of Sagittarius A*, is detected at a significance of 38 standard deviations above the background level (38σ), and we report its spectrum and light curve. Its differential spectrum is consistent with a power law with exponential cutoff, with a spectral index of 2.12+0.22-0.17, a flux normalization at 5.3 TeV of 1.27+0.22-0.23 × 10⁻¹³ TeV-1 cm-2 s-1, and cutoff energy of 10.0+4.0-2.0 TeV. We also present results on the diffuse emission near the GC, obtained by combining data from multiple regions along the GC ridge, which yield a cumulative significance of 9.5σ. The diffuse GC ridge spectrum is best fit by a power law with a hard index of 2.19 ± 0.20, showing no evidence of a cutoff up to 40 TeV. This strengthens the evidence for a potential accelerator of PeV cosmic rays being present in the GC. We also provide spectra of the other sources in our field of view with significant detections, composite SNR G0.9+0.1, and HESS J1746-285.
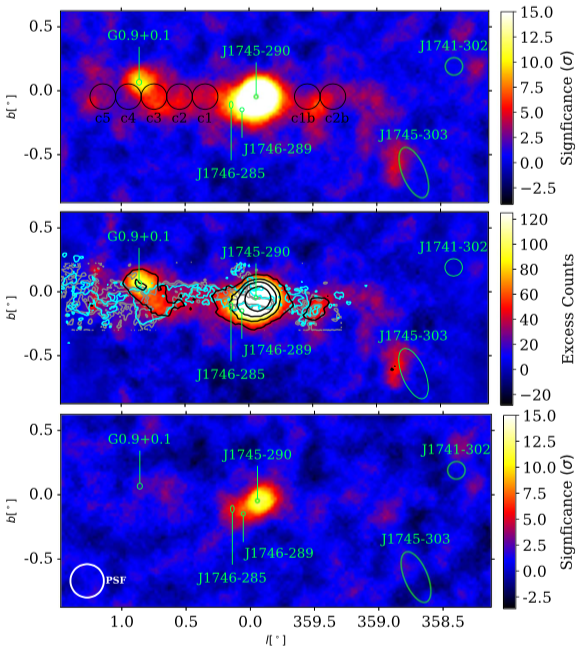
Figure 1: Maps of the statistical signifi�cance for gamma-ray-like events detected by VERITAS above 2 TeV (top) and 10 TeV (bottom) from this analysis, as well as the map of acceptance-corrected correlated excess counts above 2 TeV (middle). The significance scale is limited to 15σ� so the structure along the ridge can be seen in detail. Each pixel of the correlated excess map displays the excess counts integrated over 0.1o� circular signal regions centered on the pixel, and has been convolved with the VERITAS PSF, shown in the bottom-left. Positions and 68% con�fidence regions are shown for previously detected point sources (green ellipses), while the ellipses for J1741-302 and J1745-303 represent their spatial extents (Abdalla et al. 2018b; Aharonian et al. 2006c). The signal regions used in the di�ffuse ridge analysis are shown in the top panel (black circles), labeled as in Abramowski et al. (2016). Contours of CS (cyan; Tsuboi et al. 1999) and HCCCN line emission (gray; Jones et al. 2011), which trace dense molecular gas, are shown in the middle panel, along with signifi�cance contours of 5, 10, 15, and 25σ� (black) from this analysis.
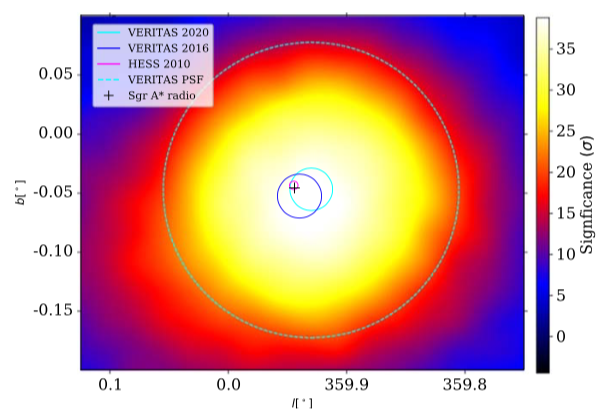
Figure 2: Signifi�cance map of the central source VER J1745-290, with the full scale of statistical signifi�cance. The 68% con�fidence region on the position of the source is given for this analysis (cyan) and Archer et al. (2016, blue), as well as that of Acero et al. (2010) for HESS J1745-290 (magenta). The dashed line is the 68% containment radius of the VERITAS PSF, centered on the best-�fit position of VER J1745{290 from this analysis. The radio position of Sgr A* from Reid & Brunthaler (2004) is marked by the black cross.
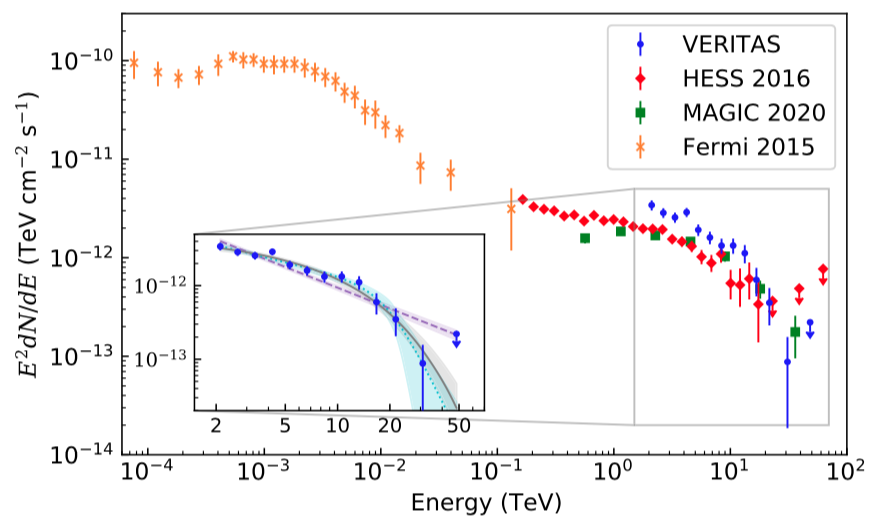
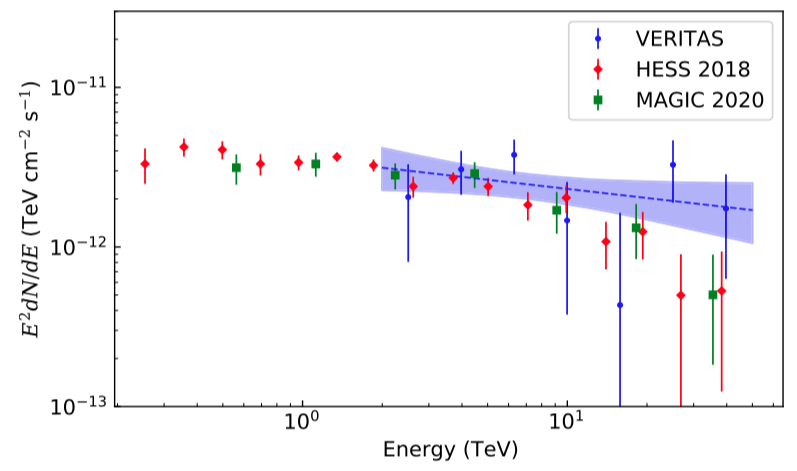
Figure 3: Di�fferential energy spectrum of the central source coincident with the position of Sgr A*, as measured by VERITAS (blue), H.E.S.S. (red; Abramowski et al. 2016), MAGIC (green; Acciari et al. 2020), and Fermi-LAT (orange; Malyshev et al. 2015). Error bars represent 1�σ uncertainties in the flux. The downward arrows represent 95% upper limits. In the inset, the best-�fit exponentially cutoff� power law (gray solid line), broken power law (cyan dotted line), and power law (purple dashed line) are shown. Shaded regions represent the 1σ� confi�dence band on the model fi�ts.
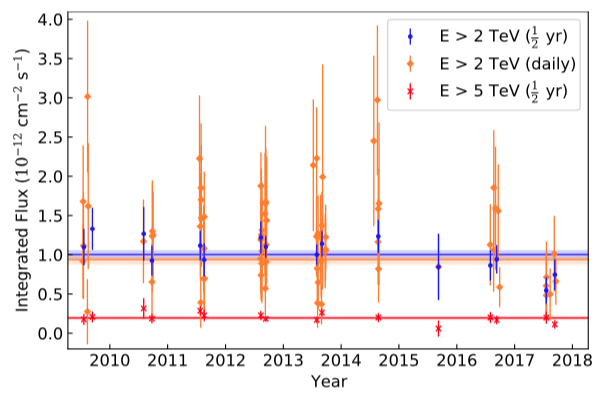
Figure 4: Semi-annually binned light curves of the integral flux above 2 TeV (blue) and 5 TeV (red) of J1745{290, showing flux versus time. Also shown is the daily light curve above 2 TeV (orange). The weighted means are shown as horizontal lines of the corresponding color, while the shaded regions indicate the 68% con�fidence interval on the mean.
Figure 5: Di�fferential energy spectrum of the di�ffuse ridge emission measured by VERITAS (blue) from the combined circular regions along the GC ridge (blue), with the normalization scaled to what would be measured in the signal region used by (Abdalla et al. 2018a), as described in Section 5.1. For comparison, the spectra measured by H.E.S.S. (red; Abdalla et al. 2018a) and MAGIC (green; Acciari et al. 2020) are shown. Error bars represent 1σ� uncertainties. The best-fi�t power law (blue dashed line) and 1�σ confi�dence band on the model fi�t (shaded region) are also shown.
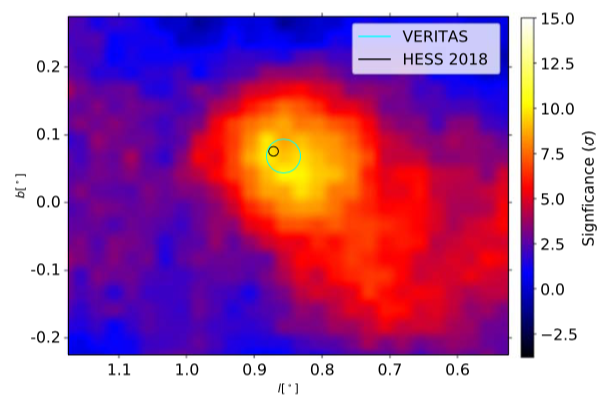
Figure 6: Signi�ficance map of the region around G0.9+0.1, showing gamma-ray signifi�cances as determined by VERITAS in this analysis. The best-fi�t positions and 68% con�fidence regions are shown for this work (cyan) and H.E.S.S. (black; Abdalla et al. 2018c).
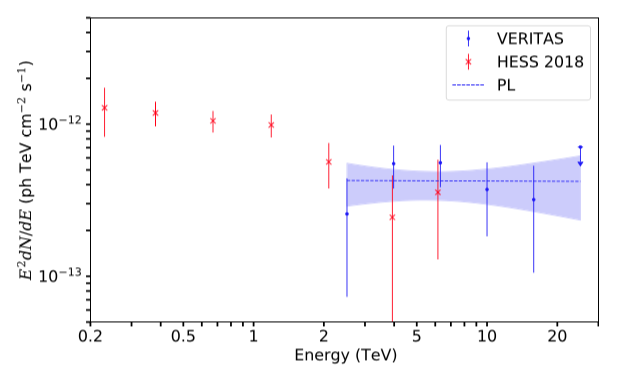
Figure 7: Diff�erential energy spectrum at the position of G0.9+0.1, as measured by VERITAS (blue), with the H.E.S.S. spectrum also shown (red; Abdalla et al. 2018c). Error bars represent 1σ� uncertainties in the flux. The downward arrow represents a 95% upper limit. The best-fi�t power law (blue dashed line) is shown. The shaded region represents the 1�σ confi�dence band on the model fi�t.
Figure 8: Differential energy spectrum at the position of HESS J1746-285, as measured by VERITAS (blue), with the H.E.S.S. spectrum also shown (red; Abdalla et al. 2018c). Error bars represent 1σ� uncertainties in the flux. The downward arrow represents a 95% upper limit. The best-fi�t power law (blue dashed line) is shown. The shaded region represents the 1�σ con�fidence band on the model fi�t.