High angular resolution observations at optical wavelengths provide valuable insights in stellar astrophysics, directly measuring fundamental stellar parameters, and probing stellar atmospheres, circumstellar disks, elongation of rapidly rotating stars, and pulsations of Cepheid variable stars. The angular size of most stars are of order one milli-arcsecond or less, and to spatially resolve stellar disks and features at this scale requires an optical interferometer using an array of telescopes with baselines on the order of hundreds of meters. We report on the successful implementation of a stellar intensity interferometry system developed for the four VERITAS imaging atmospheric-Cherenkov telescopes. The system was used to measure the angular diameter of the two sub-mas stars - β Canis Majoris and ε Orionis with a precision better than 5%. The system utilizes an off-line approach where starlight intensity fluctuations recorded at each telescope are correlated post-observation. The technique can be readily scaled onto tens to hundreds of telescopes, providing a capability that has proven technically challenging to current generation optical amplitude interferometry observatories. This work demonstrates the feasibility of performing astrophysical measurements with imaging atmospheric-Cherenkov telescope arrays as intensity interferometers and the promise for integrating an intensity interferometry system within future observatories such as the Cherenkov Telescope Array.
FITS files: N/A
Figures from paper (click to get full size image):
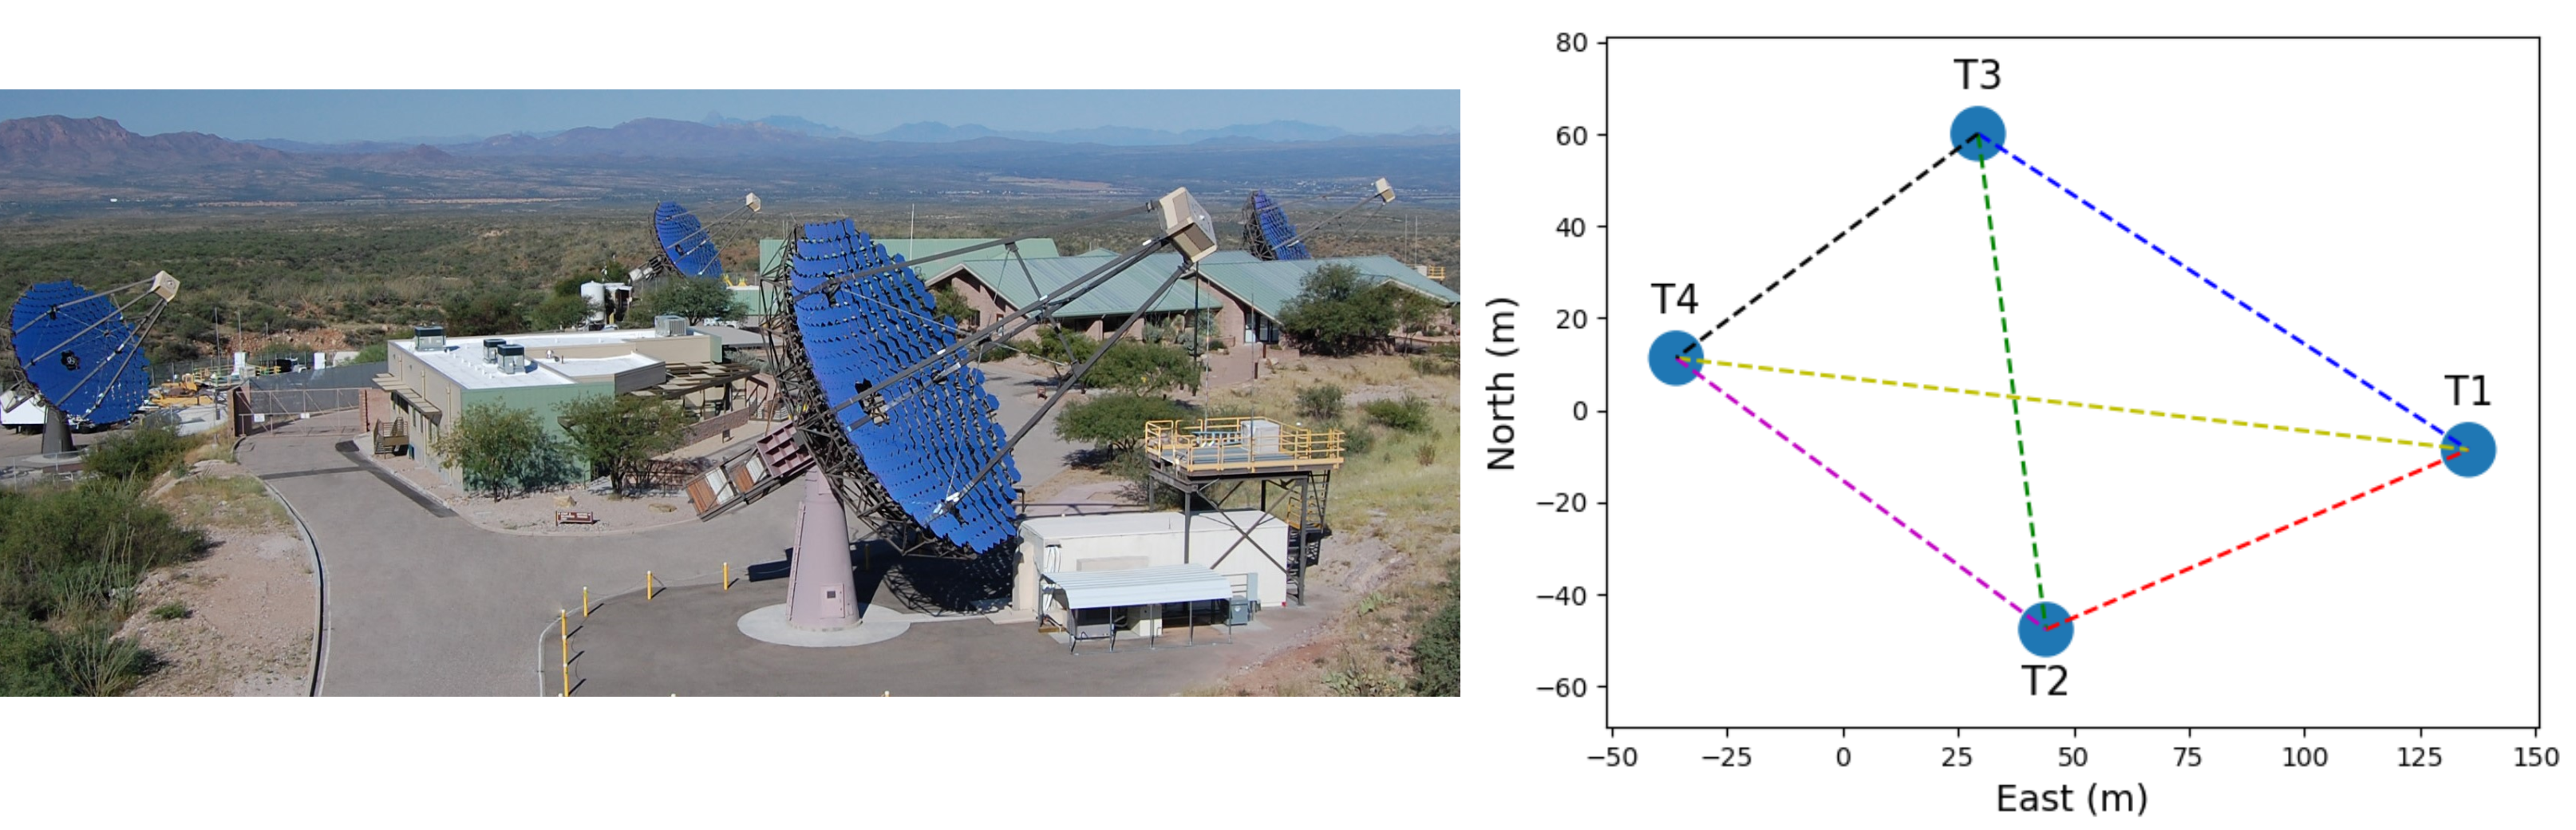
Figure 1: The VERITAS array. The left image shows a photograph of VERITAS located at the Fred Lawrence Whipple Observatory located in Amado, Az. The array consists of four 12 m diameter telescopes, T1 (front-center), T2 (leftmost), T3 (rightmost), T4 (back-center). The right plot shows a top-down view of the array with each of the radial telescope separations.
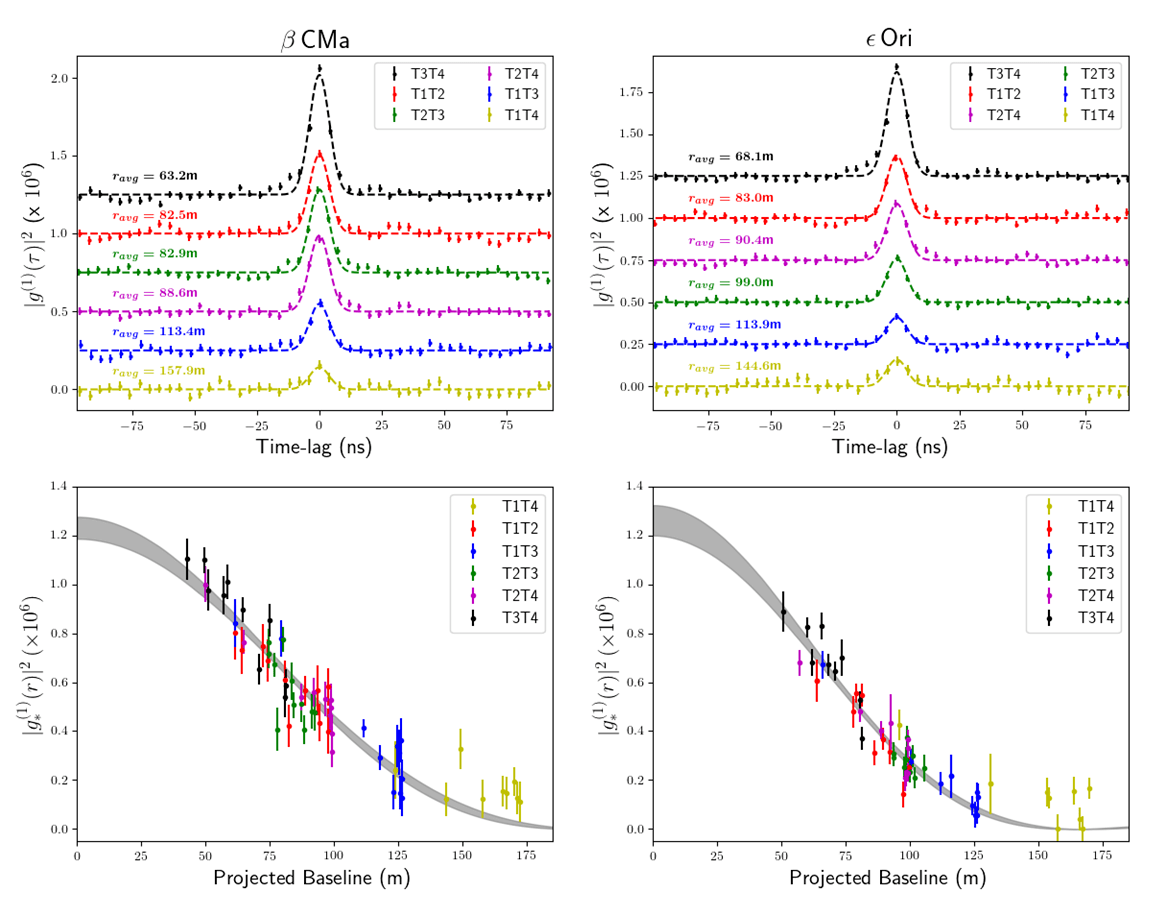
Figure 2: Temporal and spatial coherence measurements.The top two panels show the averaged |g(1)(τ)|2correlation measurements over the full live time between different pairs of telescopes for βCMa (left) and ε Ori (right). Each respective telescope pair measurement is color-coded matching the combinations shown in Figure 1. The uncertainties are given by the standard deviation of the mean normalized correlation and are estimated independently for each time-lag. The correlations are ordered by increasing average baseline from the top, corresponding to decreasing spatial coherence. The dashed lines show Gaussian fits to the data.The amplitude and corresponding fit uncertainty of the |g(1)(τ)|2 peak over shorter time intervals are obtained as a function of the baseline and shown by the individual points in the bottom panels. The uncertainty is determined by the square root of the covariance matrix resulting from the fit. These measurements are fit to a function that approximates the star as a uniform disk (see Eq. 3) and includes free parameters for the overall normalization and angular diameter. The shaded area shows the 68 % confidence intervals determined through the uncertainty in the fit parameters.
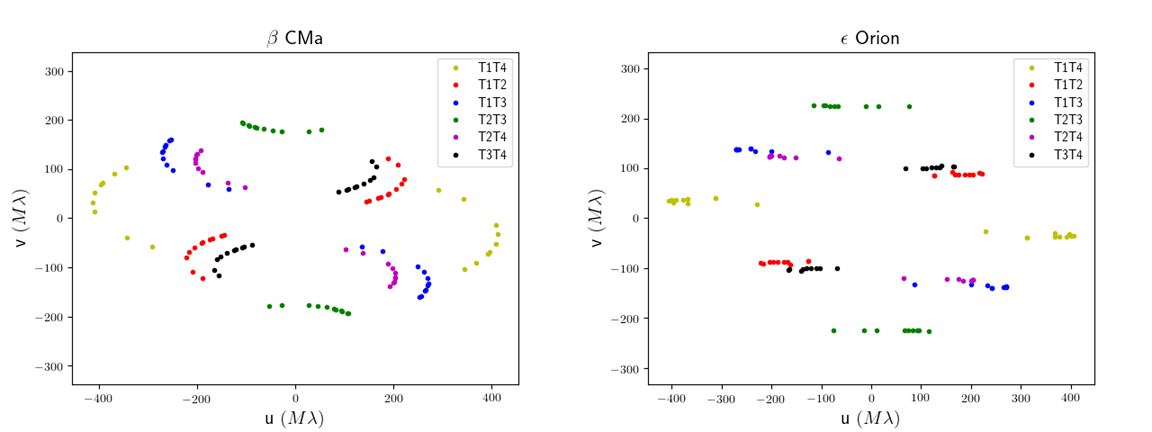
Extended Data - Figure 1: Coverage of the sources in the (u,v) plane. Each of the coloured points represents different runs for a given telescope pair.